Fixed Income: Build a Protective Barbell Strategy with These Bond ETFs
With the short end of the curve offering attractive yields and the long providing diversification, Erika Toth, Director, Institutional & Advisory, Eastern Canada, runs down a series of options for a barbell approach that can strengthen any portfolio.


After historic moves in interest rates last year, the bond market appears to be normalizing back into conventional trading patterns, with clients and investors once again increasing fixed-income positions within portfolios and adding duration back into their bond sleeves.
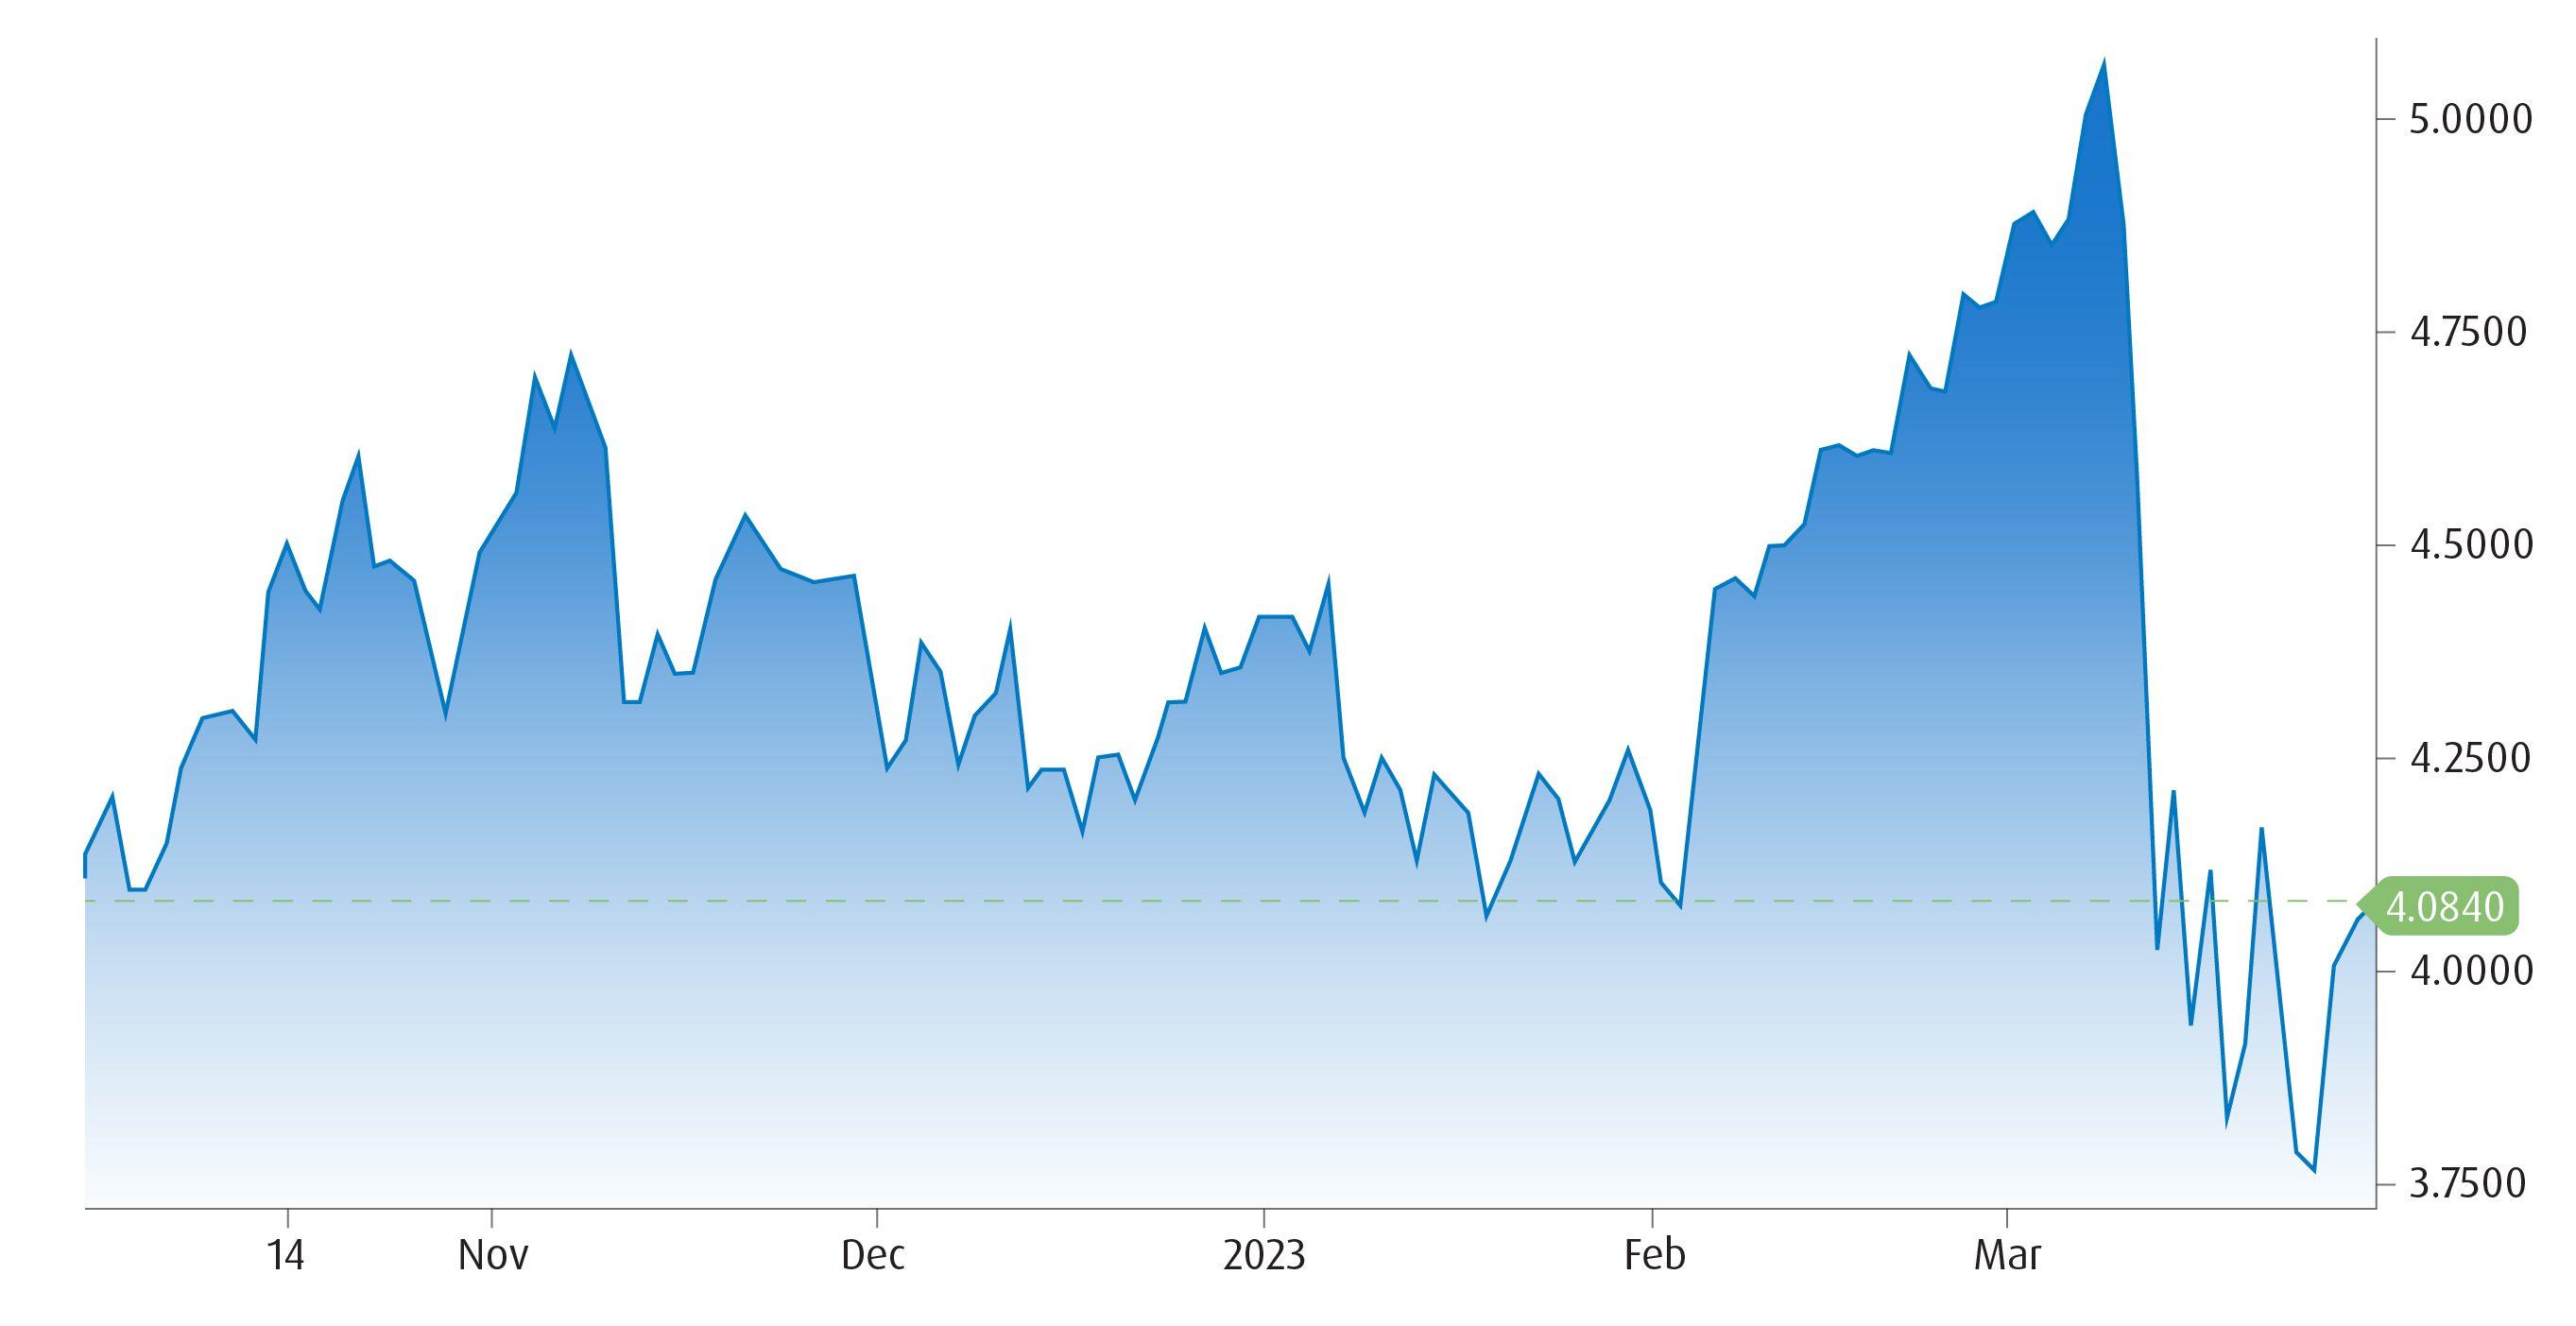
Given recent events, these moves have proven to be astute. The collapse of Silicon Valley Bank (SVB) and Signature Bank of New York in early March shook market confidence momentarily to its foundations, prompting the largest move in U.S. Treasuries since Black Monday in October, 1987, despite the U.S. Federal Reserve’s move to backstop deposits.
The U.S. 2-year Treasury yield’s March plummet
Barbell strategy
Cash instruments and short-duration bonds continue to offer attractive returns, carrying yield to maturities (YTMs) in the 4-5% range.1 In the current environment, we’ve been advocates of the barbell trade — allocating a portion of a fixed-income portfolio to exposures at the short end of the curve in order to collect good yields that come with little volatility or credit risk, while allocating another tranche to long-dated government bonds.
For short-end positions, BMO Global Asset Management offers several options including the BMO Money Market Fund ETF Series (ticker: ZMMK) and the BMO Ultra Short-Term Bond ETF (ticker: ZST), with each ETF offering YTMs of close to 5% as of late March.2
Those looking to diversify away from Canadian fixed income should consider the U.S. bond market and its more diversified pool of issuers. The BMO Ultra Short-Term US Bond ETF (ticker: ZUS.U) gives Canadian asset managers well-diversified exposure and yield premiums over Canadian credit. ZUS.U’s YTM, for example, topped 5.1% at the end of March.3
Current benchmark interest rates combined with a steep yield curve inversion have created an opportunity for investors in these funds to generate income, without having to take on added credit or duration risk. But to complement the short corporate bond exposure and effectively execute a barbell strategy that provides a risk offset to a portfolio, consider adding government long duration exposure.
Longer-dated options
The economic outlook is dimming, with growth expectations dropping. Bolting on long-duration exposure at the other end of your barbell serves as a risk offset, including against equity market volatility.
The BMO Long Federal Bond Index ETF (ticker: ZFL) and BMO Long-Term US Treasury Bond Index ETF (ticker: ZTL) are both well positioned as long-end holdings that can execute a barbell trade that generates higher yields on the short end while creating portfolio protection. In fact, both funds were BMO GAM’s top-selling fixed-income ETFs in Canada5 following the collapse of SVB and subsequent bond market gyrations.
ZTL is the Canadian-listed version of the iShares 20-Plus Year Treasury Bond ETF, giving investors access to the same assets without having to convert to USD or expose them to U.S. estate taxes.6 The ETF is also available hedged to the Canadian dollar for investors who wish to strip out the forex risk.
BMO Long Federal Bond Index ETF (Ticker: ZFL)4
| BMO Long-Term US Treasury Bond Index ETF (Ticker: ZTL)4
|
But if you’re not ready to take the plunge into a pure play, long-duration government bond exchange-traded fund, you may want to consider aggregate exposure as a trade-off.
The BMO Aggregate Bond Index ETF (ticker: ZAG) is the largest fixed-income ETF in Canada with $6.3 billion in assets under management,7 providing access to corporate (26.22%of the portfolio), provincial (34.4% of the portfolio) and federal bonds (37.34%) with an average duration of 7.39 years.8 The BMO US Aggregate Bond Index ETF (ticker: ZUAG) provides access to the more diversified U.S. bond market with a slightly shorter duration of 6.32 years.9 The ETF is also available unhedged to USD and in USD) (Tickers: ZUAG.F, ZUAG.U). Both products carry a very low management fee of 0.08% (estimated management expense ratio 0.09%).10
The ETF advantage
In general, using bond ETFs for your fixed income allocations, whether executing a barbell strategy or not, can provide elegant and cost-effective solutions to meet a client’s investment objectives. ETFs’ more tactical capabilities compared to individual bond trading is one significant advantage. You can cleanly target a desired duration and credit exposure with a low-cost, liquid product.
Spreads are another crucial consideration. There are much tighter spreads on ETFs versus individual bonds bought either as a block trade by an investment advisor or by an institutional investor (see table below). Asset managers also reap the advantage of institutional pricing thanks to BMO GAM’s scale as the largest bond ETF provider in Canada.5
Fixed income spread considerations
- Much tighter spreads on ETFs vs. individual bonds bought via retail advisory desk
- Take advantage of institutional pricing, thanks to our scale as the largest bond ETF provider in Canada5
| ETF | RETAIL Bid/Ask Spread of Underlying Bonds | INSTITUTIONAL Bid/Ask Spread of Underlying Bonds | ETF Spread |
| ZAG - BMO Aggregate Bond Index ETF | 1.00% | 0.30% | 0.07% |
| ZDB - BMO Discount Bond Index ETF | 1.00% | 0.25% | 0.06% |
| ZFS - BMO Short Federal Bond Index ETF | 0.75% | 0.03% | 0.07% |
| ZFM - BMO Mid Federal Bond Index ETF | 1.00% | 0.08% | 0.07% |
| ZFL - BMO Long Federal Bond Index ETF | 1.25% | 0.24% | 0.14% |
| ZPS - BMO Short Provincial Bond Index ETF | 1.00% | 0.04% | 0.07% |
| ZMP - BMO Mid Provincial Bond Index ETF | 1.10% | 0.08% | 0.07% |
| ZPL - BMO Long Provincial Bond Index ETF | 1.50% | 0.18% | 0.15% |
| ZST - BMO Ultra Short-Term Bond ETF | 0.75% | 0.02% | 0.02% |
| ZCS - BMO Short Corporate Bond Index ETF | 1.00% | 0.13% | 0.08% |
| ZCM - BMO Mid Corporate Bond Index ETF | 1.25% | 0.30% | 0.20% |
| ZLC - BMO Long Corporate Bond Index ETF | 2.00% | 0.62% | 0.20% |
Source: FTSE Russell Index (FTSE), BMO Global Asset Management as of March 16, 2023.
Please contact your BMO ETF Specialist for more information. Our Portfolio Managers are also available to help with trading insights. They can also be reached at 1−877−741−7263.
1 BMO Global Asset Management, as of March 24, 2023. Yield to Maturity (YTM) is the discount rate that equates the present value of a bond’s cash flows with its market price (including accrued interest). The measure does not include fees and expenses.
2 BMO Global Asset Management, as of March 24, 2023. Yield to Maturity (YTM) is the discount rate that equates the present value of a bond’s cash flows with its market price (including accrued interest). The measure does not include fees and expenses. Annualized Distribution Yield: The most recent regular distribution, or expected distribution, (excluding additional year end distributions) annualized for frequency, divided by current NAV. ZMMK annualized distribution yield: 5.05% and YTM: 4.8%; ZST annualized distribution yield 4.68% and YTM: 5.08%.
3 BMO Global Asset Management, as of March 24, 2023. Yield to Maturity (YTM) is the discount rate that equates the present value of a bond’s cash flows with its market price (including accrued interest). The measure does not include fees and expenses. Annualized Distribution Yield: The most recent regular distribution, or expected distribution, (excluding additional year end distributions) annualized for frequency, divided by current NAV. ZUS.U annualized distribution yield: 5.37% and YTM: 4.99%.
4 BMO Global Asset Management, as of March 24, 2023. Yield to Maturity (YTM) is the discount rate that equates the present value of a bond’s cash flows with its market price (including accrued interest). The measure does not include fees and expenses. Annualized Distribution Yield: The most recent regular distribution, or expected distribution, (excluding additional year end distributions) annualized for frequency, divided by current NAV. Duration: A measure of sensitivity of bond prices to changes in interest rates. For example, a 5-year duration means the bond will decrease in value by 5% if interest rates rise 1% and increase in value by 5% if interest rates fall 1%. Generally, the higher the duration the more volatile the bond’s price will be when interest rates change.
5 National Bank of Canada Financial Markets Research, April 4, 2023.[BM1]
6 BMO Global Asset Management, “Tax Issues, U.S. Investing, and Your Clients,” March 2021.
7 Morningstar Direct, as of March 24, 2023.
8 BMO Global Asset Management, as of March 24, 2023. Duration: A measure of sensitivity of bond prices to changes in interest rates. For example, a 5-year duration means the bond will decrease in value by 5% if interest rates rise 1% and increase in value by 5% if interest rates fall 1%. Generally, the higher the duration the more volatile the bond’s price will be when interest rates change.
9 BMO Global Asset Management, as of March 24, 2023. Duration: A measure of sensitivity of bond prices to changes in interest rates. For example, a 5-year duration means the bond will decrease in value by 5% if interest rates rise 1% and increase in value by 5% if interest rates fall 1%. Generally, the higher the duration the more volatile the bond’s price will be when interest rates change.
10 BMO Global Asset Management, as of March 24, 2023. Management Fee: The annual fee payable by the fund and/or any underlying ETF(s) to BMO Asset Management Inc and/or its affiliates for acting as trustee and/or manager of the fund/ETF(s). Management Expense Ratio is an estimate, since the fund is less than one year old and has not gone through an audited financial reporting period.
Disclosures:
Any statement that necessarily depends on future events may be a forward-looking statement. Forward-looking statements are not guarantees of performance. They involve risks, uncertainties and assumptions. Although such statements are based on assumptions that are believed to be reasonable, there can be no assurance that actual results will not differ materially from expectations. Investors are cautioned not to rely unduly on any forward-looking statements. In connection with any forward-looking statements, investors should carefully consider the areas of risk described in the most recent simplified prospectus.
The viewpoints expressed by the authors represents their assessment of the markets at the time of publication. Those views are subject to change without notice at any time without any kind of notice. The information provided herein does not constitute a solicitation of an offer to buy, or an offer to sell securities nor should the information be relied upon as investment advice. Past performance is no guarantee of future results. The statistics in this update are based on information believed to be reliable but not guaranteed.
This article is for information purposes. The information contained herein is not, and should not be construed as, investment, tax or legal advice to any party. Investments should be evaluated relative to the individual’s investment objectives and professional advice should be obtained with respect to any circumstance.
The payment of distributions is not guaranteed and may fluctuate. The payment of distributions should not be confused with an Exchange Traded Fund’s performance, rate of return or yield. If distributions paid by the Exchange Traded Fund are greater than the performance of the Exchange Traded Fund, your original investment will shrink. Distributions paid as a result of capital gains realized by an Exchange Traded Fund, and income and dividends earned by an Exchange Traded Fund are taxable in your hands in the year they are paid. Your adjusted cost base will be reduced by the amount of any returns of capital. If your adjusted cost base goes below zero, you will have to pay capital gains tax on the amount below zero. Please refer to the Exchange Traded Funds, distribution policy in the prospectus.
Commissions, management fees and expenses all may be associated with investments in BMO ETFs and ETF Series of the BMO Mutual Funds. Please read the ETF facts or prospectus of the relevant BMO ETF or ETF Series before investing. The indicated rates of return are the historical compounded total returns including changes in share or unit value and the reinvestment of all dividends or distributions and do not take into account the sales, redemption, distribution, optional charges or income tax payable by the unitholder that would have reduced returns BMO ETFs and ETF Series are not guaranteed, their values change frequently and past performance may not be repeated.
For a summary of the risks of an investment in the BMO ETFs or ETF Series of the BMO Mutual Funds, please see the specific risks set out in the prospectus. BMO ETFs and ETF Series trade like stocks, fluctuate in market value and may trade at a discount to their net asset value, which may increase the risk of loss. Distributions are not guaranteed and are subject to change and/or elimination.
BMO ETFs are managed by BMO Asset Management Inc., which is an investment fund manager and a portfolio manager, and a separate legal entity from Bank of Montreal. ETF Series of the BMO Mutual Funds are managed by BMO Investments Inc., which is an investment fund manager and a separate legal entity from Bank of Montreal.
BMO Global Asset Management is a brand name under which BMO Asset Management Inc. and BMO Investments Inc. operate.
®/™Registered trademarks/trademark of Bank of Montreal, used under licence.