Low Volatility: Long-Term Core Exposure
With volatility a defining characteristic for markets through 2022 — and with perhaps more to come in 2023 — Laura Tase, Director, Institutional & Advisory, BMO ETFs, examines how low volatility strategies rather than being a seasonal factor, can be used as a long-term core exposure.


Most investors understand return is related to risk. All else being equal, riskier stocks should deliver higher returns. The inverse is that less risky investments are generally considered defensive, with a correlation to more modest gains.
Yet lower volatility (or “low vol”) investing directly challenges that conventional thinking.
There’s a strong argument that low-vol investing is one of the most overlooked opportunities to earn excess returns that has ever been identified. Low-volatility stocks have actually outperformed over the past 90 years1, while studies have shown that this trend holds true across global markets. Low-vol should be a long-term core exposure for investors, either on its own or a combination of low-vol and broad beta investing strategies.
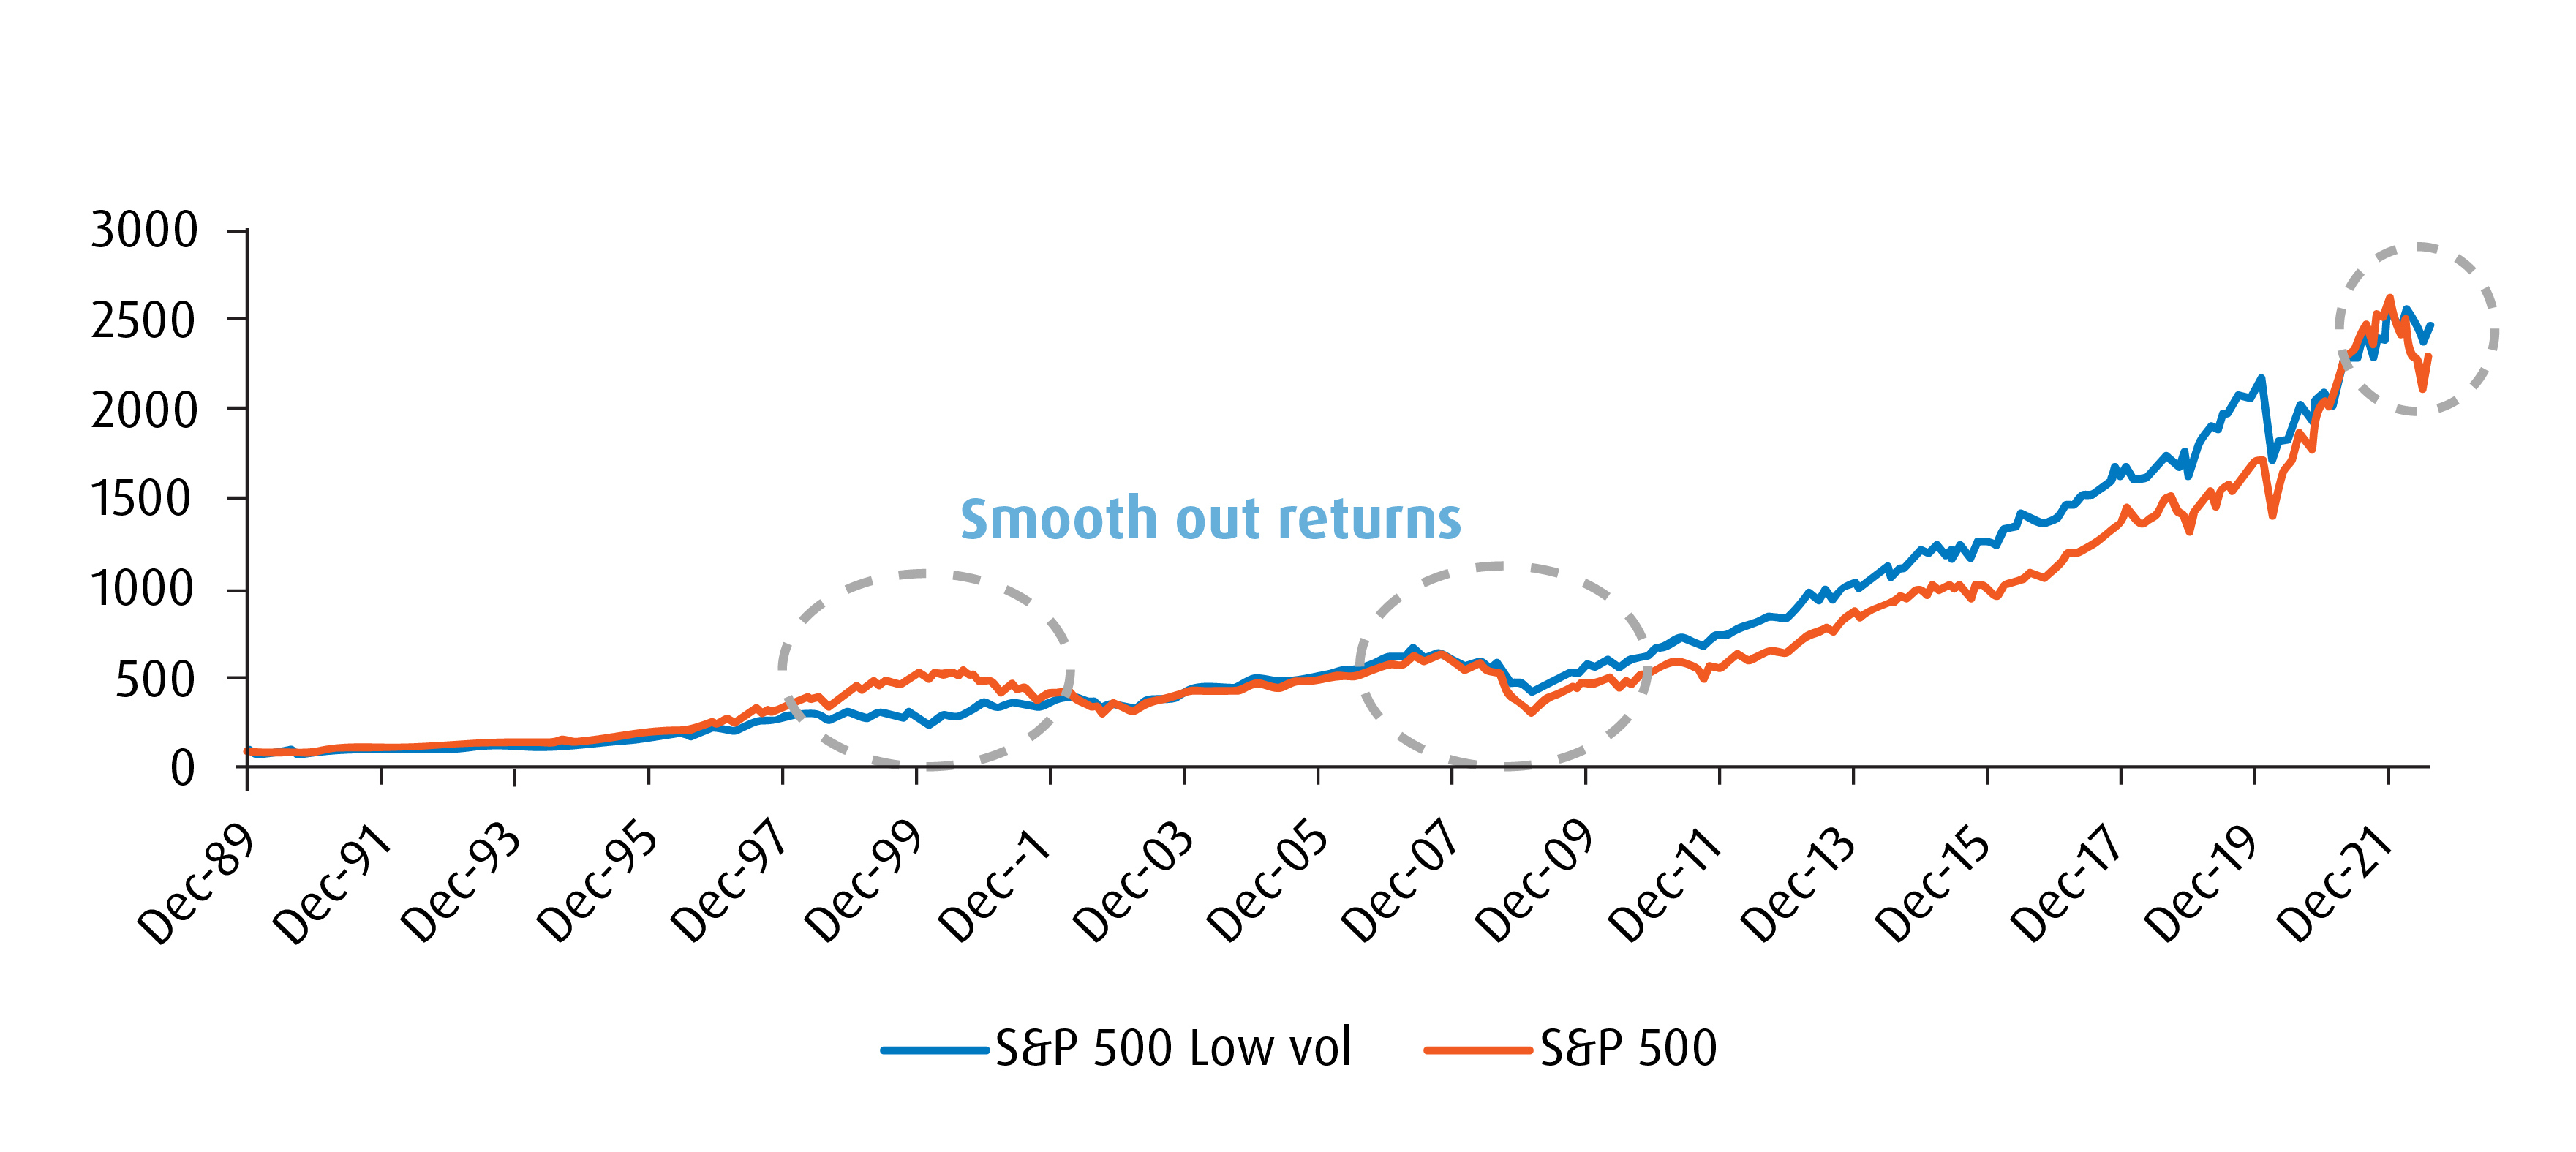
Low volatility investing is not a new concept – it has been around since 1972 through the work of famed Wall Street economist Fischer Black. But it has captured more interest since the Great Financial Crisis (GFC) in 2008-09. As broader indices like the S&P 500 fell sharply, less volatile stocks within the index better preserved their valuations — a trend that has remained largely intact since the GFC.
Winning by not losing
It’s important to always consider the underlying methodology – some strategies use standard deviation; however, standard deviation measures the volatility of the stock against itself over time. Beta on the other hand measures the volatility against the market.
In general, the broad market is assigned a beta value of 1.00, while an investment with a beta less than 1.00 indicates that it’s less risky, relative to the broad market. Beta is the primary investment selection and weighting criteria for the BMO ETF Low Volatility Strategy. By constructing ETFs with lower beta securities, the strategy gives investors access to portfolios designed to provide growth while reducing risk.
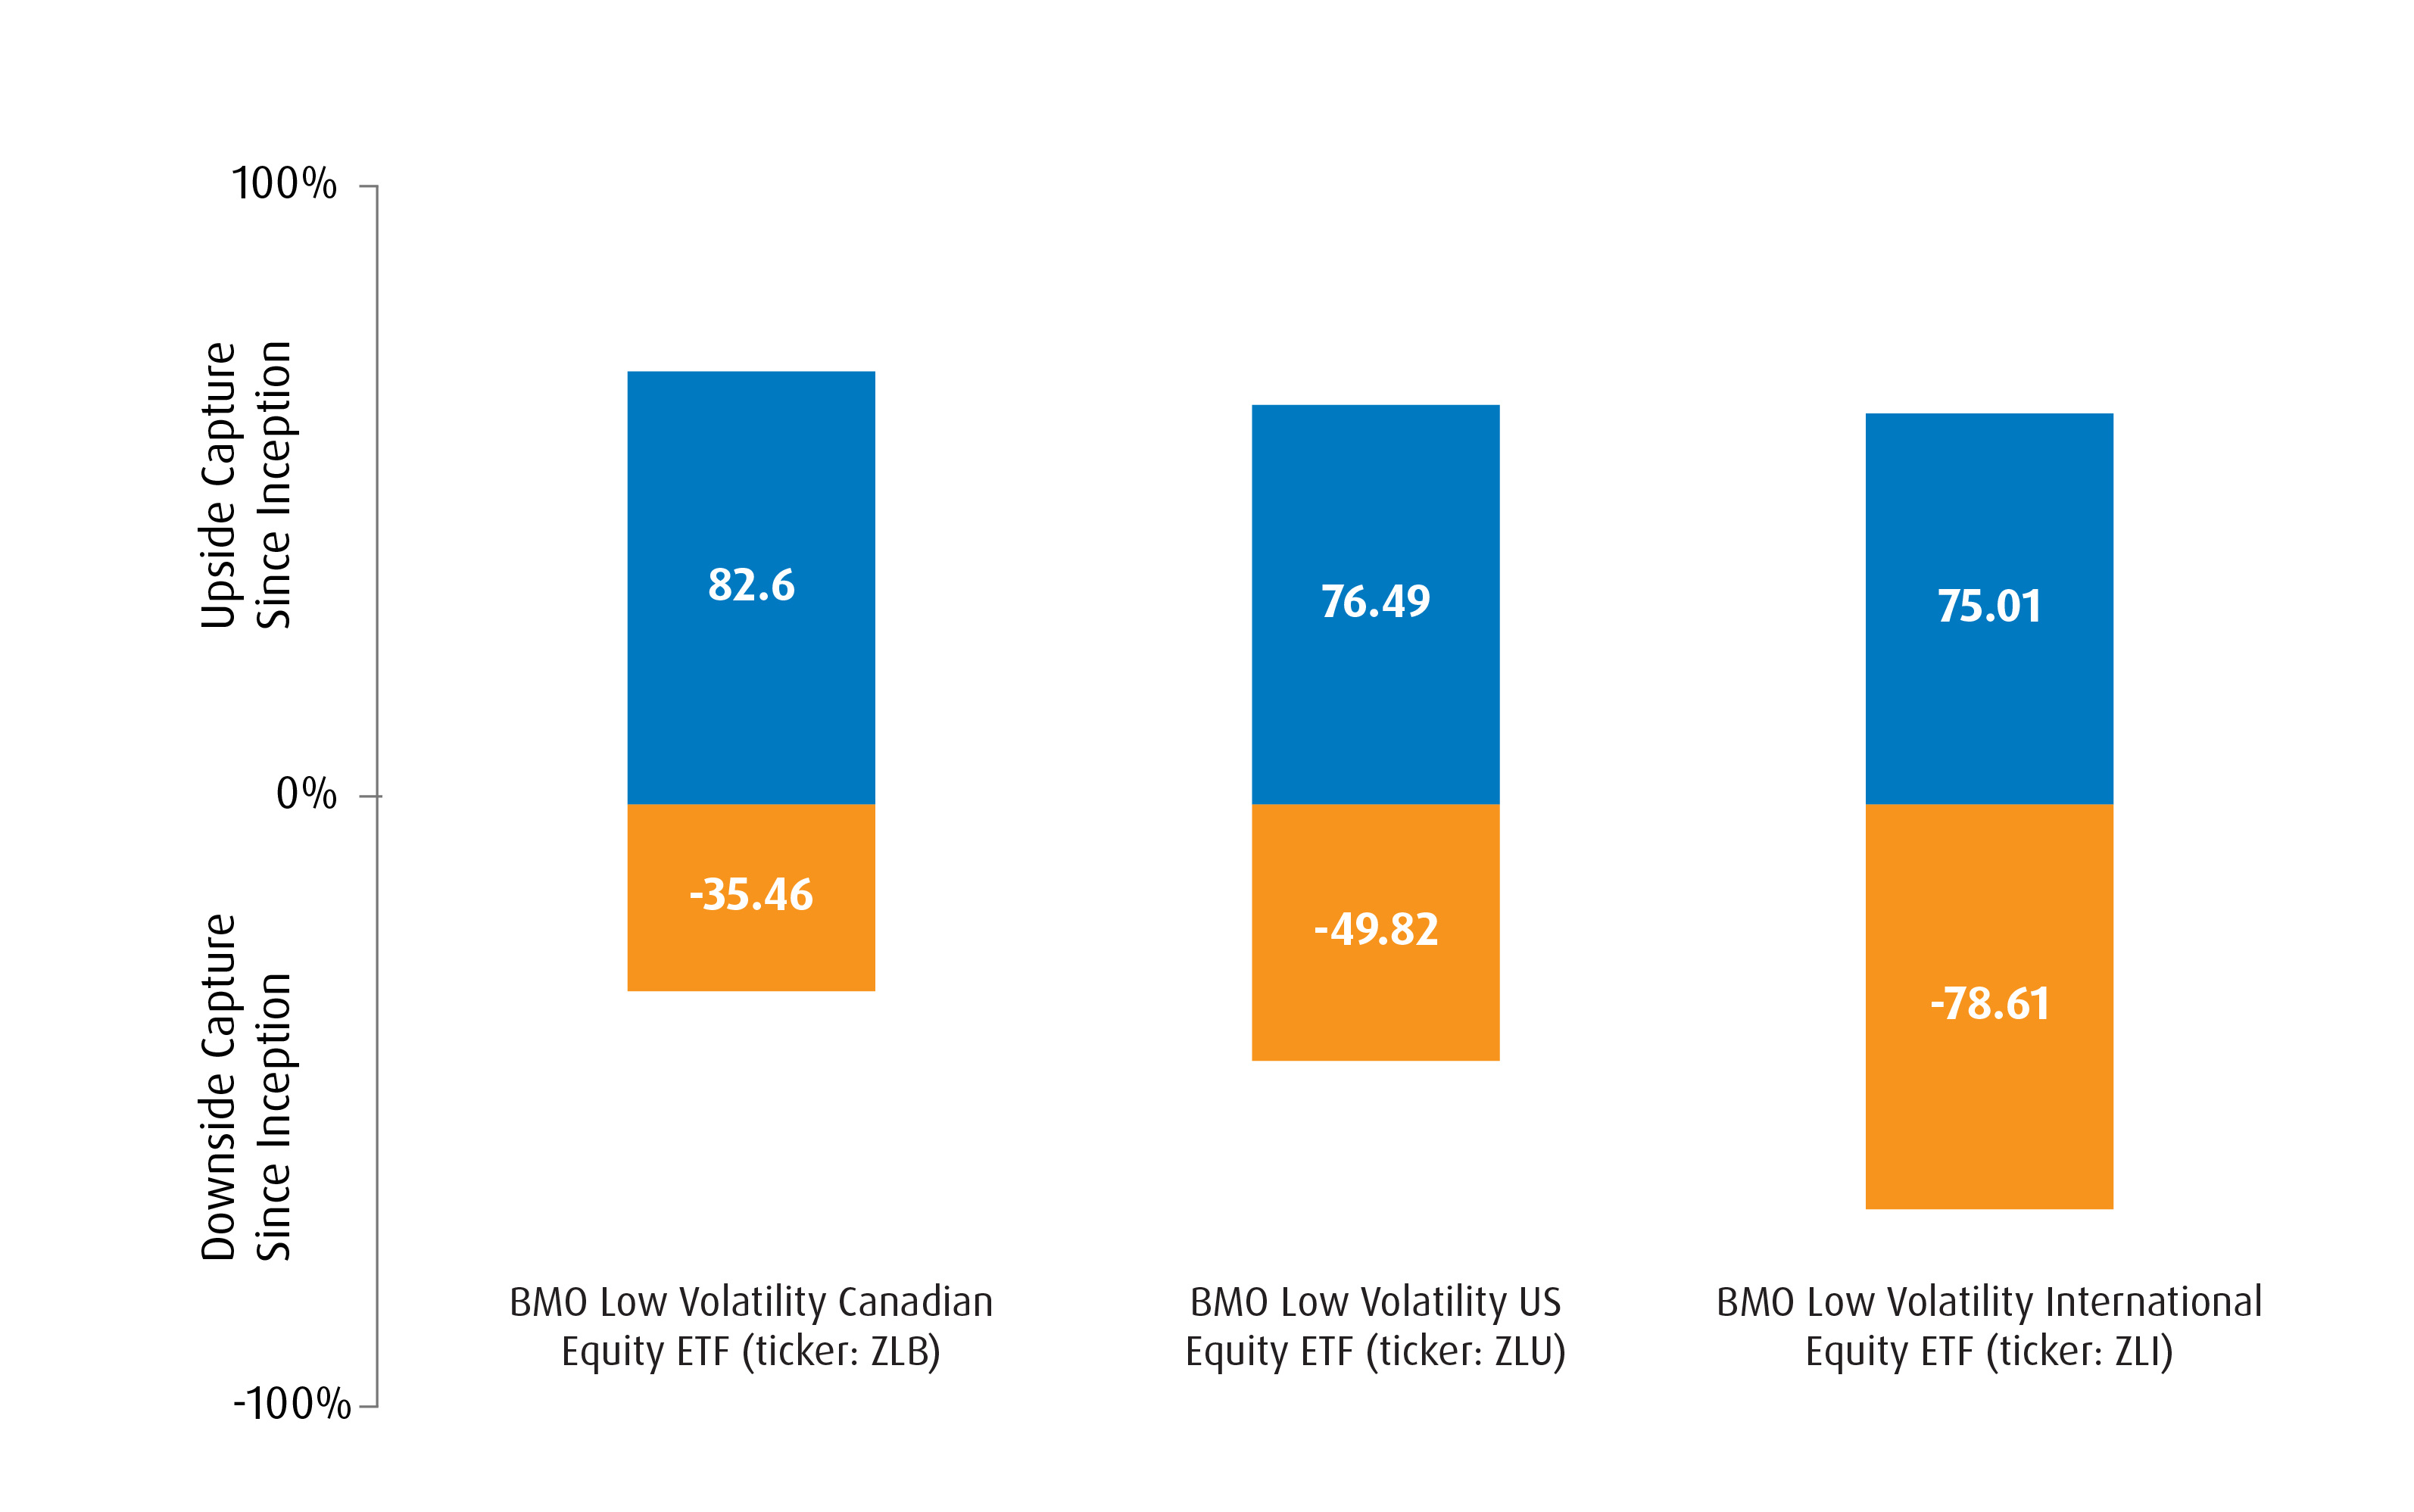
Over the long term, low-beta stocks have benefitted from smaller declines during corrections while still increasing during advancing markets. Low-beta stocks also tend to be more mature and provide higher dividend yields.
Example of BMO low volatility ETFs upside / downside capture ratios since inception
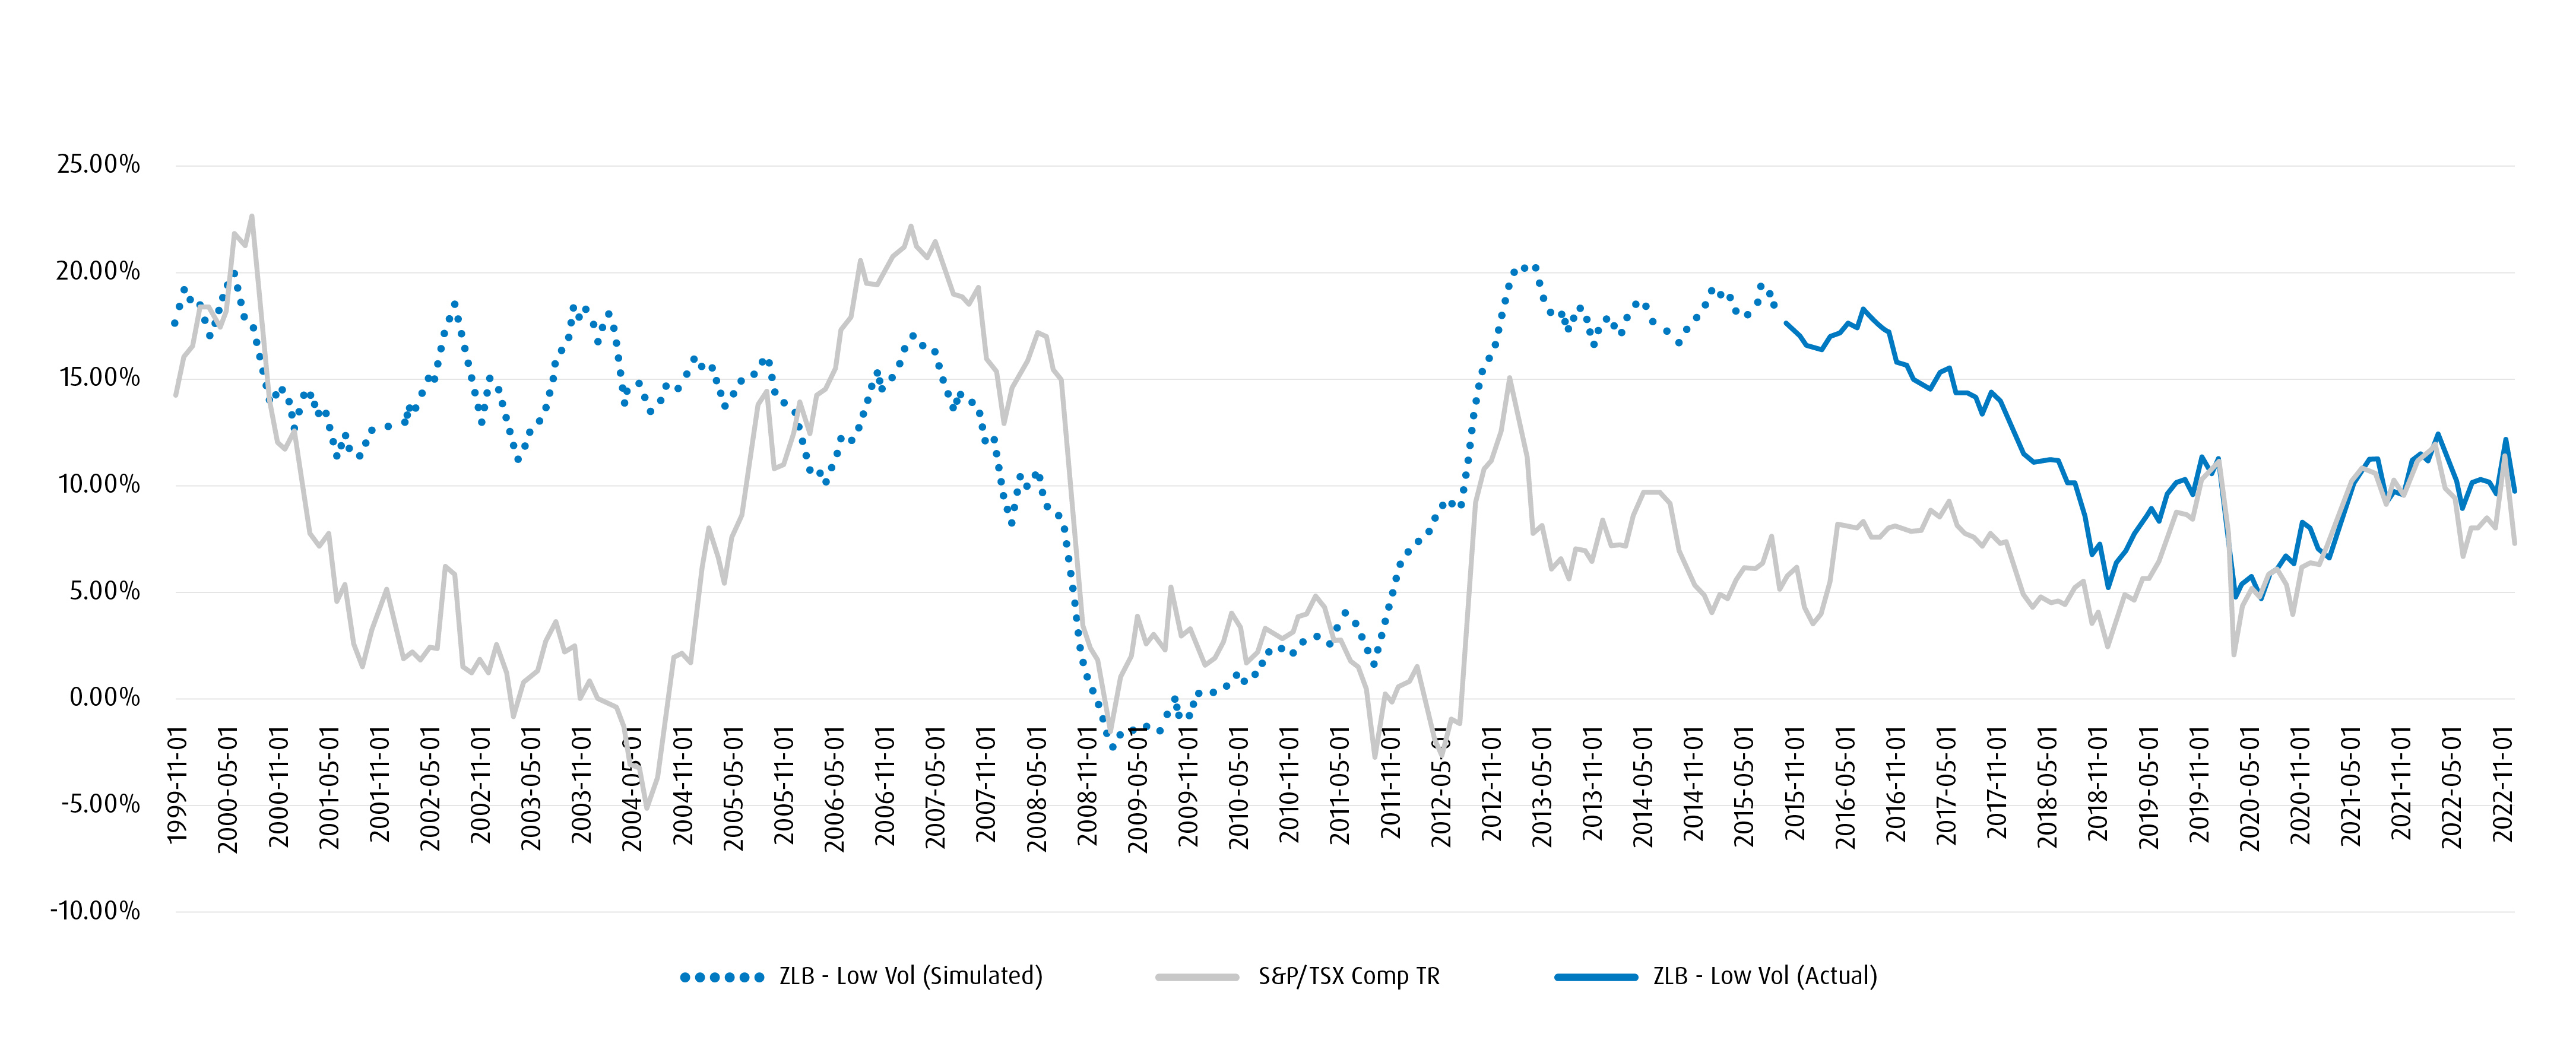
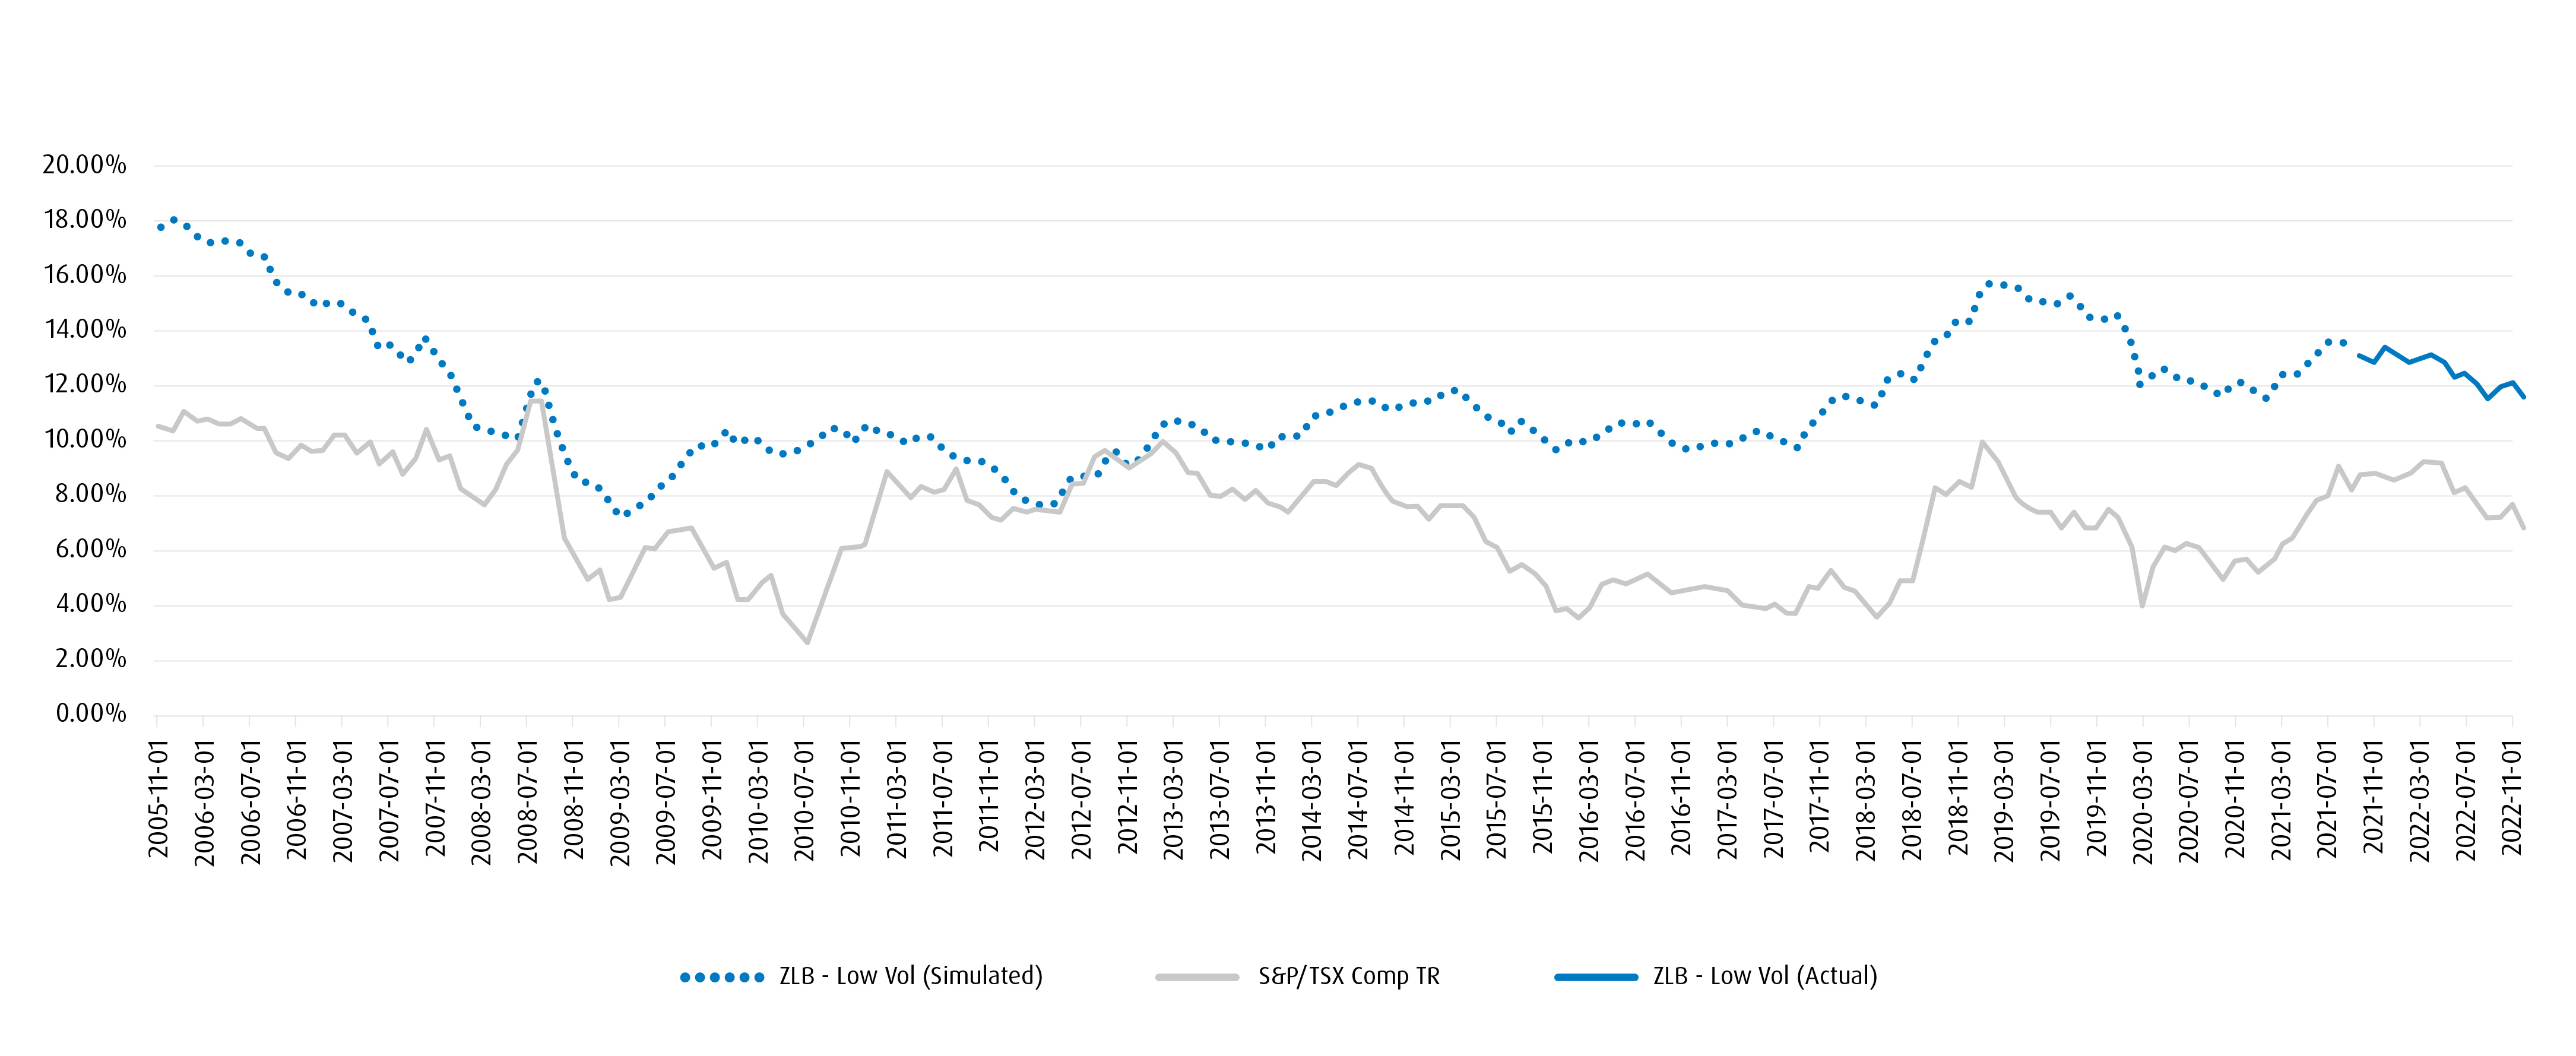
4-year and 10-year rolling averages
The charts below show the four and 10-year rolling average returns for the BMO Low Volatility Canadian Equity ETF (ZLB) and BMO Low Volatility US Equity ETF (ZLU), respectively. Low-volatility is a consistent Factor, which has a “out-of-favour” period at points in the economic cycle, but these are relatively short-lived.
ZLB – BMO Low Volatility Canadian Equity ETF calendar year performance
| Calendar Performance | 2022 | 2021 | 2020 | 2019 | 2018 | 2017 | 2016 | 2015 | 2014 | 2013 | 2012 |
| NAV | -0.37% | 22.88% | 1.64% | 21.82% | -2.83% | 11.08% | 13.04% | 2.67% | 28.54% | 20.71% | 13.94% |
Source: Bloomberg, BMO Global Asset Management, from 2012 to 2022. Past performance is not a guide to future performance. Performance is shown net of fees, in the currency of the respective share class with dividends reinvested.
ZLU – BMO Low Volatility US Equity ETF calendar year performance
| Calendar Performance | 2022 | 2021 | 2020 | 2019 | 2018 | 2017 | 2016 | 2015 | 2014 | 2013 | 2012 |
| NAV | 7.98% | 20.65% | 2.19% | 20.32% | 8.46% | 5.07% | 5.74% | 26.59% | 34.98% | 18.17% | 7.98% |
Source: Bloomberg, BMO Global Asset Management, from 2012 to 2022. Past performance is not a guide to future performance. Performance is shown net of fees, in the currency of the respective share class with dividends reinvested.
Smoothing out the returns through a four-year lens really puts the BMO ETF Low Volatility Strategy into proper perspective. The only soft period for ZLB, for instance, was during the great commodity surge after the GFC.
HYPOTHETICAL PERFORMANCE AND FOR ILLUSTRATIVE PURPOSES ONLY
ZLB –4- and 10-year rolling returns
4-year rolling returns
10-year rolling returns
ZLU –4- and 10-year rolling returns
4-year rolling returns
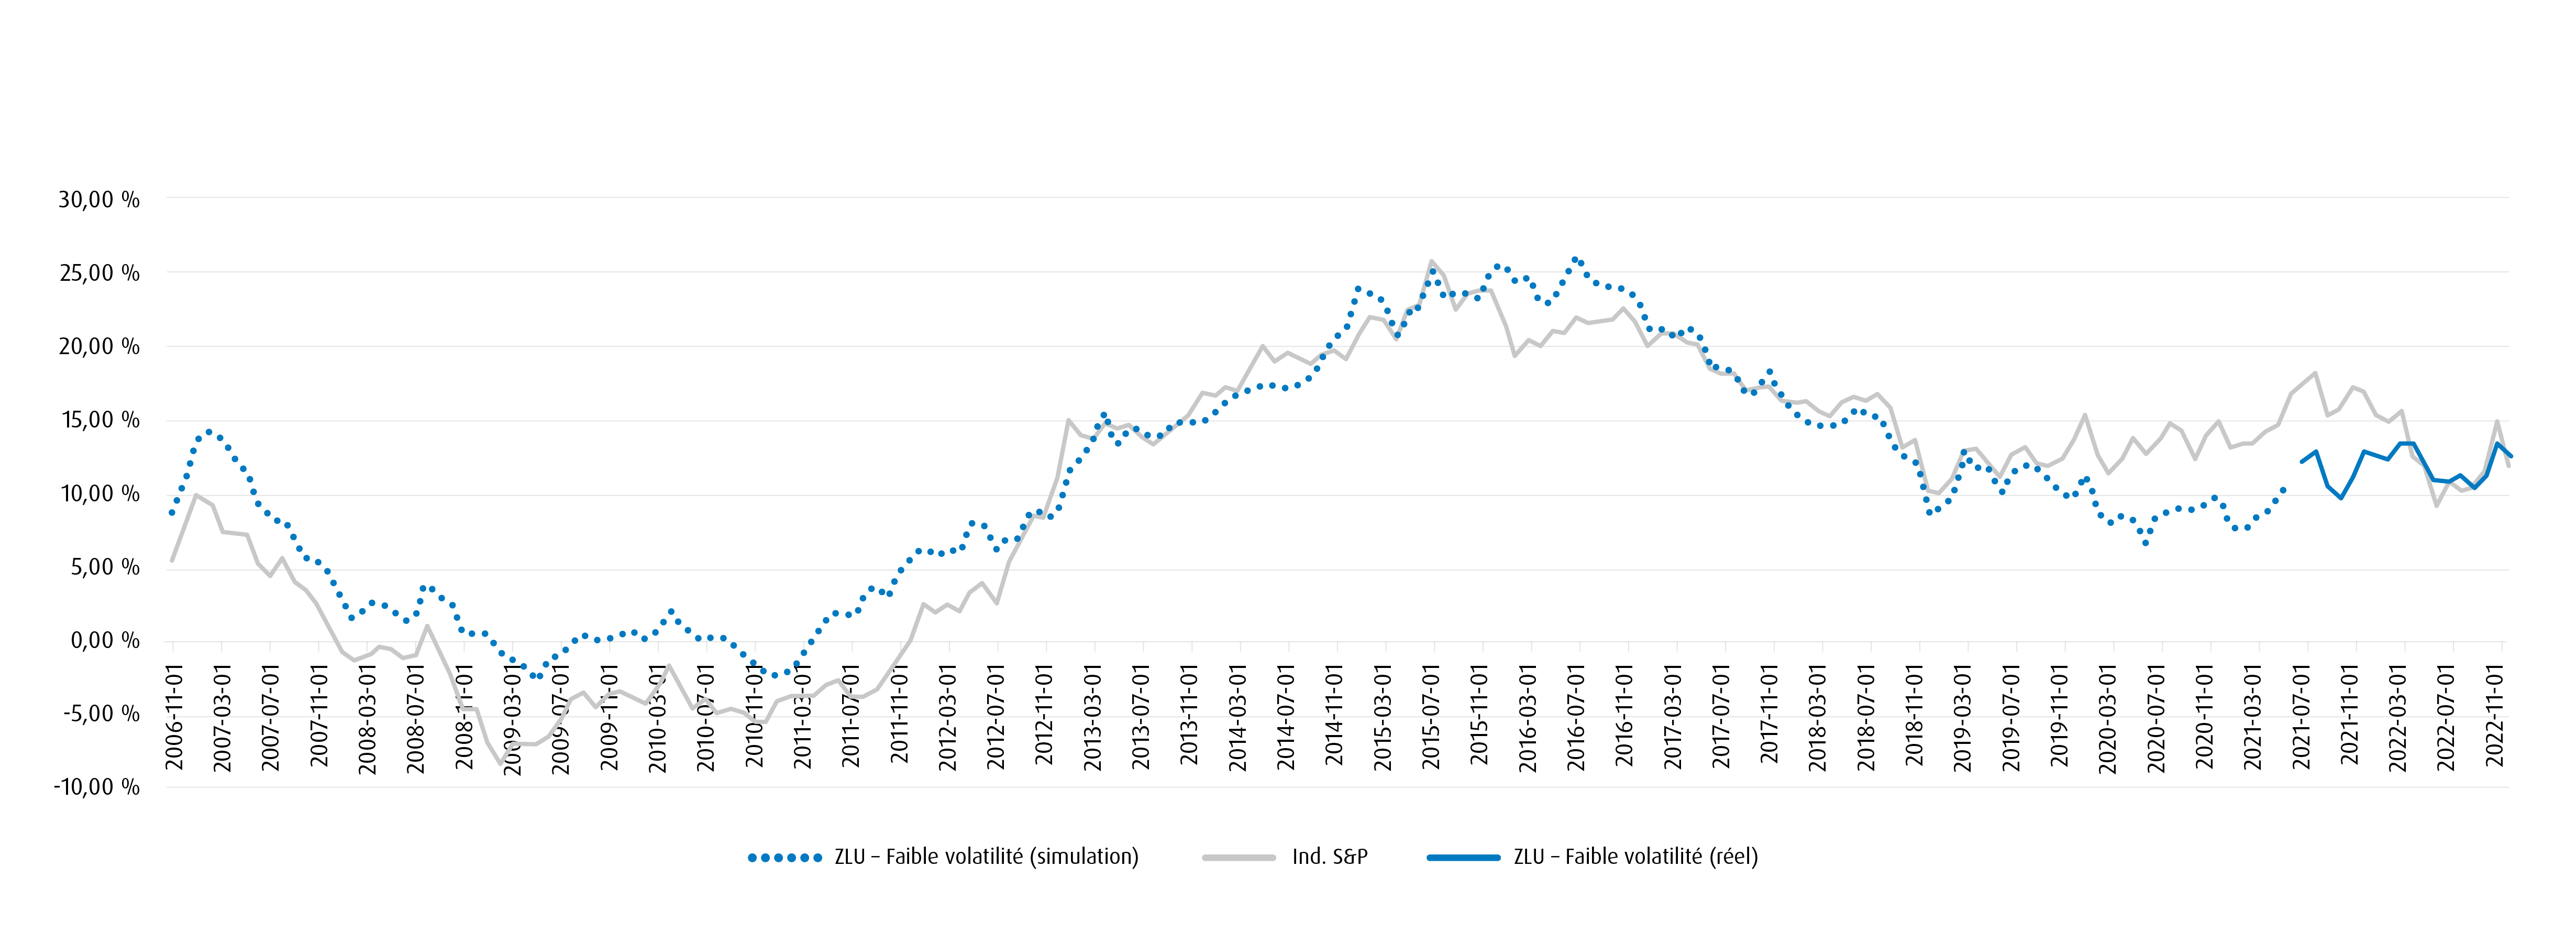
10-year rolling returns

Performance is calculated in Canadian dollars. Unlike an actual performance record, simulated results do not represent actual performance and are generally prepared with the benefit of hindsight. In addition, hypothetical trading does not involve financial risk. There are frequently differences between simulated performance results and the actual results subsequently achieved by any particular fund. In addition, since trades have not actually been executed, simulated results cannot account for the impact of certain market risks such as lack of liquidity. There are numerous other factors related to the markets in general or the implementation of any specific investment strategy, which cannot be fully accounted for the in the preparation of simulated results and all of which can adversely affect actual results. No representation is being made that any person will or is likely to realize profits or losses similar to those presented above.
Strong returns, reduced risk
As the charts illustrate, the BMO ETF Low Volatility Strategy can produce strong returns while reducing volatility by selecting and weighting to lower beta investments. The strategy allows investors to target a specific risk tolerance to help mitigate market uncertainties like the kind witnessed in 2022.
ZLB – Annualized performance
| Annualized Performance | 1Y | 2Y | 3Y | 5Y | 10Y | Since Inception |
| NAV | -0.37% | 10.64% | 7.56% | 8.05% | 11.41% | 11.80% |
Source: Bloomberg, BMO Global Asset Management, as of December 31, 2022. Past performance is not a guide to future performance. Performance is shown net of fees, in the currency of the respective share class with dividends reinvested.
ZLU – Annualized performance
| Annualized Performance | 1Y | 2Y | 3Y | 5Y | Since Inception
(March 19, 2013) |
| NAV | 7.98% | 14.14% | 10.01% | 11.68% | 14.91% |
Source: Bloomberg, BMO Global Asset Management, as of December 31, 2022. Past performance is not a guide to future performance. Performance is shown net of fees, in the currency of the respective share class with dividends reinvested.
These ETFs can be used as a core portfolio position or to complement existing broad market portfolios. BMO Low Volatility ETFs can be used as a tactical trading vehicle in periods of greater market uncertainty, where a more defensive portfolio may be appropriate.
Please contact your BMO ETF Specialist for more information. Our Portfolio Managers are also available to help with trading insights. They can also be reached at 1−877−741−7263.
1 Haugen and Heins (H&H) Study from 1926 to 1971, 1972.
Disclosures:
Any statement that necessarily depends on future events may be a forward-looking statement. Forward-looking statements are not guarantees of performance. They involve risks, uncertainties and assumptions. Although such statements are based on assumptions that are believed to be reasonable, there can be no assurance that actual results will not differ materially from expectations. Investors are cautioned not to rely unduly on any forward-looking statements. In connection with any forward-looking statements, investors should carefully consider the areas of risk described in the most recent simplified prospectus.
The viewpoints expressed by the authors represents their assessment of the markets at the time of publication. Those views are subject to change without notice at any time without any kind of notice. The information provided herein does not constitute a solicitation of an offer to buy, or an offer to sell securities nor should the information be relied upon as investment advice. Past performance is no guarantee of future results. The statistics in this update are based on information believed to be reliable but not guaranteed.
This article is for information purposes. The information contained herein is not, and should not be construed as, investment, tax or legal advice to any party. Investments should be evaluated relative to the individual’s investment objectives and professional advice should be obtained with respect to any circumstance.
Commissions, management fees and expenses all may be associated with investments in exchange traded funds. Please read the ETF Facts or prospectus before investing. The indicated rates of return are the historical annual compounded total returns including changes in unit value and reinvestment of all dividends or distributions and do not take into account sales, redemption, distribution or optional charges or income taxes payable by any unitholder that would have reduced returns. Exchange traded funds are not guaranteed, their values change frequently and past performance may not be repeated.
For a summary of the risks of an investment in the BMO ETFs, please see the specific risks set out in the prospectus. BMO ETFs trade like stocks, fluctuate in market value and may trade at a discount to their net asset value, which may increase the risk of loss. Distributions are not guaranteed and are subject to change and/or elimination.
BMO ETFs are managed by BMO Asset Management Inc., which is an investment fund manager and a portfolio manager, and a separate legal entity from Bank of Montreal.
BMO Global Asset Management is a brand name under which BMO Asset Management Inc. and BMO Investments Inc. operate.
®/™Registered trademarks/trademark of Bank of Montreal, used under licence.