Rationalizing Fixed Income Holdings & Understanding Payback
Mar. 15, 2023The Canadian bond market has just gone through one of the roughest calendar years on record with data going back to 1980, for 2022 BMO Aggregate Bond Index ETF (ZAG) returned -11.79%.
During the past calendar year Fixed Income prices fell largely due to high levels of inflation, this caused central banks to raise overnight interest rates aggressively and as a result shifted the interest rate curve higher across the maturity spectrum as markets adjusted. There is a hidden benefit though, as interest rates have increased, the yield to maturity on bond portfolios has also increased, which both shortens the recovery period on losses and provides potentially higher yields going forward.
For portfolio construction, BMO US TIPS Index ETF (TIPS, TIPS.F, TIPS.U) and BMO Short-Term US TIPS Index ETF (ZTIP, ZTIP.F, ZTIP.U) for inflation linked bond exposure, and BMO Canadian Bank Income Index ETF (ZBI) for bank debt and non-traditional bank financing, are proving to be effective portfolio satellites, alongside increasing credit exposure, and shortening duration.
To illustrate the affects of rates rising and the affect on recovery times, consider two recognized BMO ETFs as examples, BMO Aggregate Bond Index ETF (ZAG) and BMO Short Corporate Bond Index ETF (ZCS).
In each scenario below an increase of 50 and 100 basis points are used to show how bond prices and yield to maturities are affected. It also shows us what the hypothetical payback period is in terms of years for a holder to recover their losses. Recovery time is calculated by dividing the price decline percentage with the new yield to maturity percentage.
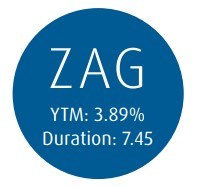 | SCENARIO 1 50 basis point move higher (Rate movement: 0.5%) | SCENARIO 2 100 basis point move higher (Rate movement: 1.0%) |
| Impact to Bond Prices Bond Price Movement | -3.7% | -7.5% |
| New Yield to Maturity Yield Movement | 4.39% | 4.89% |
| Payback Period Recovery Time (Years) | 0.85 | 1.52 |
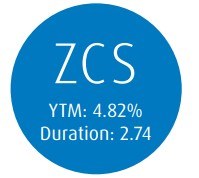 | SCENARIO 1 50 basis point move higher (Rate movement: 0.5%) | SCENARIO 2 100 basis point move higher (Rate movement: 1.0%) |
| Impact to Bond Prices Bond Price Movement | -1.4% | -2.7% |
| New Yield to Maturity Yield Movement | 5.32% | 5.82% |
| Payback Period Recovery Time (Years) | 0.26 | 0.47 |
Note: For illustrative purposes table figures and calculations assume a parallel yield curve shift and no change to credit spreads, YTM, performance data and duration is as of February 1st 2023, recovery time is calculated by dividing impact to bond price with new yield to maturity.
To emphasize the go forward benefit of rising yields, using the same ETFs and the 100-basis point scenario, the recovery period decreases significantly. For ZAG, the recovery period decreases from 1.52 years to 1.38 years (9.2% shorter) based on the new yield to maturity of 4.89%. For ZCS, the recovery period decreases from 0.47 years to 0.43 years (8.5% shorter) based on the new yield to maturity of 5.32%. The short term pain of rising yields across the yields is then partially offset by the long term benefits of shorter recovery times and most importantly, higher fixed income yields in the portfolio going forward. Higher yields also create a better buffer to further market volatility looking ahead and better stability in the bond market. Based on the scenarios presented, the investor will be earning an additional 100 basis points per year post the breakeven points.
For Advisor Use with Client.
This article is for information purposes. The information contained herein is not, and should not be construed as, investment, tax or legal advice to any party. Particular investments and/or trading strategies should be evaluated relative to the individual’s investment objectives and professional advice should be obtained with respect to any circumstance.
Commissions, management fees and expenses all may be associated with investments in exchange traded funds. Please read the ETF Facts or prospectus of the BMO ETFs before investing. The indicated rates of return are the historical annual compounded total returns including changes in unit value and reinvestment of all dividends or distributions and do not take into account sales, redemption, distribution or optional charges or income taxes payable by any unitholder that would have reduced returns. Exchange traded funds are not guaranteed, their values change frequently, and past performance may not be repeated.
For a summary of the risks of an investment in the BMO ETFs, please see the specific risks set out in the BMO ETF’s prospectus. BMO ETFs trade like stocks, fluctuate in market value and may trade at a discount to their net asset value, which may increase the risk of loss. Distributions are not guaranteed and are subject to change and/or elimination.
BMO ETFs are managed by BMO Asset Management Inc., which is an investment fund manager and a portfolio manager, and a separate legal entity from Bank of Montreal. BMO Global Asset Management is a brand name that comprises BMO Asset Management Inc. and BMO Investments Inc.
®/™Registered trade-marks/trade-mark of Bank of Montreal, used under licence