BMO ARK Innovation Fund ETF Series - ARKK
Q1 2024 Quarterly Commentary
May 28, 2024Broad-based global equity indexes1 appreciated in the first quarter, despite a drop in the number of U.S. Federal Reserve (Fed) rate cuts expected in 2024. Importantly, the Fed began to communicate that employment gains would not derail the decline in interest rates and that inflation is the much more important policy gauge. While the consensus forecast is for a soft landing, ARK still expects that a loss of pricing power will force corporations into employment cutbacks and a harder-than-expected landing. Indeed, the US economy seems to have been in a rolling recession, depressing sectors like housing, autos, and commercial real estate while inventories continue to build. In response, the potential growth in ARK’s Five Innovation Platforms2 could play an outsized role in pulling the economy out of recession, salvaging corporate margins as inflation gives way to deflation in many sectors.
Rolling recessions suggest that the Fed should weigh the merits of rate cuts sooner than dot plots suggest. Unfortunately, the Fed still is focused on lagging indicators like wages and headline inflation. Indeed, the Bureau of Labor Statistics (BLS) has revised nonfarm payroll statistics down for eleven of the last thirteen months, suggesting that the labor market is weaker than government reports have suggested. The last time that the BLS revised nonfarm payroll employment statistics down for such an extended period of time was in 2007, months before the onset of the Global Financial Crisis (GFC).
- The auto industry faced significant challenges during the COVID-19 pandemic and, while sales did enter a V-shaped recovery in 2021, current unit sales are annualizing at a 15.5 million3 annual rate, well below the pre-COVID range of 17-18 million units3. In the early days of the pandemic, autos accounted for roughly one third of the inflation spike. Now, used car prices are down 15% year-over-year, down 21% from peak prices.4
- Housing metrics like median prices, housing starts, and affordability also are sending troubling signals. At 4.4 million units, the number of existing home sales is just above levels last seen during the global housing crisis.5 Rents for new tenants are declining roughly -4.6% year-over-year,6 a rate higher than at any point during the financial crisis in 2008-2009. At the same time, a record number of apartment units are under construction, suggesting that rent deflation will push inflation into much lower-than-expected territory over time.
- Real Gross Domestic Income (GDI) — which should equal real GDP over time — suggests that the economy is meaningfully weaker than Real Gross Domestic Product (GDP). The near-record wide difference is ~$450 billion.7 Many global bellwethers are corroborating this weakness, several reporting year-over-year revenue declines during the fourth quarter: 3M (-1.8%), UPS (-7.8%), Kraft-Heinz (-7.1%), Exxon Mobil (-12.3%), Thermo Fisher (-4.9%), Home Depot (-2.9%), Cisco (-5.9%), Texas Instruments (-12.7%). In other words, Europe, the UK, Japan, and China already are in or are bordering on recession.
- After boosting profitability with higher prices during the supply-chain-related bottlenecks in 2021-22, and again as unit growth disappointed in 2023, corporations now seem to be losing pricing power, to the detriment of profit margins. As measured by Bloomberg, the S&P 500’s gross profit margin declined from 34.8% on average during the past five years, and 34.6% during the fourth quarter of 2022, to 33.5% during the fourth quarter of 2023. In our view, this setback will intensify until the Fed cuts interest rates significantly and unless companies harness innovation like artificial intelligence aggressively, not only to drive productivity growth but also to create new products and services that replace legacy solutions. To limit the damage to margins in the interim, companies that hoarded employees during post-COVID labor shortages are likely to lay them off during the next year — and lower the rate of wage gains — further allaying the Fed’s concern about underlying inflation. As a result, nominal consumption could weaken beyond the recent soft spots associated with housing, autos, and other big-ticket purchases, forcing more price cuts and margin compression.
- The US Small Business Optimism Index is in recession territory, worse than the COVID recession and the saving and loans crisis and entering GFC territory.8
- M29 growth is down 1.7% on a year-over-year basis, a rate not seen since the 1930s.10 While sequential declines seemed natural after the COVID-related surge, continued weakness could be pointing to recession. Additionally, because rising mortgage rates have trapped homeowners in their homes, growth in the velocity of money seems to be slowing down and could exacerbate the decline in M2, raising the odds of broad-based price deflation.
- The ratio of the Commodity Research Bureau (CRB) Metals price index to the Gold price index is falling and is close to the lows recorded during the GFC in 2008-2009. Since the GFC and until last year, this ratio has correlated closely with long-term interest rates. If this relationship were to revert to normal, interest rates could collapse, or metals prices could rise significantly, or some combination of both.
While the Fed is focused on squelching inflation with higher interest rates, the bond market has been signaling trouble ahead. From March 2021 to July 2023, the yield curve11inverted from +159 basis points to -108 basis points,12 hitting the steepest levels since the early 1980s when the Fed was fighting double-digit inflation. Since July 2023, the yield curve has entered a bear steepening phase, with long-term rates increasing relative to short-term rates, lowering the inversion to -39 basis points13 and suggesting that both real growth and inflation could surprise on the low side of expectations. The Federal Reserve began increasing interest rates when the year-over-year Consumer Price Index (CPI) — a lagging economic indicator — reached 8.5% on a year-over-year basis in March 2022. Shortly thereafter, an inflationary surge influenced by geopolitical pressures and inventory hoarding peaked at 9.1% year-over-year. Since then, CPI inflation has dropped to 3.2%,14 thanks to various deflationary forces – – good, bad, and cyclical.
The Federal Funds Target Rate surged 24-fold in little more than a year. The deflationary ramifications of current Fed policy already are surfacing through bankruptcies in commercial real estate, both office and multi-family, and could culminate in another round of regional bank failures. If the Fed were to lower interest rates in response, companies sacrificing short-term profitability to invest and potentially capitalize on technologically enabled super exponential growth opportunities should be prime beneficiaries.
The Fed paused its tightening moves last summer. At the same time, in the technology realm, ChatGPT began to dramatize the seemingly miraculous breakthroughs that are likely to tip the scales even further toward broad-based deflation. Although creative destruction — the transition from gas-powered vehicles to electric vehicles, for example — could obfuscate the boom associated with AI and other disruptive technologies evolving today, the waves of growth associated with the convergence among the 14 technologies involved in our five major platforms — robotics, energy storage, AI, blockchain technology, and multiomics sequencing — should start moving the needle on macro metrics increasingly and significantly during the next five to ten years.
In our view, history will show that inflation, initially triggered by supply shocks, was transitory and evolved into disinflation, then ultimately deflation. Consequently, interest rates are likely to surprise on the low side of expectations, broadening last year’s equity rally from a narrow subset of stocks.
Fund Commentary
Among the top contributors to performance were Coinbase Global (COIN) and Robinhood Markets (HOOD). Shares of Coinbase Global rallied alongside continued strength across crypto markets. The price of bitcoin broke through $70,000, setting a new all-time-high in March. Coinbase also received positive news in its legal battle with the SEC as the court dismissed the SEC’s charges against Coinbase Wallet, its self-custody solution — a significant win for Coinbase and decentralized financial services in the US broadly. Shares of Robinhood Markets rallied after the company reported strong fourth-quarter earnings, including revenue growth of 24% year-over-year that beat Wall Street estimates by 3%. The company also reported $4.6B in net deposit inflows for the fourth quarter of 2023, $1.3B of which originated in brokerage account transfers from its competitors. AllianceBernstein initiated coverage on Robinhood with an “Outperform” rating in anticipation of continued strength across cryptocurrencies. Bitcoin broke through $70,000 and set a new all-time-high in March. Additionally, Robinhood unveiled a new credit card that appears competitive with other premium cards in the US, which strengthens our digital wallet thesis.
Among the top detractors from performance were Tesla (TSLA) and Roku (ROKU). Shares of Tesla detracted from performance amid wall street concerns about a slowdown in global electric vehicle (EV) adoption. In January, the company’s full-year earnings highlighted better-than-expected vehicle deliveries of 1.81 million, a 38% year-over-year growth rate, but forecasted a slowdown in volume growth in 2024 as the company prepares to launch its next-gen platform. At the end of the quarter, Elon Musk announced that Tesla is no longer limited by computing power for Artificial Intelligence training and will offer biweekly software updates to its Full-Self Driving (FSD) feature and a one-month free trial to all US-capable cars. Shares of Roku slid after the company announced fourth-quarter earnings and Walmart acquired connected TV competitor, Vizio. Roku’s total revenue grew 11% year-over-year, surpassing expectations, and a large swing into positive cash flow. Total active accounts increased by 10 million, reaching 80 million and surpassing the combined subscriber count of the six largest traditional pay-TV providers. That said, now that Roku is expanding globally to meet consumer demand in lower-monetizing regions, average revenue per user was down by 4% year-over-year. While Walmart’s acquisition of Vizio will decrease shelf space for Roku TVs at the retailer, we believe that Roku is well-diversified in its distribution channel, which includes other large retailers like Amazon, Best Buy, and Costco.
Portfolio Construction*
All weights are subject to change.
Top 10 Holdings |
Weight |
COINBASE GLOBAL INC -CLASS A |
13.45% |
BLOCK INC |
7.46% |
TESLA INC |
7.41% |
ROKU INC |
6.72% |
UIPATH INC - CLASS A |
5.72% |
ROBINHOOD MARKETS INC - A |
5.05% |
CRISPR THERAPEUTICS AG |
4.81% |
ZOOM VIDEO COMMUNICATIONS-A |
4.25% |
ROBLOX CORP -CLASS A |
3.76% |
DRAFTKINGS INC-CL A |
3.30% |
61.94% |
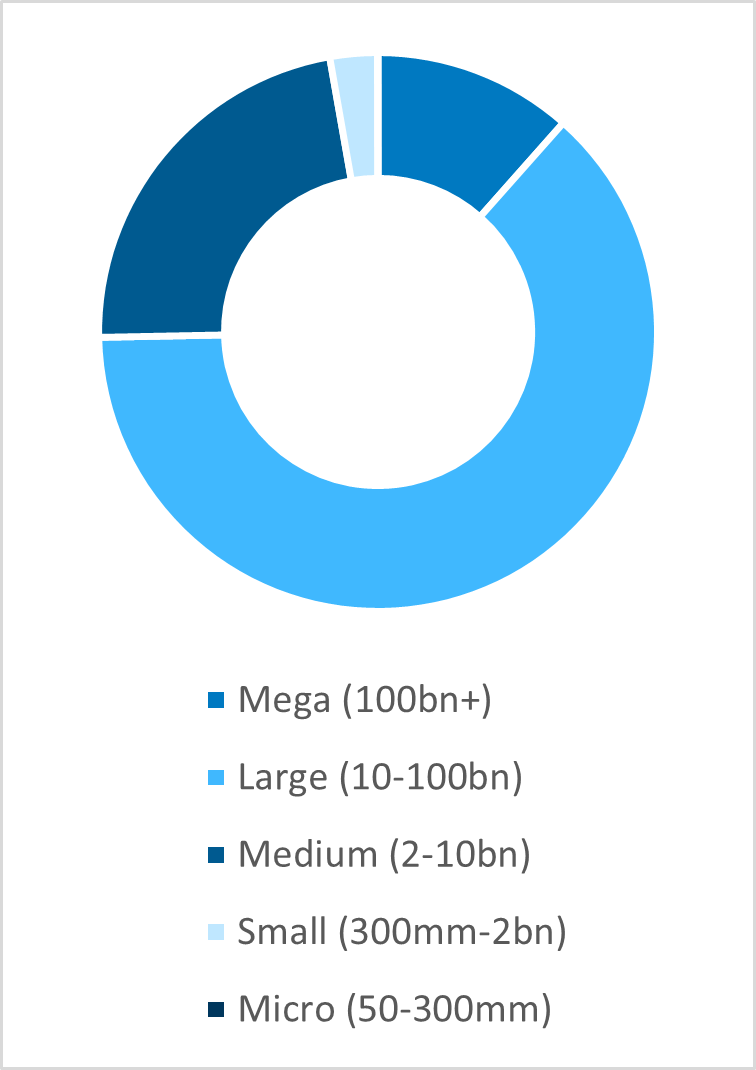 | 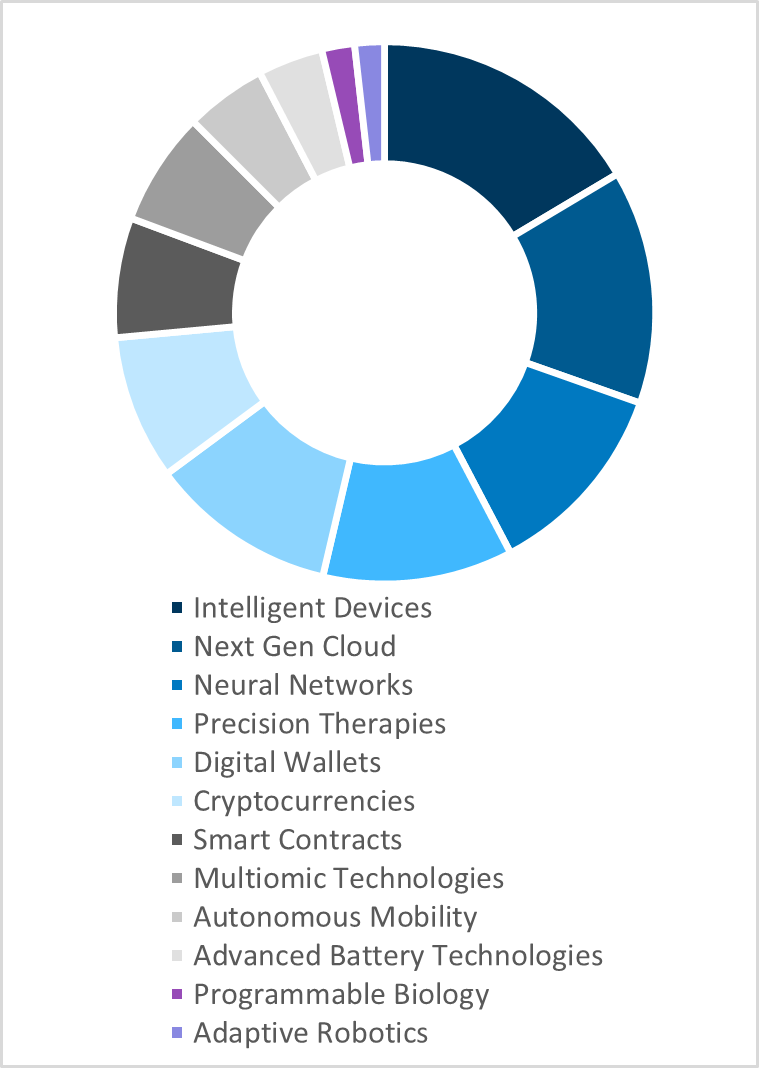 | 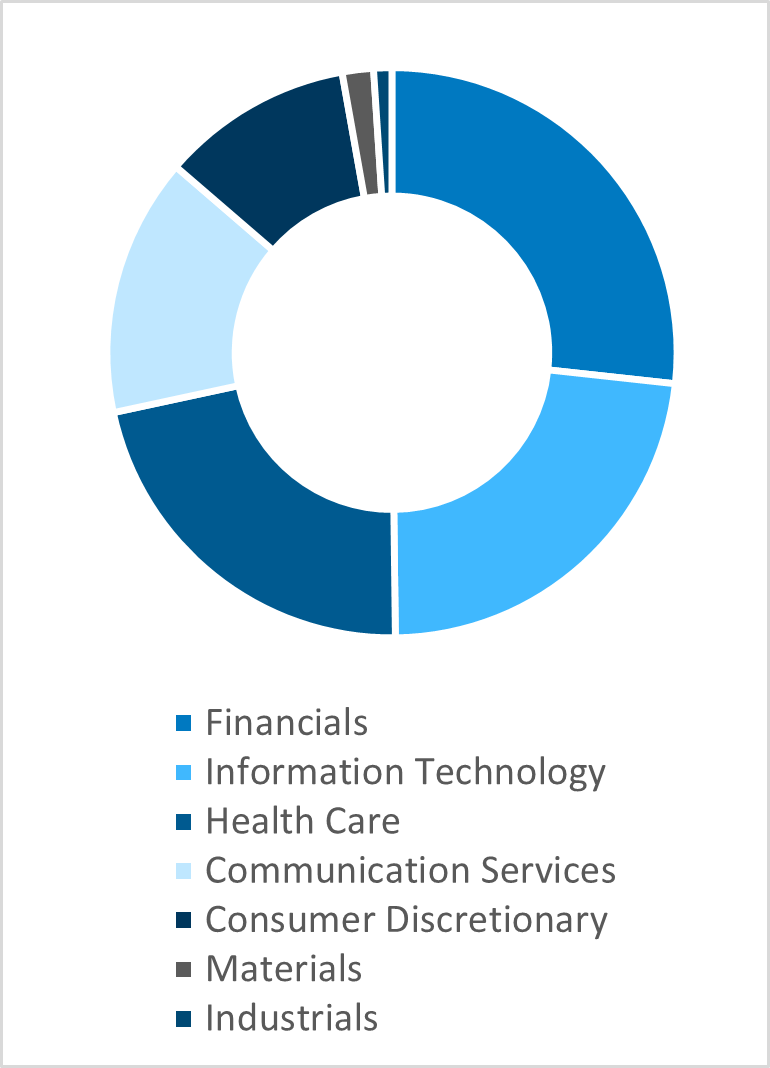 |
| Market Capitalization | Portfolio Composition | Sectors |
|
|
|
Portfolio construction as of March 30, 2024.
Portfolio Manager Bio
Catherine “Cathie” D. Wood

Cathie registered ARK Investment Management LLC (“ARK”) as an investment adviser with the U.S. Securities and Exchange Commission in January 2014. With over 40 years of experience identifying and investing in innovation, Cathie founded ARK to focus solely on disruptive innovation while adding new dimensions to research. Through an open approach that cuts across sectors, market capitalizations, and geographies, Cathie believes that ARK can identify large-scale investment opportunities in the public markets resulting from technological innovations centered around DNA sequencing, robotics, artificial intelligence, energy storage, and blockchain technology. As Chief Investment Officer (“CIO”) and Portfolio Manager, Cathie led the development of ARK’s philosophy and investment approach and has ultimate responsibility for investment decisions.
Prior to ARK, Cathie spent twelve years at AllianceBernstein as CIO of Global Thematic Strategies where she managed over $5 billion. Cathie joined Alliance Capital from Tupelo Capital Management, a hedge fund she cofounded, which in 2000, managed approximately $800 million in global thematic strategies. Prior to her tenure at Tupelo Capital, she worked for 18 years with Jennison Associates LLC as Chief Economist, Equity Research Analyst, Portfolio Manager and Director. She started her career in Los Angeles, California at The Capital Group as an Assistant Economist. Cathie received her Bachelor of Science, summa cum laude, in Finance and Economics from the University of Southern California in 1981.
In 2018, Cathie launched the Duddy Innovation Center of Excellence at her alma mater, Notre Dame Academy in Los Angeles. The institute offers a challenging educational experience for young women eager to stretch their learning beyond the boundaries of traditional acquisition of knowledge, while influencing a new way of thinking and learning throughout the campus.
1 As measured by the S&P 500 and MSCI World.
2 ARK’s Five Innovation Platforms are Artificial Intelligence, Robotics, Energy Storage, Multiomic Sequencing and Blockchain Technology.
3 WARD’s Automotive Group. Data as of March 31, 2024.
4 Manheim Used Vehicle Value Index. Data as of March 31, 2024.
5 National Associate of Realtors. Data as of February 29, 2024.
6 U.S. Bureau of Labor Statistics. Data as of December 31, 2024.
7 U.S. Federal Reserve Economic Data as of December 2024. GDP is the total market value of all finished goods and services produced within a country’s border within a specific time period, typically a year. GDI is a measure of the total income generated by a country’s economy within a specific time period, typically a year.
8 National Federation of Independent Business. Data as of March 2024.
9 M2 is a measure of the U.S. money stock that includes M1 (currency and coins held by the non-bank public, checkable deposits, and travelers’ checks) plus savings deposits (including money market deposit accounts), small time deposits under $100,000, and shares in retail money market mutual funds.
10 U.S. Federal Reserve Economic Data from January 1960 to December 2023. M2 prior to 1960 is calculated by adding Currency Held By The Public, Deposits Adjusted Commercial Banks, Bank Vault Cash, Monetary Gold Stock, and Deposits At Nonbank Thrift Institutions.
11 As measured by the difference between yields on the 10-year Treasury bond and the 2-year Treasury note.
12 An “inversion” means that the long-term Treasury yield is lower than the short-term Treasury yield. The yield difference was +159 basis points on March 29, 2021, and -108 basis points on July 3, 2023. One basis point is equal to 1/100 of a percentage point, or 0.01%.
13 The yield different was -39 basis points on March 28, 2024.
14 U.S. Bureau of Labor Statistics. Data as of February 29, 2024.
Not intended for distribution outside of Canada.
Certain of the products and services offered under the brand name BMO Global Asset Management are designed specifically for various categories of investors in a number of different countries and regions and may not be available to all investors. Products and services are only offered to such investors in those countries and regions in accordance with applicable laws and regulations.
This communication is intended for informational purposes only and is not, and should not be construed as, investment, legal or tax advice to any individual. Particular investments and/or trading strategies should be evaluated relative to each individual’s circumstances. Individuals should seek the advice of professionals, as appropriate, regarding any particular investment. Past performance does not guarantee future results.
The viewpoints expressed by the Portfolio Manager represents their assessment of the markets at the time of publication. Those views are subject to change without notice at any time. The information provided herein does not constitute a solicitation of an offer to buy, or an offer to sell securities nor should the information be relied upon as investment advice. Past performance is no guarantee of future results. This communication is intended for informational purposes only.
*The portfolio holdings are subject to change without notice and only represent a small percentage of portfolio holdings. They are not recommendations to buy or sell any particular security.
Any statement that necessarily depends on future events may be a forward-looking statement. Forward-looking statements are not guarantees of performance. They involve risks, uncertainties and assumptions. Although such statements are based on assumptions that are believed to be reasonable, there can be no assurance that actual results will not differ materially from expectations. Investors are cautioned not to rely unduly on any forward-looking statements. In connection with any forward-looking statements, investors should carefully consider the areas of risk described in the most recent simplified prospectus.
Commissions, management fees and expenses all may be associated with investments in exchange traded funds. Please read the ETF Facts or prospectus of the BMO ETFs before investing. Exchange traded funds are not guaranteed, their values change frequently, and past performance may not be repeated.
For a summary of the risks of an investment in the BMO ETFs, please see the specific risks set out in the BMO ETF’s prospectus. BMO ETFs trade like stocks, fluctuate in market value and may trade at a discount to their net asset value, which may increase the risk of loss. Distributions are not guaranteed and are subject to change and/or elimination.
BMO ETFs are managed by BMO Asset Management Inc., which is an investment fund manager and a portfolio manager, and a separate legal entity from Bank of Montreal.
BMO Global Asset Management is a brand name that comprises BMO Asset Management Inc. and BMO Investments Inc.
®/™Registered trademarks/trademark of Bank of Montreal, used under licence.