BMO S&P/TSX 60 Index ETF – ZIU
Jan 31, 2024
| BMO S&P/TSX 60 Index ETF – ZIU is designed for equity investors who want exposure to the 60 largest companies by market capitalization that are listed on the Toronto Exchange. The ETF will attempt to replicate the constituent securities of the S&P/TSX 60 index. ZIU can be used to gain a more concentrated exposure to Canada’s largest and most liquid publicly traded companies. |  |
Key Facts
| ETF Ticker: ZIU | Benchmark: S&P/TSX 60 Index |
| Management Fee: 0.13 | Risk Rating: Medium* |
| Distribution Frequency: Quarterly | Current Net Asset Value Per Share: $48.81** |
* Risk is defined as the uncertainty of return and the potential for capital loss in your investments.
** As of January 31, 2024. A higher current NAV per share can potentially provide trading cost efficiencies for purchasers that pay per unit commissions.
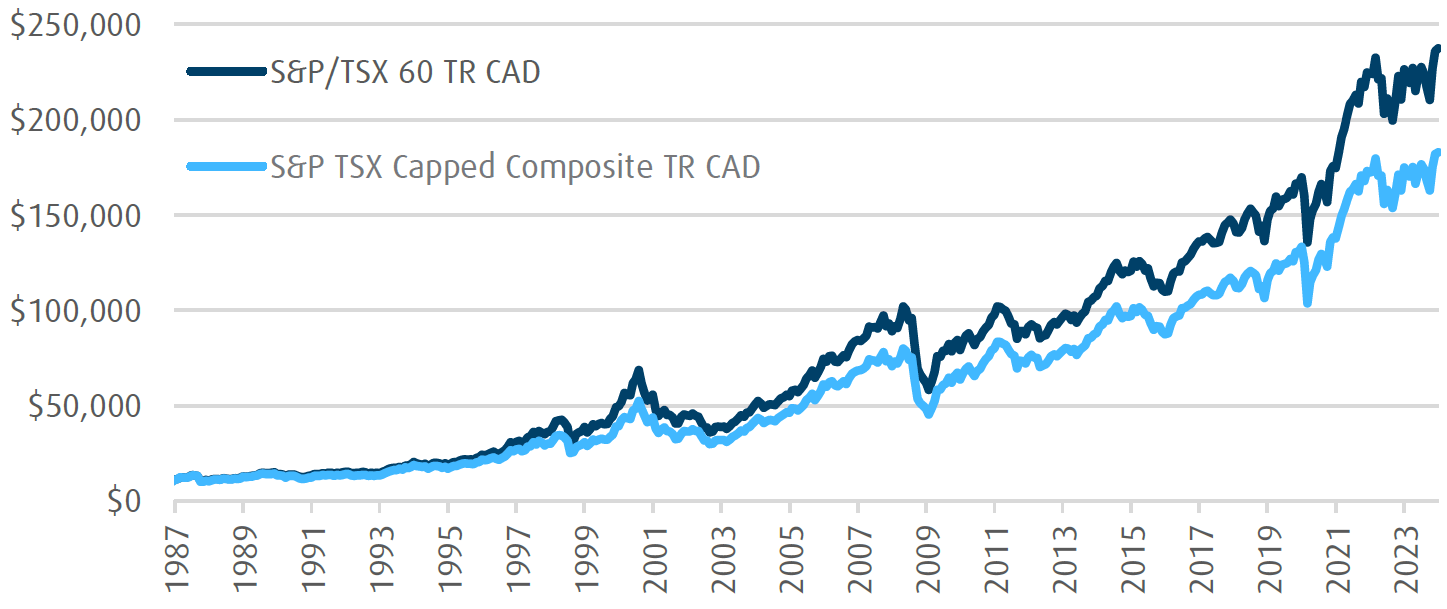
Historical Performance of S&P TSX 60 Index Vs. S&P TSX Capped Composite Index
| Index | 1 yr | 3yr | 5 yr | 10 yr |
| S&P TSX 60 Index | 4.90% | 10.78% | 9.94% | 8.24% |
| S&P TSX Capped Composite Index | 4.62% | 9.91% | 9.57% | 7.59% |
Source: Moringstar direct, total returns as of January 31,2024.
Past Performance is not indicative of future results.
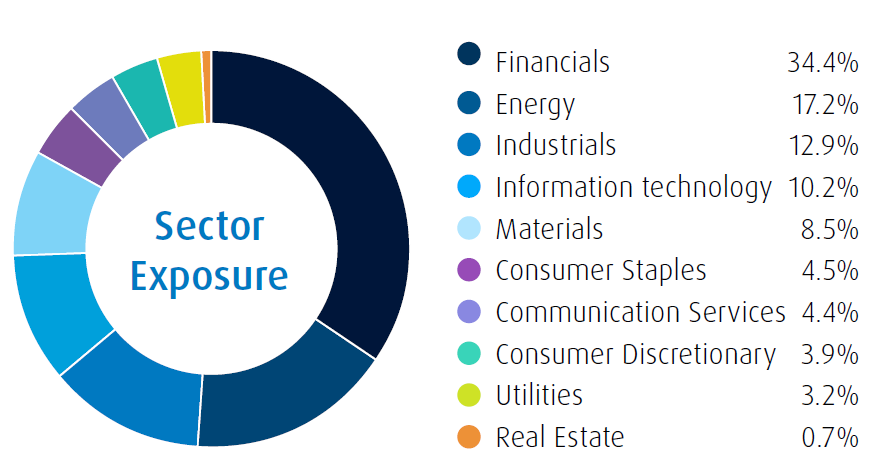
Holding Compositions Comparison
| S&P TSX 60 Index |
| Number of Consittuents: 60 |
| Weight Top 10 Constituent: 44.6% |
 |
Top 10 Holdings
Ticker |
Company |
Weight |
Sector |
RY |
Royal Bank Of Canada |
7.57% |
Financials |
TD |
Toronto Dominion |
6.14% |
Financials |
SHOP |
Shopify Subordinate Voting Inc CLA |
5.40% |
Information |
Technology |
|||
ENB |
Enbridge Inc |
4.15% |
Energy |
CP |
Canadian Pacific Kansas City Ltd |
4.03% |
Industrials |
CNR |
Canadian National Railway |
3.97% |
Industrials |
CNQ |
Canadian Natural Resources Ltd |
3.83% |
Energy |
BMO |
Bank Of Montreal |
3.76% |
Financials |
BN |
Brookfield Corp |
3.19% |
Financials |
BNS |
Bank Of Nova Scotia |
3.07% |
Financials |
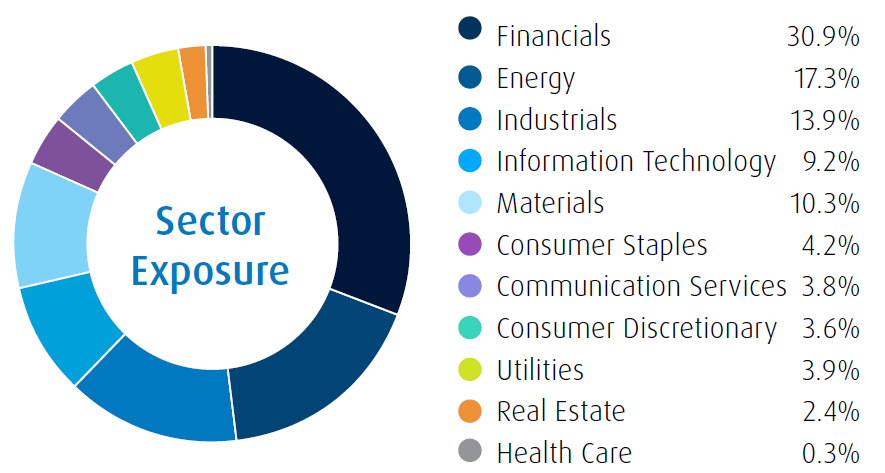
Holding Compositions Comparison
S&P TSX Capped Composite Index |
| Number of Consittuents: 225 |
| Weight Top 10 Constituent: 36.0% |
 |
Top 10 Holdings
| Ticker | Company | Weight | Sector |
RY |
Royal Bank Of Canada |
6.15% |
Financials |
TD |
Toronto Dominion |
4.99% |
Financials |
SHOP |
Shopify Subordinate Voting Inc CLA |
4.39% |
Information |
Technology |
|||
ENB |
Enbridge Inc |
3.37% |
Energy |
CP |
Canadian Pacific Kansas City Ltd |
3.27% |
Industrials |
CNR |
Canadian National Railway |
3.22% |
Industrials |
CNQ |
Canadian Natural Resources Ltd |
3.11% |
Energy |
BMO |
Bank Of Montreal |
3.04% |
Financials |
BN |
Brookfield Corp |
2.58% |
Financials |
BNS |
Bank Of Nova Scotia |
2.50% |
Financials |
* The S&P TSX Capped Composite Index imposes capped weights of 10%
on all the constituents included.
Any statement that necessarily depends on future events may be a forward-looking statement. Forward-looking statements are not guarantees of performance. They involve risks, uncertainties and assumptions. Although such statements are based on assumptions that are believed to be reasonable, there can be no assurance that actual results will not differ materially from expectations. Investors are cautioned not to rely unduly on any forward-looking statements. In connection with any forward-looking statements, investors should carefully consider the areas of risk described in the most recent simplified prospectus.
This communication is intended for informational purposes only and is not, and should not be construed as, investment and/or tax advice to any individual. Particular investments and/or trading strategies should be evaluated relative to each individual’s circumstances. Individuals should seek the advice of professionals, as appropriate, regarding any particular investment.
Commissions, management fees and expenses all may be associated with investments in exchange traded funds. Please read the fund facts or prospectus before investing. Exchange traded funds are not guaranteed, their values change frequently and past performance may not be repeated. For a summary of the risks of an investment in the BMO ETFs, please see the specific risks set out in the prospectus. BMO ETFs trade like stocks, fluctuate in market value and may trade at a discount to their net asset value, which may increase the risk of loss. Distributions are not guaranteed and are subject to change and/or elimination.
BMO ETFs are managed by BMO Asset Management Inc., which is an investment fund manager and a portfolio manager, and a separate legal entity from Bank of Montreal. BMO Global Asset Management is a brand name that comprises BMO Asset Management Inc. and BMO Investments Inc.
®/™Registered trademarks/trademark of Bank of Montreal, used under licence