Factor ETFs: A Liquidity Sleeve Aligned with Your Investment Process


How can Investment Counsellors and Family Offices best utilize factor ETFs as a component of their investment processes? In this article, Erika Toth, Director, Institutional & Advisory, Eastern Canada, breaks down the benefits of four different factors, sheds light on BMO’s screening processes, and discusses how factor ETFs may complement firms’ core competencies.
Many Family Offices and Investment Counselling firms have well-honed investment processes when it comes to Canadian and U.S. equity markets. However, there may be situations where factor ETFs can complement these well-honed core competencies. Some of these scenarios may include:
- As a solution for smaller accounts
- As a liquidity sleeve
- As a diversifier, with factor ETFs potentially providing easy and low-cost market access to International (EAFE) and Emerging Markets (EM) equities in alignment with the firm’s investment process and goals
- To express views on currency; many factor ETFs offer the choice of investing in hedged-to-CAD or unhedged versions, as well as, in some cases, a U.S. dollar (USD) version
The value proposition of factor ETFs is simple: they offer the potential for outperformance and/or reduction of risk versus the benchmark, often for a fraction of the cost of an active strategy.
Determining which Factor ETF is Right for Your Investment Process
When considering factor ETFs, a first step is to examine the screening rules to determine which factor best aligns with your or your firm’s own investment process when selecting equities. The following may provide a useful starting point:
Low Volatility:
- Primary concern is to identify companies that are less sensitive to the business cycle, less volatile than the broad market, and reduce downside exposure.
- Screen for stable, mature companies, mostly in the large cap space, with the lowest betas.
- Implement a cap on the weight of an individual company in the portfolio, as well as on each sector, to mitigate risk.
- Tends to result in portfolios heavier in Consumer Staples, Utilities, and Health Care companies. At times, investors may wish to complement with satellite positions that will provide more exposure to sectors with higher volatility profiles, such as Technology, Energy, or Financials.
BMO’s Low Volatility ETFs1
BMO Low Volatility Canadian Equity |
BMO Low Volatility US Equity
ZLH: 2.42% | ZLU: 2.48% | ZLU.U: 2.45% | Quarterly |
BMO Low Volatility International Equity
ZLD: 2.65% | ZLI: 2.70% | Quarterly |
BMO Low Volatility Emerging Markets Equity
Mgmt. Fee: 0.45% |
As of January 5, 2024.
Performance
1 mo |
3 mo |
6 mo |
YTD |
1Y |
3Y |
5Y |
10Y |
Since Inception |
|
3.91% |
8.51% |
2.26% |
9.39% |
9.39% |
10.22% |
10.64% |
10.32% |
11.60% |
|
1.88% |
6.31% |
-0.05% |
-1.97% |
-1.97% |
6.01% |
8.89% |
- |
8.15% |
|
-0.27% |
4.18% |
0.52% |
-3.11% |
-3.11% |
8.07% |
9.19% |
12.32% |
13.11% |
|
2.13% |
6.79% |
0.49% |
-0.99% |
-0.99% |
6.63% |
9.84% |
9.87% |
10.47% |
|
2.57% |
5.22% |
3.55% |
12.61% |
12.61% |
5.41% |
5.28% |
- |
6.29% |
|
2.34% |
7.14% |
4.33% |
10.06% |
10.06% |
1.63% |
2.67% |
- |
4.67% |
|
1.15% |
3.96% |
4.75% |
7.70% |
7.70% |
-4.43% |
-1.13% |
- |
0.33% |
As of December 31, 2023. Past performance is not a guide to future performance. Performance is shown net of fees, in the currency of the respective share class with dividends reinvested.
Dividends:
- Stable and mature large cap companies with a history of paying and growing dividends.
- To ensure that the ETF is not a “yield trap,” certain quality metrics are considered. For instance, companies must have an investment grade credit rating (BBB or better).
- Dividend sustainability: dividend payout ratio is examined (dividends/operating cash flows).
- Companies with a relatively lower payout ratio are favoured as they are less likely to cut dividends in the future.
- Companies with stable earnings tend to naturally score higher on this metric
- Only then is the resulting list of names yield-weighted.
- To manage portfolio concentration risk, there is a 6% cap on any individual stock, as well as sector concentration rules.
- When compared to benchmark indices, these screens tend to result in a portfolio with a slight Value tilt.
BMO’s Dividend ETFs1
BMO Canadian Dividend
Mgmt. Fee: 0.35% |
BMO US Dividend
ZUD: 2.44% | ZDY: 2.53% | ZDY.U: 2.47% | Monthly |
As of January 5, 2024.
Performance
1 mo |
3 mo |
6 mo |
YTD |
1Y |
3Y |
5Y |
10Y |
Since Inception |
|
4.45% |
8.99% |
4.82% |
8.19% |
8.19% |
11.03% |
10.15% |
5.97% |
6.94% |
|
4.15% |
8.03% |
4.72% |
5.68% |
5.68% |
7.39% |
7.33% |
7.90% |
8.80% |
|
2.00% |
6.04% |
5.48% |
4.68% |
4.68% |
9.62% |
7.87% |
11.19% |
12.17% |
|
4.46% |
8.70% |
5.46% |
6.97% |
6.97% |
8.17% |
8.53% |
8.77% |
9.56% |
|
2.40% |
4.35% |
4.96% |
18.62% |
18.82% |
13.30% |
9.61% |
- |
7.74% |
|
2.49% |
6.66% |
6.44% |
16.51% |
16.51% |
9.69% |
7.08% |
- |
6.01% |
As of December 31, 2023. Past performance is not a guide to future performance. Performance is shown net of fees, in the currency of the respective share class with dividends reinvested.
Quality:
- These ETFs tend to hold stable and mature companies with sustainable competitive advantages, and thus higher growth potential versus their peers.
- MSCI High Quality Indexes use three key metrics: profitability, stable earnings growth year-over-year, and low leverage.
- Profitability: MSCI Quality Indexes use Return on Equity (ROE) to measure a company’s profitability.
- Stable earnings growth year-over-year; this will tend to favour non-cyclical businesses with higher earnings quality.
- Cash rich companies with strong balance sheets: MSCI Quality Indexes screen for low financial leverage (low Debt/Equity ratio).
- The Quality factor tends to be more growth-oriented, therefore valuations tend to be slightly higher versus other factors.
- Tends to result in a higher weight to Information Technology and Consumer Discretionary sectors, and lower weights in Financials, Real Estate, and Utilities, as these are more leverage-intensive businesses.
BMO’s Quality ETFs1
BMO MSCI USA High Quality Index
ZUQ.F: 0.95% | ZUQ: 0.91% | ZUQ.U: 0.91% | Quarterly |
World High Quality Index
Distribution Yield: 1.39% | Quarterly |
BMO MSCI Europe High Quality Hedged to CAD Index
Distribution Yield: 2.64% | Quarterly |
As of January 5, 2024.
Performance
1 mo |
3 mo |
6 mo |
YTD |
1Y |
3Y |
5Y |
10Y |
Since Inception |
|
4.60% |
11.36% |
9.40% |
34.22% |
34.22% |
8.82% |
- |
- |
12.14% |
|
2.33% |
9.12% |
10.18% |
32.66% |
32.66% |
11.26% |
16.78% |
- |
15.27% |
|
4.80% |
11.86% |
10.15% |
35.56% |
35.56% |
9.78% |
- |
- |
13.23% |
|
2.38% |
9.79% |
9.14% |
29.23% |
29.23% |
8.51% |
15.02% |
- |
13.12% |
|
3.83% |
7.14% |
2.59% |
14.85% |
14.85% |
7.99% |
12.27% |
- |
9.46% |
As of December 31, 2023. Past performance is not a guide to future performance. Performance is shown net of fees, in the currency of the respective share class with dividends reinvested.
Value:
- The value investing school of thought became widely known after economist and researcher Benjamin Graham first wrote on it extensively the 1930s. It is founded on the practice of identifying mispriced securities that may be trading at a discount to their fundamental value.
- The key is to apply screens that identify companies trading on the cheap versus their peers but are not “cheap for a reason” (i.e., “value traps”).
- MSCI Value Indexes combine three core value metrics to achieve this:
- Low forward price-to-earnings (P/E) ratio: to identify companies that are less expensive than their peers with similar earnings projections.
- Low price-to-book (P/B) ratio
- Low enterprise value (EV) and operating cash flows (OCF). Enterprise value considers all sources of a company’s capital: debt and equity. Therefore, EV and OCF tend to screen out companies that are the most highly levered and tends to favour companies with higher operating cash flows and therefore higher earnings quality.
Tend to perform well during periods of economic recovery and rising interest rates.2
BMO’s Value ETFs1
BMO MSCI Canada Value Index
|
BMO MSCI USA Value Index
Distribution Yield: 2.67% | Quarterly |
As of January 5, 2024.
Performance
1 mo |
3 mo |
6 mo |
YTD |
1Y |
3Y |
5Y |
10Y |
Since Inception |
|
3.77% |
4.89% |
6.48% |
11.16% |
11.16% |
14.65% |
11.28% |
- |
7.75% |
|
5.03% |
9.30% |
9.01% |
11.03% |
11.03% |
8.94% |
8.64% |
- |
7.44% |
As of December 31, 2023. Past performance is not a guide to future performance. Performance is shown net of fees, in the currency of the respective share class with dividends reinvested.
BMO’s factor ETF suite rebalances twice per year.
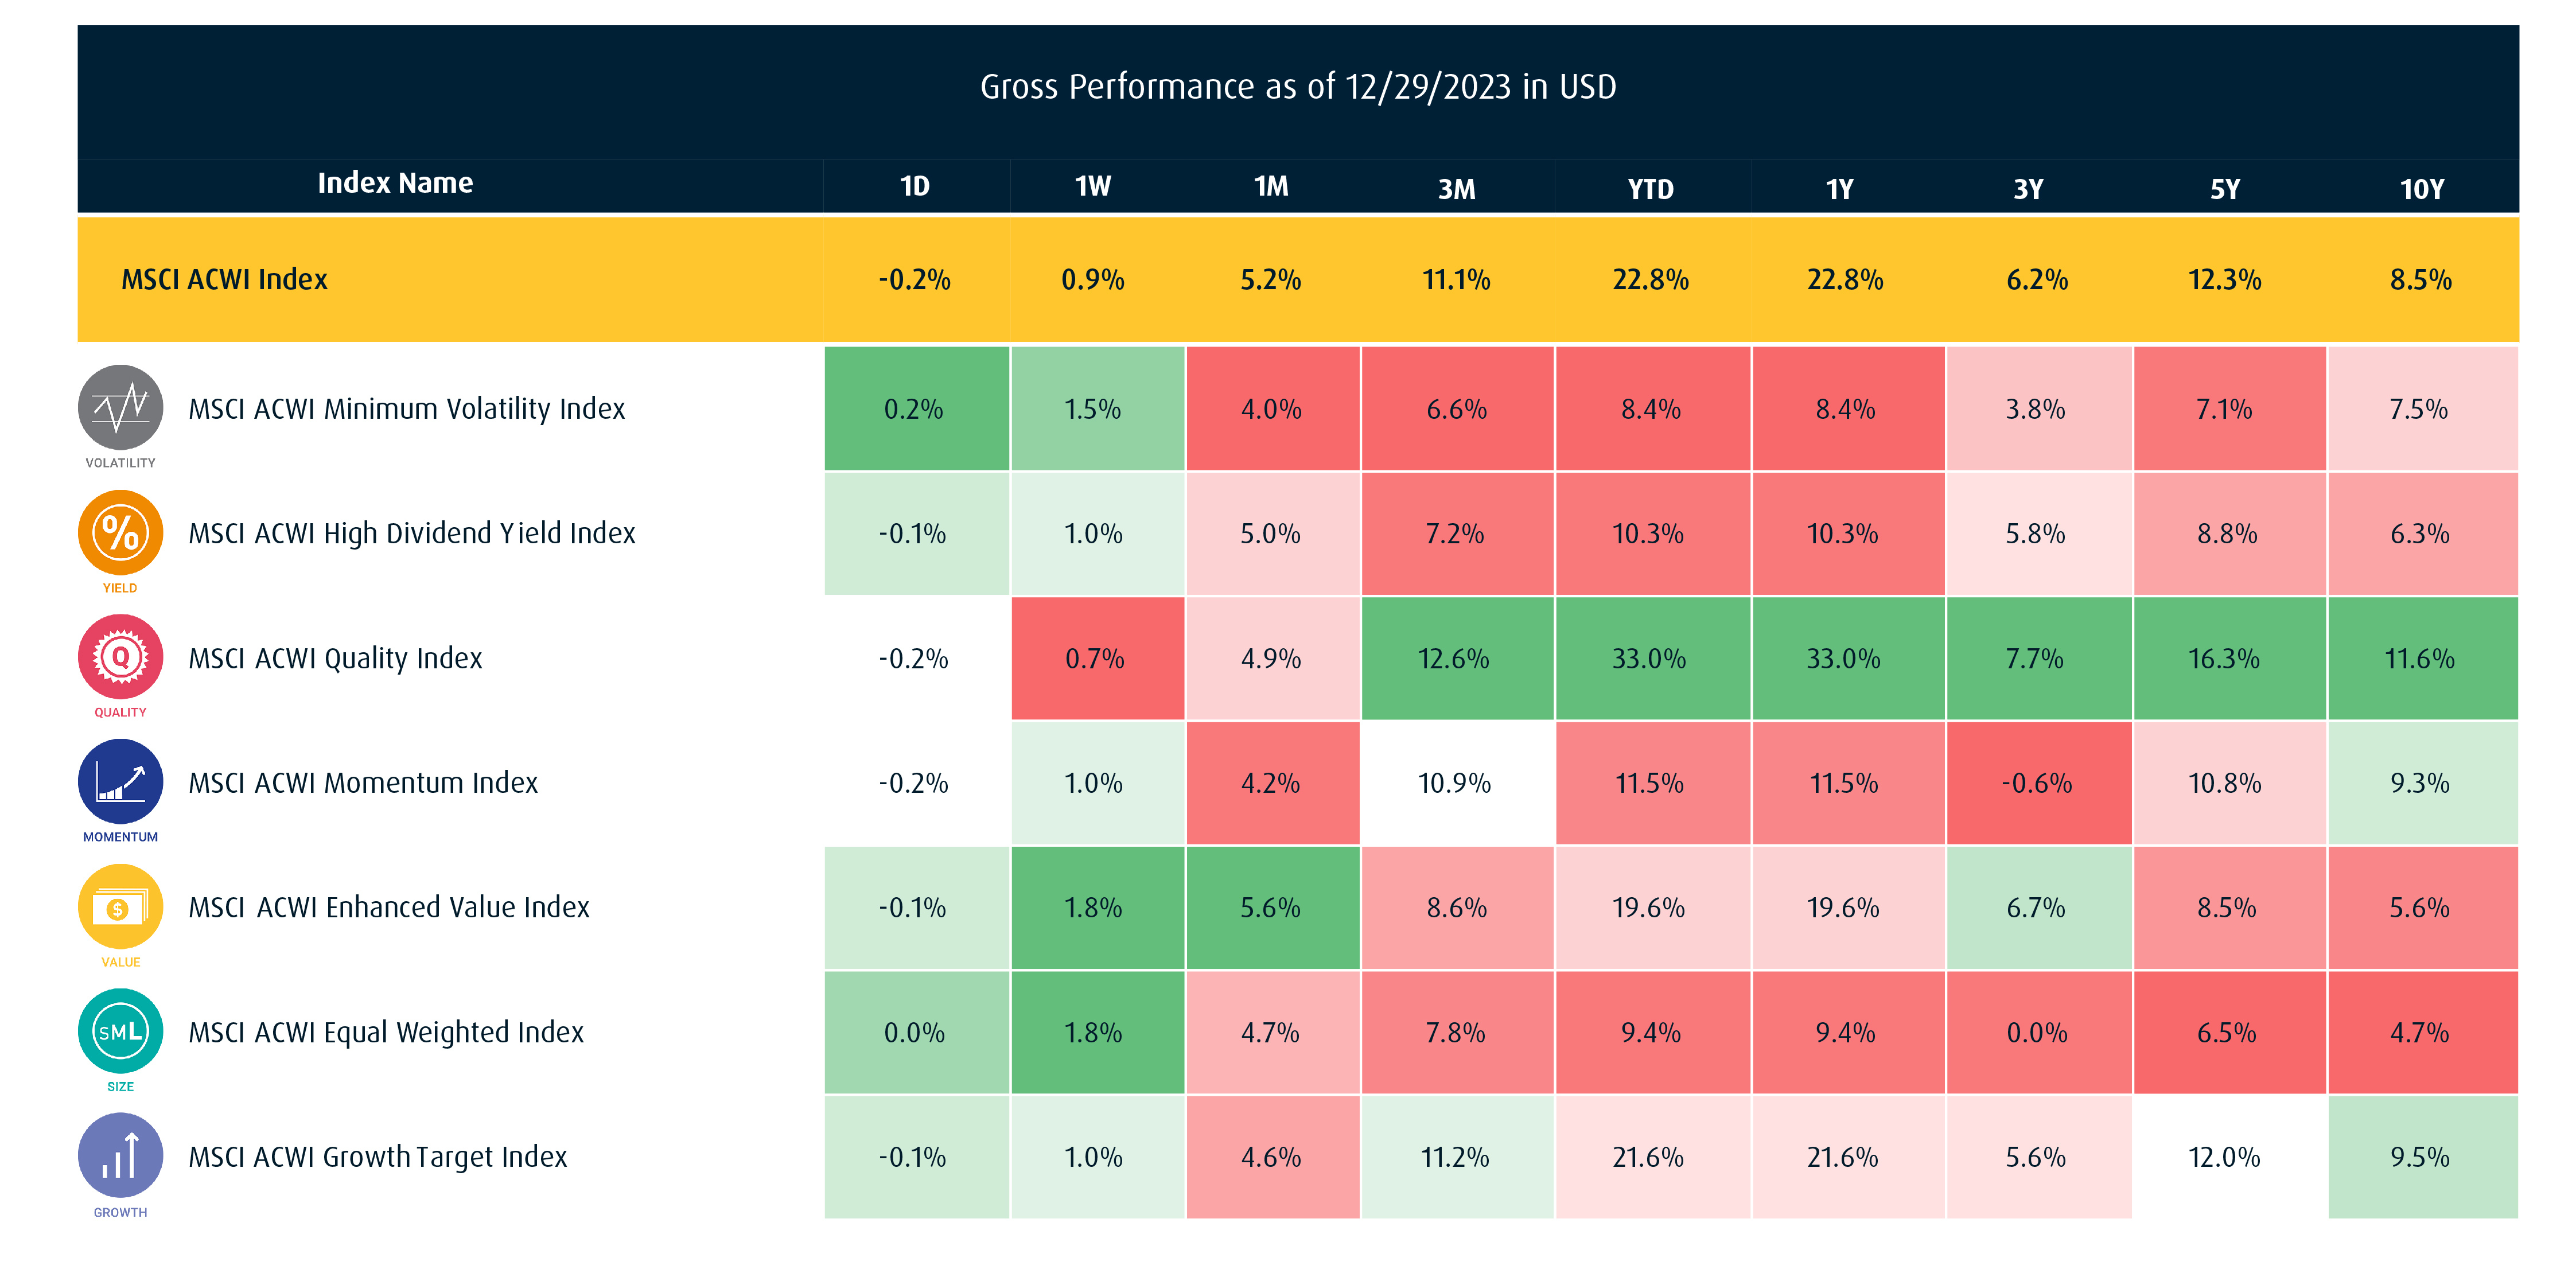
MSCI ACWI Factor Performance
BMO is the largest provider of factor ETFs to the Canadian marketplace,3 and we are eager to support you and your clients’ portfolios with our expertise and insights.
To learn more about factor-based investing, or receive other trading insights, reach out to your BMO ETF Specialist at their email address or via telephone at 1−877−741−7263.
1 Definitions:
Annualized Distribution Yield: The most recent regular distribution, or expected distribution, (excluding additional year end distributions) annualized for frequency, divided by current NAV.
DIST YIELD = Distribution Yield. The Frequency of distribution: M=Monthly Q=Quarterly A=Annually
O = Optionable ETFs
Duration: A measure of sensitivity of bond prices to changes in interest rates. For example, a 5 year duration means the bond will decrease in value by 5% if interest rates rise 1% and increase in value by 5% if interest rates fall 1%. Generally, the higher the duration the more volatile the bond’s price will be when interest rates change.
Risk Rating: Generally, the risk rating is based on how much the ETF’s returns have changed from year to year. It doesn’t tell you how volatile the ETF will be in the future. The rating can change over time. An ETF with a low risk rating can still lose money. For more information about the risk rating and specific risks that can affect the ETF’s returns, see the“Risk Factors” section of the ETF’s prospectus.
YTM: Yield to Maturity (YTM) is the discount rate that equates the present value of a bond’s cash flows with its market price (including accrued interest). The measure does not include fees and expenses.
Mgmt. Fee: Management Fee (Mgmt. Fee) is the annual fee payable by the fund and/or any underlying ETF(s) to BMO Asset Management Inc and/or its affiliates for acting as trustee and/or manager of the fund/ETF(s).
2 Vitali Kalesnik, “Value in Recessions and Recoveries,” Research Affiliates, June 2020.
3 National Bank of Canada Financial Markets, as of December 31, 2023. Measured by AUM; excludes dividend/income ETFs (which may or may not be considered factor ETFs).
Any statement that necessarily depends on future events may be a forward-looking statement. Forward-looking statements are not guarantees of performance. They involve risks, uncertainties and assumptions. Although such statements are based on assumptions that are believed to be reasonable, there can be no assurance that actual results will not differ materially from expectations. Investors are cautioned not to rely unduly on any forward-looking statements. In connection with any forward-looking statements, investors should carefully consider the areas of risk described in the most recent simplified prospectus.
The viewpoints expressed by the authors represents their assessment of the markets at the time of publication. Those views are subject to change without notice at any time without any kind of notice. The information provided herein does not constitute a solicitation of an offer to buy, or an offer to sell securities nor should the information be relied upon as investment advice. Past performance is no guarantee of future results. The statistics in this update are based on information believed to be reliable but not guaranteed.
This article is for information purposes. The information contained herein is not, and should not be construed as, investment, tax or legal advice to any party. Investments should be evaluated relative to the individual’s investment objectives and professional advice should be obtained with respect to any circumstance.
The ETF referred to herein is not sponsored, endorsed, or promoted by MSCI and MSCI bears no liability with respect to the ETF or any index on which such ETF is based. The ETF’s prospectus contains a more detailed description of the limited relationship MSCI has with the Manager and any related ETF.
Commissions, management fees and expenses all may be associated with investments in exchange traded funds. Please read the ETF Facts or prospectus before investing. The indicated rates of return are the historical annual compounded total returns including changes in unit value and reinvestment of all dividends or distributions and do not take into account sales, redemption, distribution or optional charges or income taxes payable by any unitholder that would have reduced returns. Exchange traded funds are not guaranteed, their values change frequently and past performance may not be repeated.
For a summary of the risks of an investment in the BMO ETFs, please see the specific risks set out in the prospectus. BMO ETFs trade like stocks, fluctuate in market value and may trade at a discount to their net asset value, which may increase the risk of loss. Distributions are not guaranteed and are subject to change and/or elimination.
BMO ETFs are managed by BMO Asset Management Inc., which is an investment fund manager and a portfolio manager, and a separate legal entity from Bank of Montreal.
BMO Global Asset Management is a brand name under which BMO Asset Management Inc. and BMO Investments Inc. operate.
®/™Registered trademarks/trademark of Bank of Montreal, used under licence.