Fixed Income Heat Map: A Mid-Year Temperature Check for Canadian Bonds
Canadian bonds gained ground during the first half of 2026, but leadership has shifted. See how duration, credit and yield have shaped the fixed income landscape this year.


Canadian fixed income markets performed well in June rising 0.5%, with performance led by intermediate and longer-duration segments.1 Government bonds also outperformed credit.
Canada bond yields came in as geopolitical risk tensions eased and inflation concerns came down along with declines in oil prices.
Government bonds outperformed credit overall, with intermediate and long-term government bonds emerging as the strongest performers in the month.2
BMO Canadian Fixed Income ETF Reference Guide
Ticker |
Full ETF name |
Ticker |
Full ETF name |
Canadian Fixed Income Market, Duration and Credit Total Returns (MTD, %)
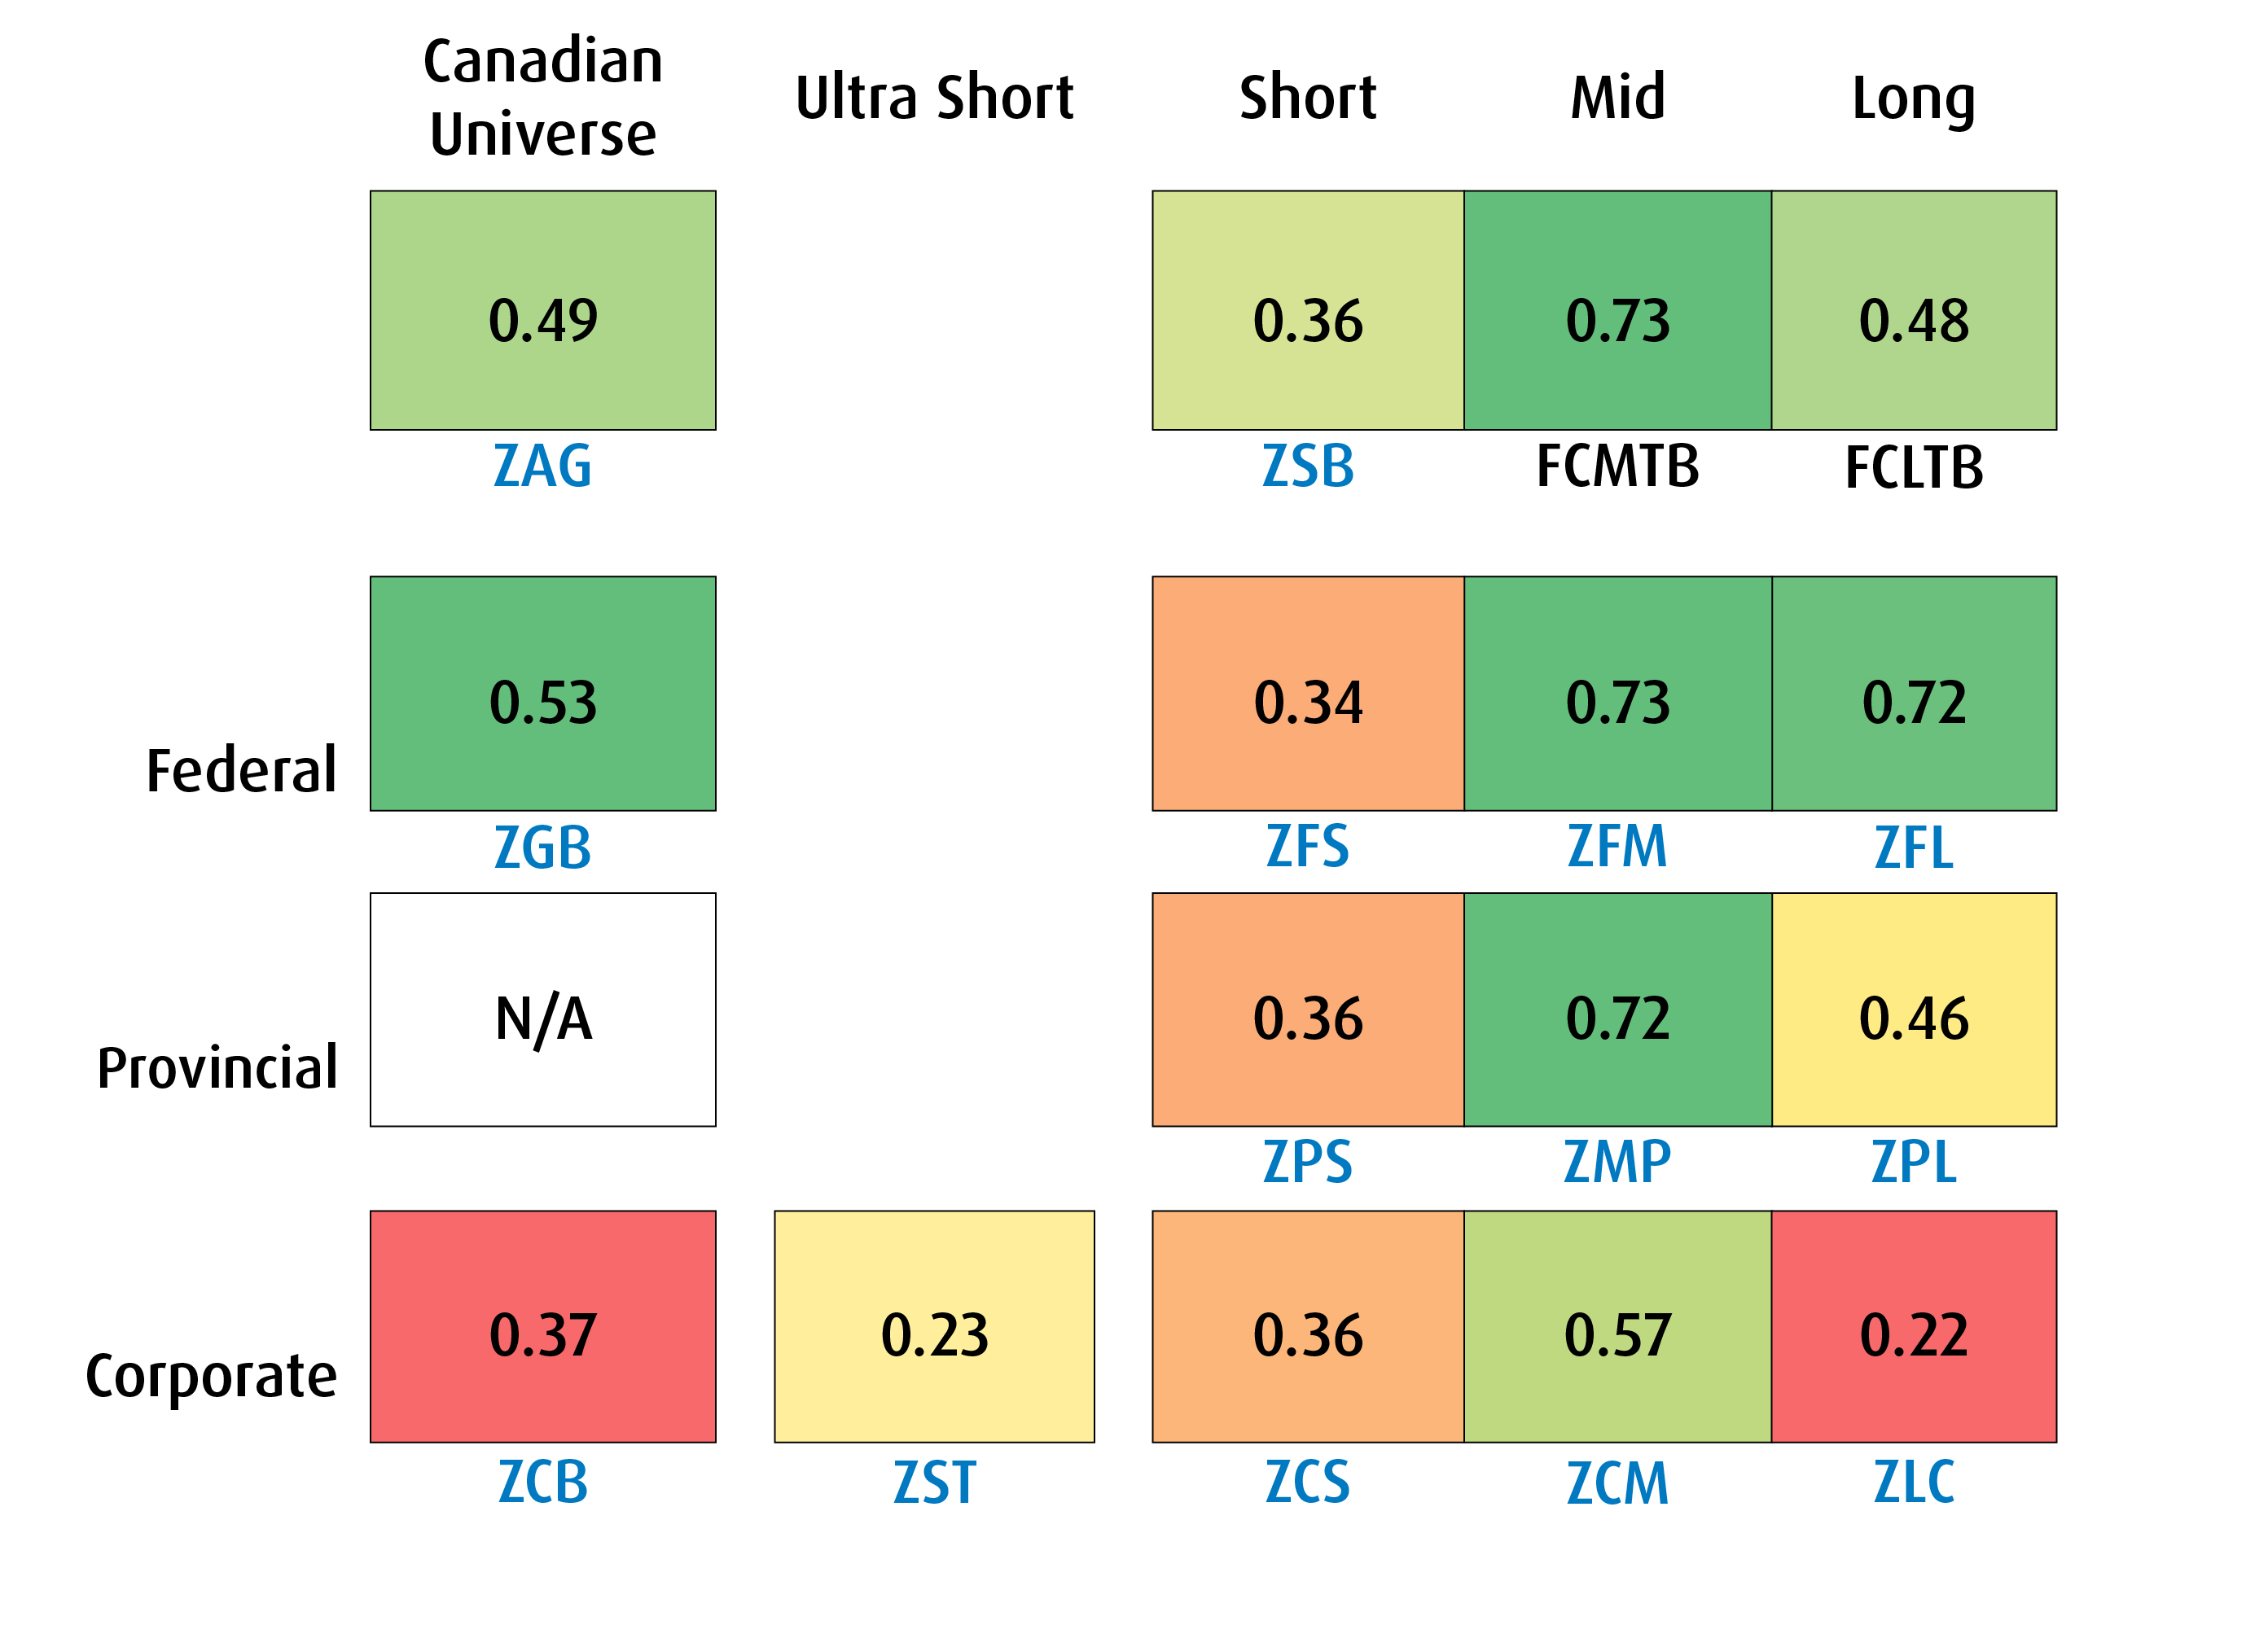
FCMTB = FTSE Canada Mid Term Bond Index. FCLTB = FTSE Canada Long Term Bond Index. A heatmap chart is a visual tool that shades cell backgrounds with color gradients based on the values inside a range. They help readers see high, low, and middle numbers at a quick glance. Dark Red cells represent the lowest number(s) and dark green represents the highest number(s). Yellow/Orange shaded cells represent number(s) in the middle of the range.
For the second quarter, Canadian fixed income generated strong positive returns as bond prices benefited from a relatively stable interest-rate environment and easing inflation concerns, with government and investment-grade corporate bonds both contributing positively.
Q2 yields initially rose, then gradually declined, with the front end of the yield curve anchored by the Bank of Canada (BoC) pause and most of the action occurring in the belly and long end of the curve. Two-year yields moved above 3% in mid-May before ending at 2.74%, while the 10-year yield reached 3.70% before finishing at 3.38%, supporting strong Q2 returns from intermediate and long-duration bonds.
Canadian Fixed Income Market, Duration and Credit Total Returns (QTD, %)
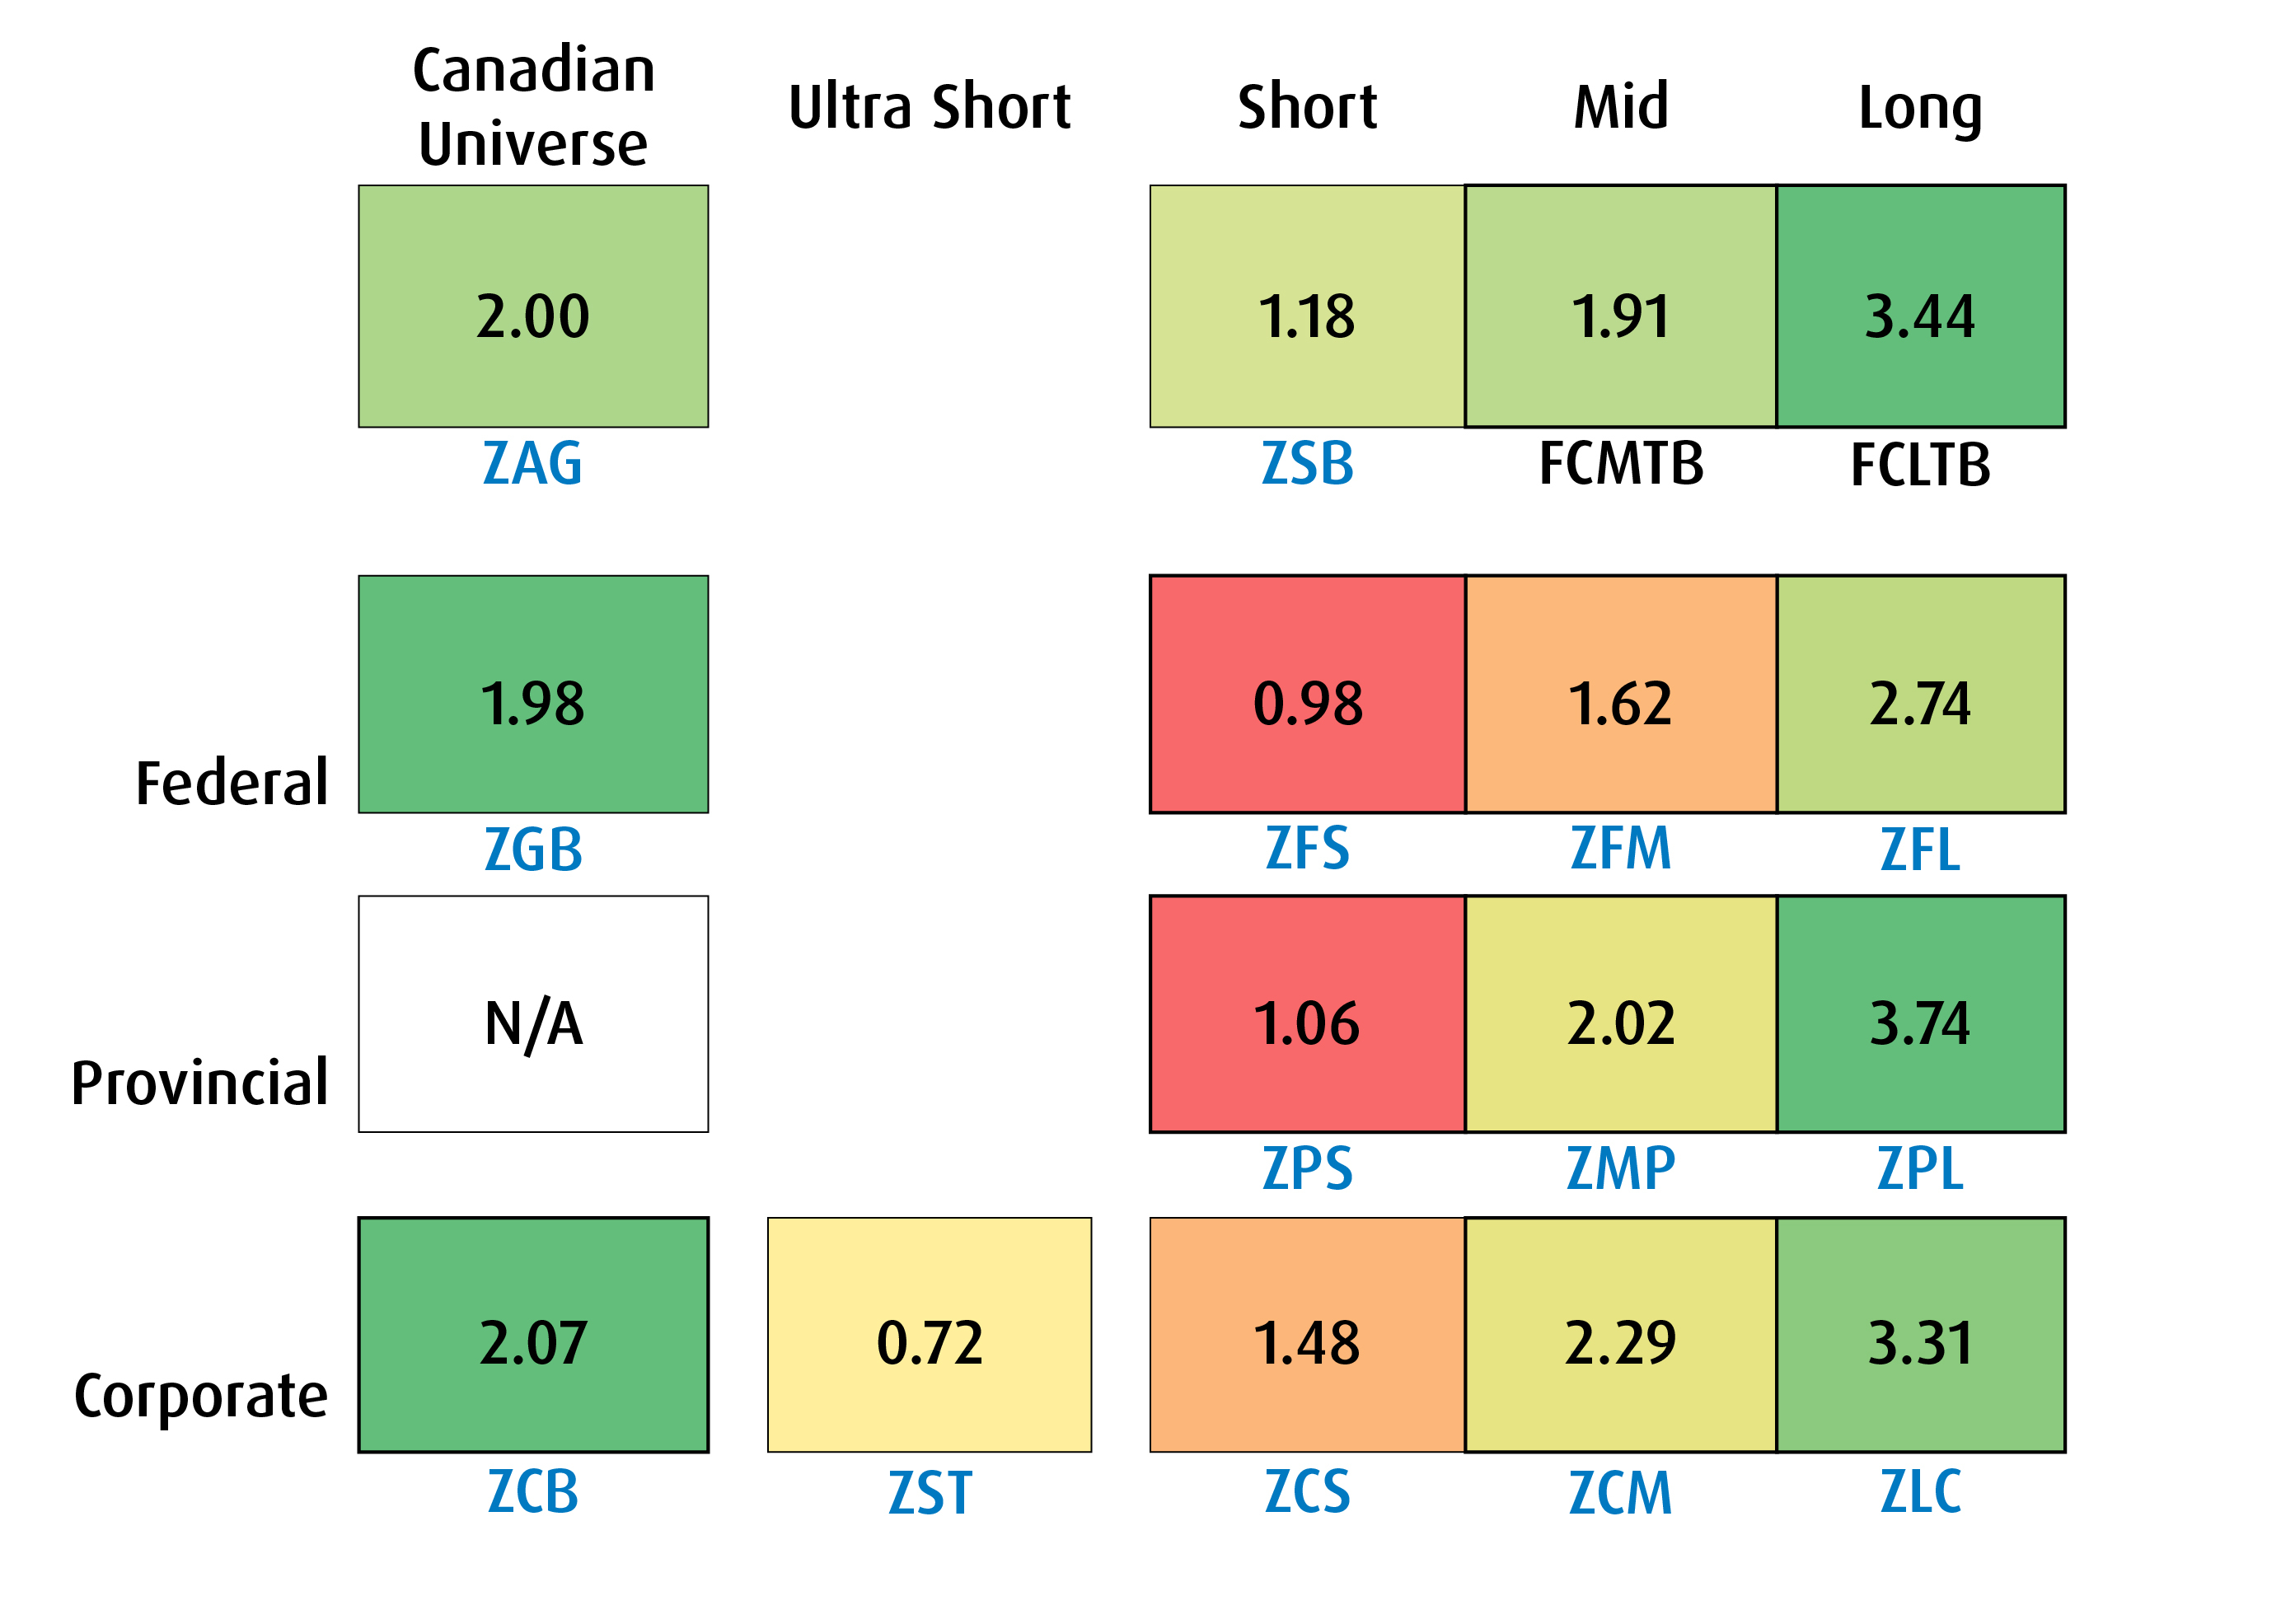
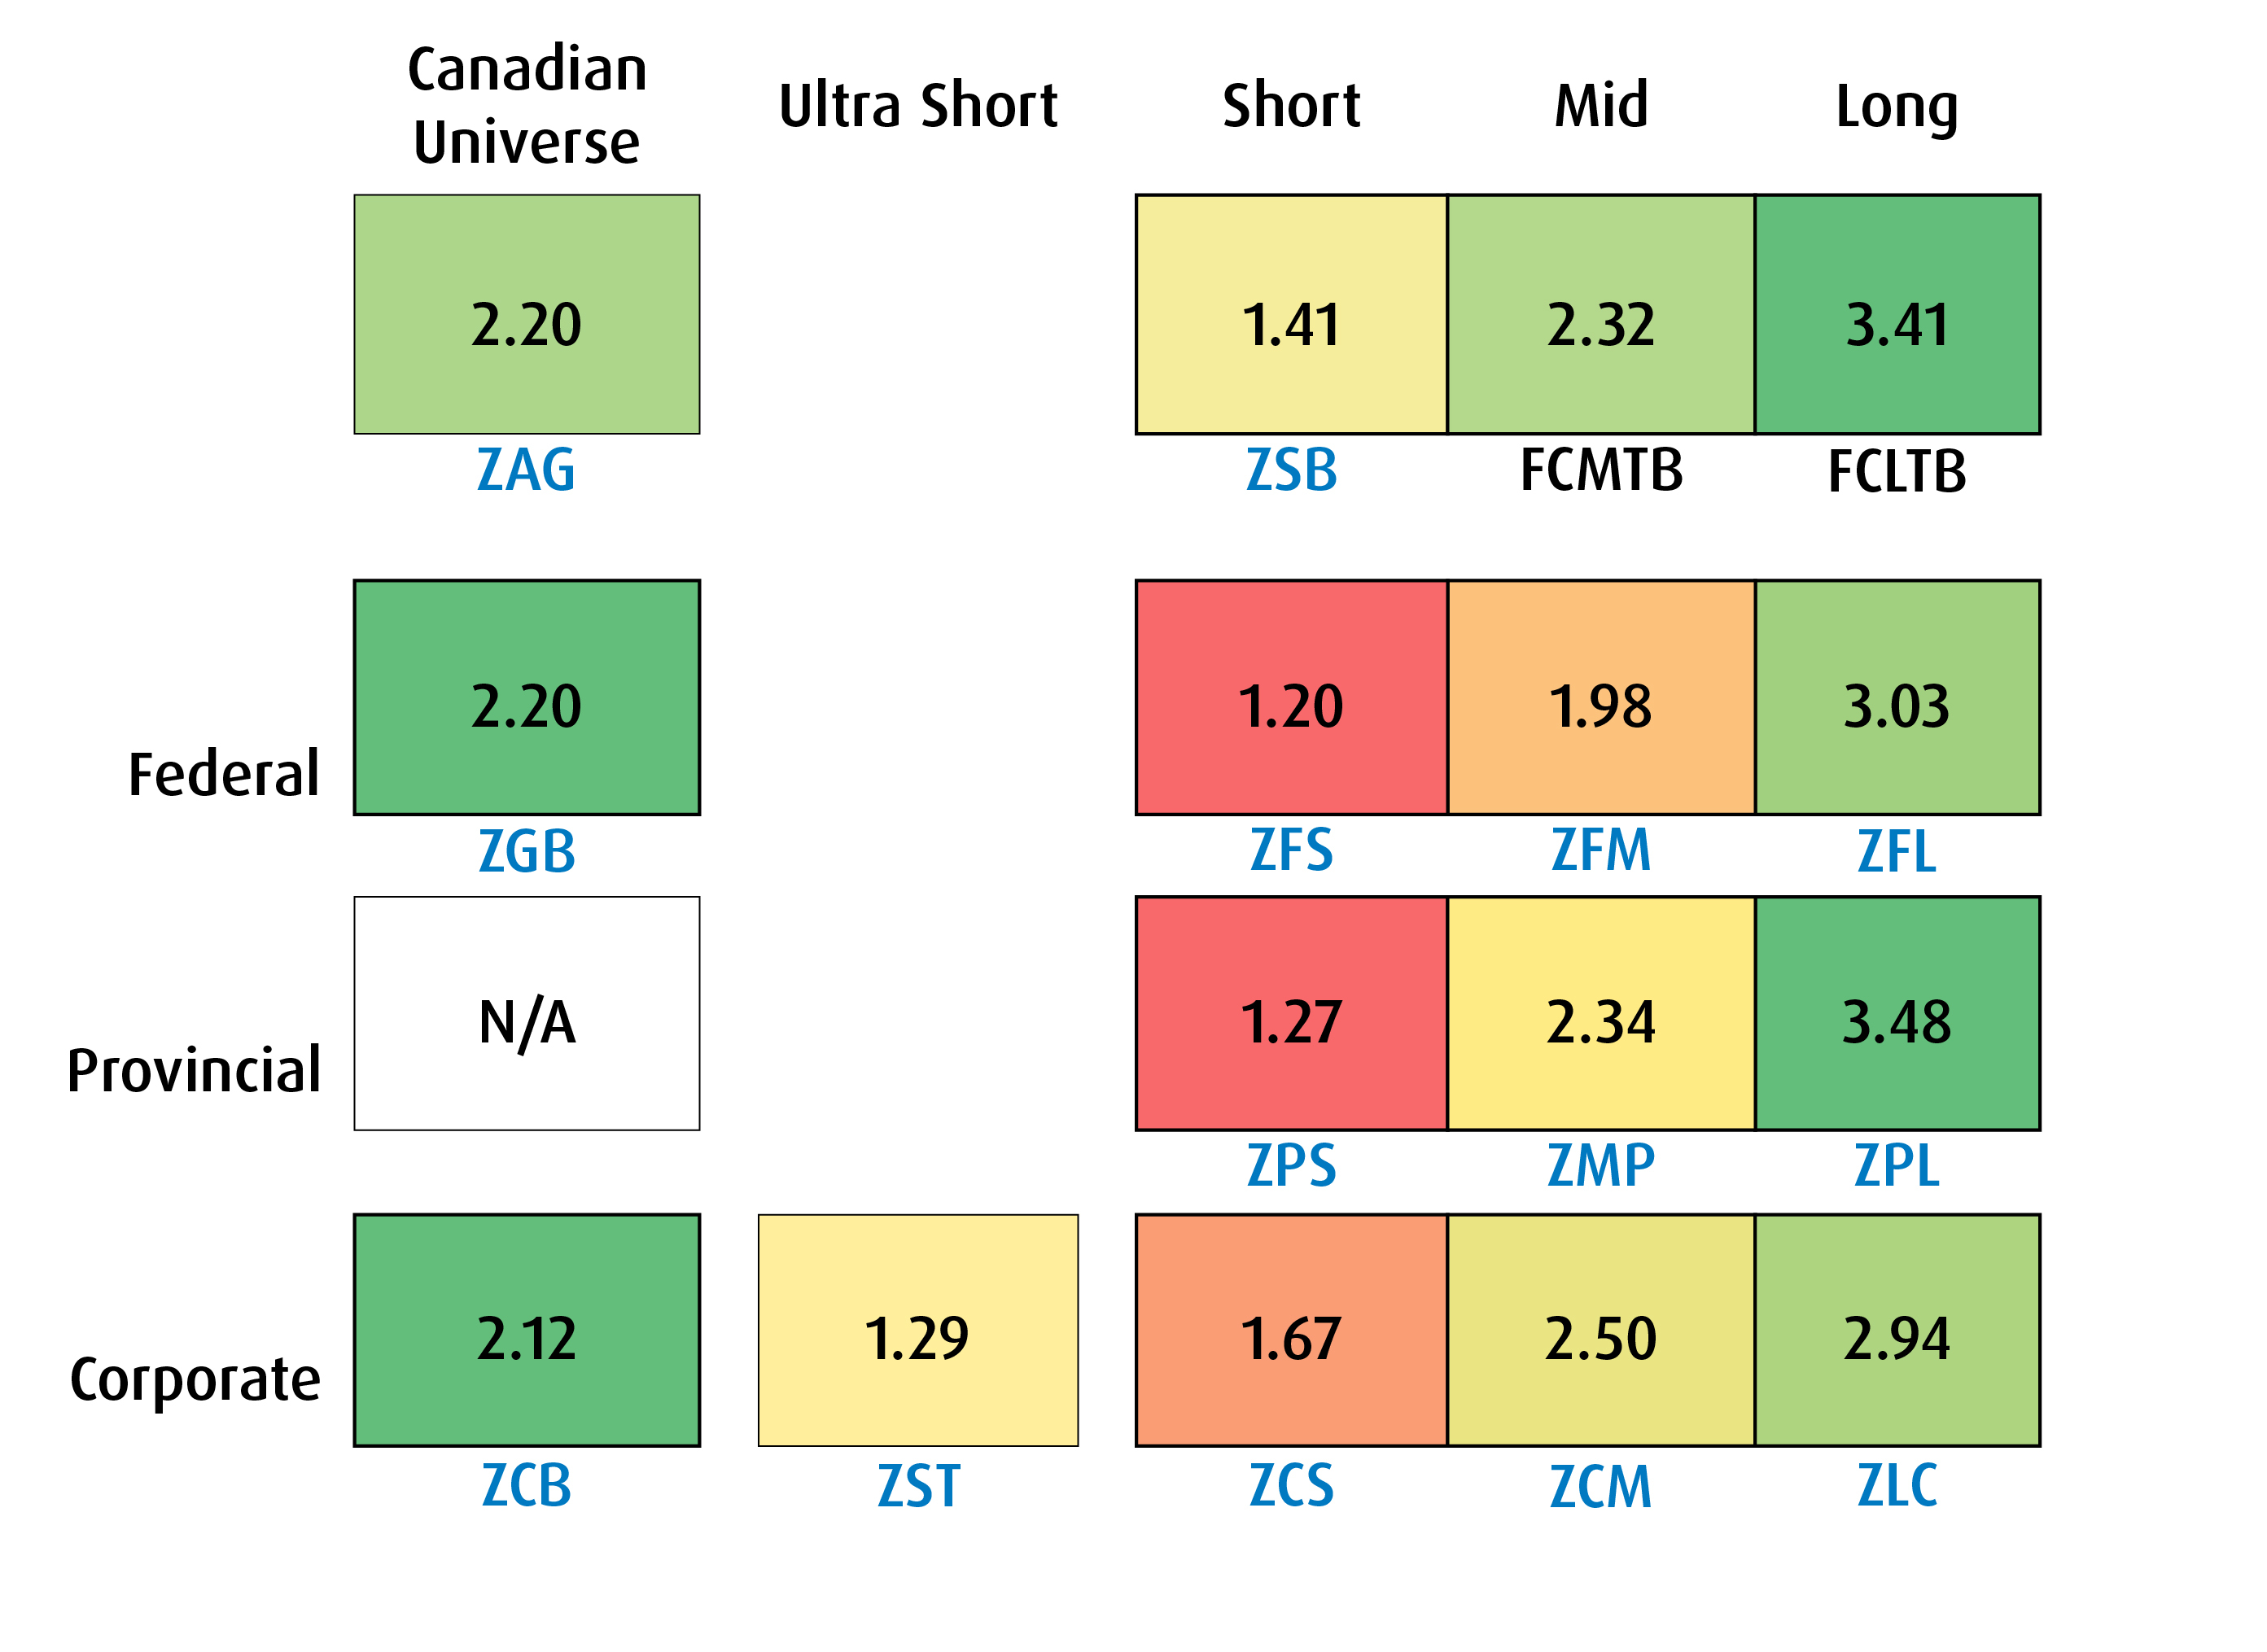
Year to date (YTD), Canadian fixed income returned +2.2% in the first half, with performance led by long duration maturities.
Canadian yields rose across the curve, with the sharpest pressure in the 1- to 5-year area as geopolitical risk and energy-related inflation concerns pushed rates higher earlier in the year. However, the later Q2 decline in intermediate and long yields helped longer-duration bonds recover, leaving long and mid-term exposures ahead of short-term bonds by June 30.
Geopolitical risk was a major driver of fixed income volatility in 2026, with the Iran conflict and related oil supply shock contributing to higher energy prices, renewed inflation pressure, and tighter financial conditions through higher bond yields.
Canadian Fixed Income Market, Duration and Credit Total Returns (YTD, %)
Over the past 12 months, Canadian fixed income returned +3.4%, with performance led by intermediate term and corporate bonds.
Credit outperformed government bonds overall, with mid-term credit the strongest performer for the period.
Over the one-year period, the Canadian yield curve experienced an upward shift that weighed most heavily on long-duration federal bonds. Shorter-term bonds and intermediate credit held up better, with mid-term corporate credit the strongest-performing sector. Long federal bonds materially lagged as duration sensitivity overwhelmed the benefit from higher yields.
Canadian Fixed Income Market, Duration and Credit Total Returns (1-Yr, %)
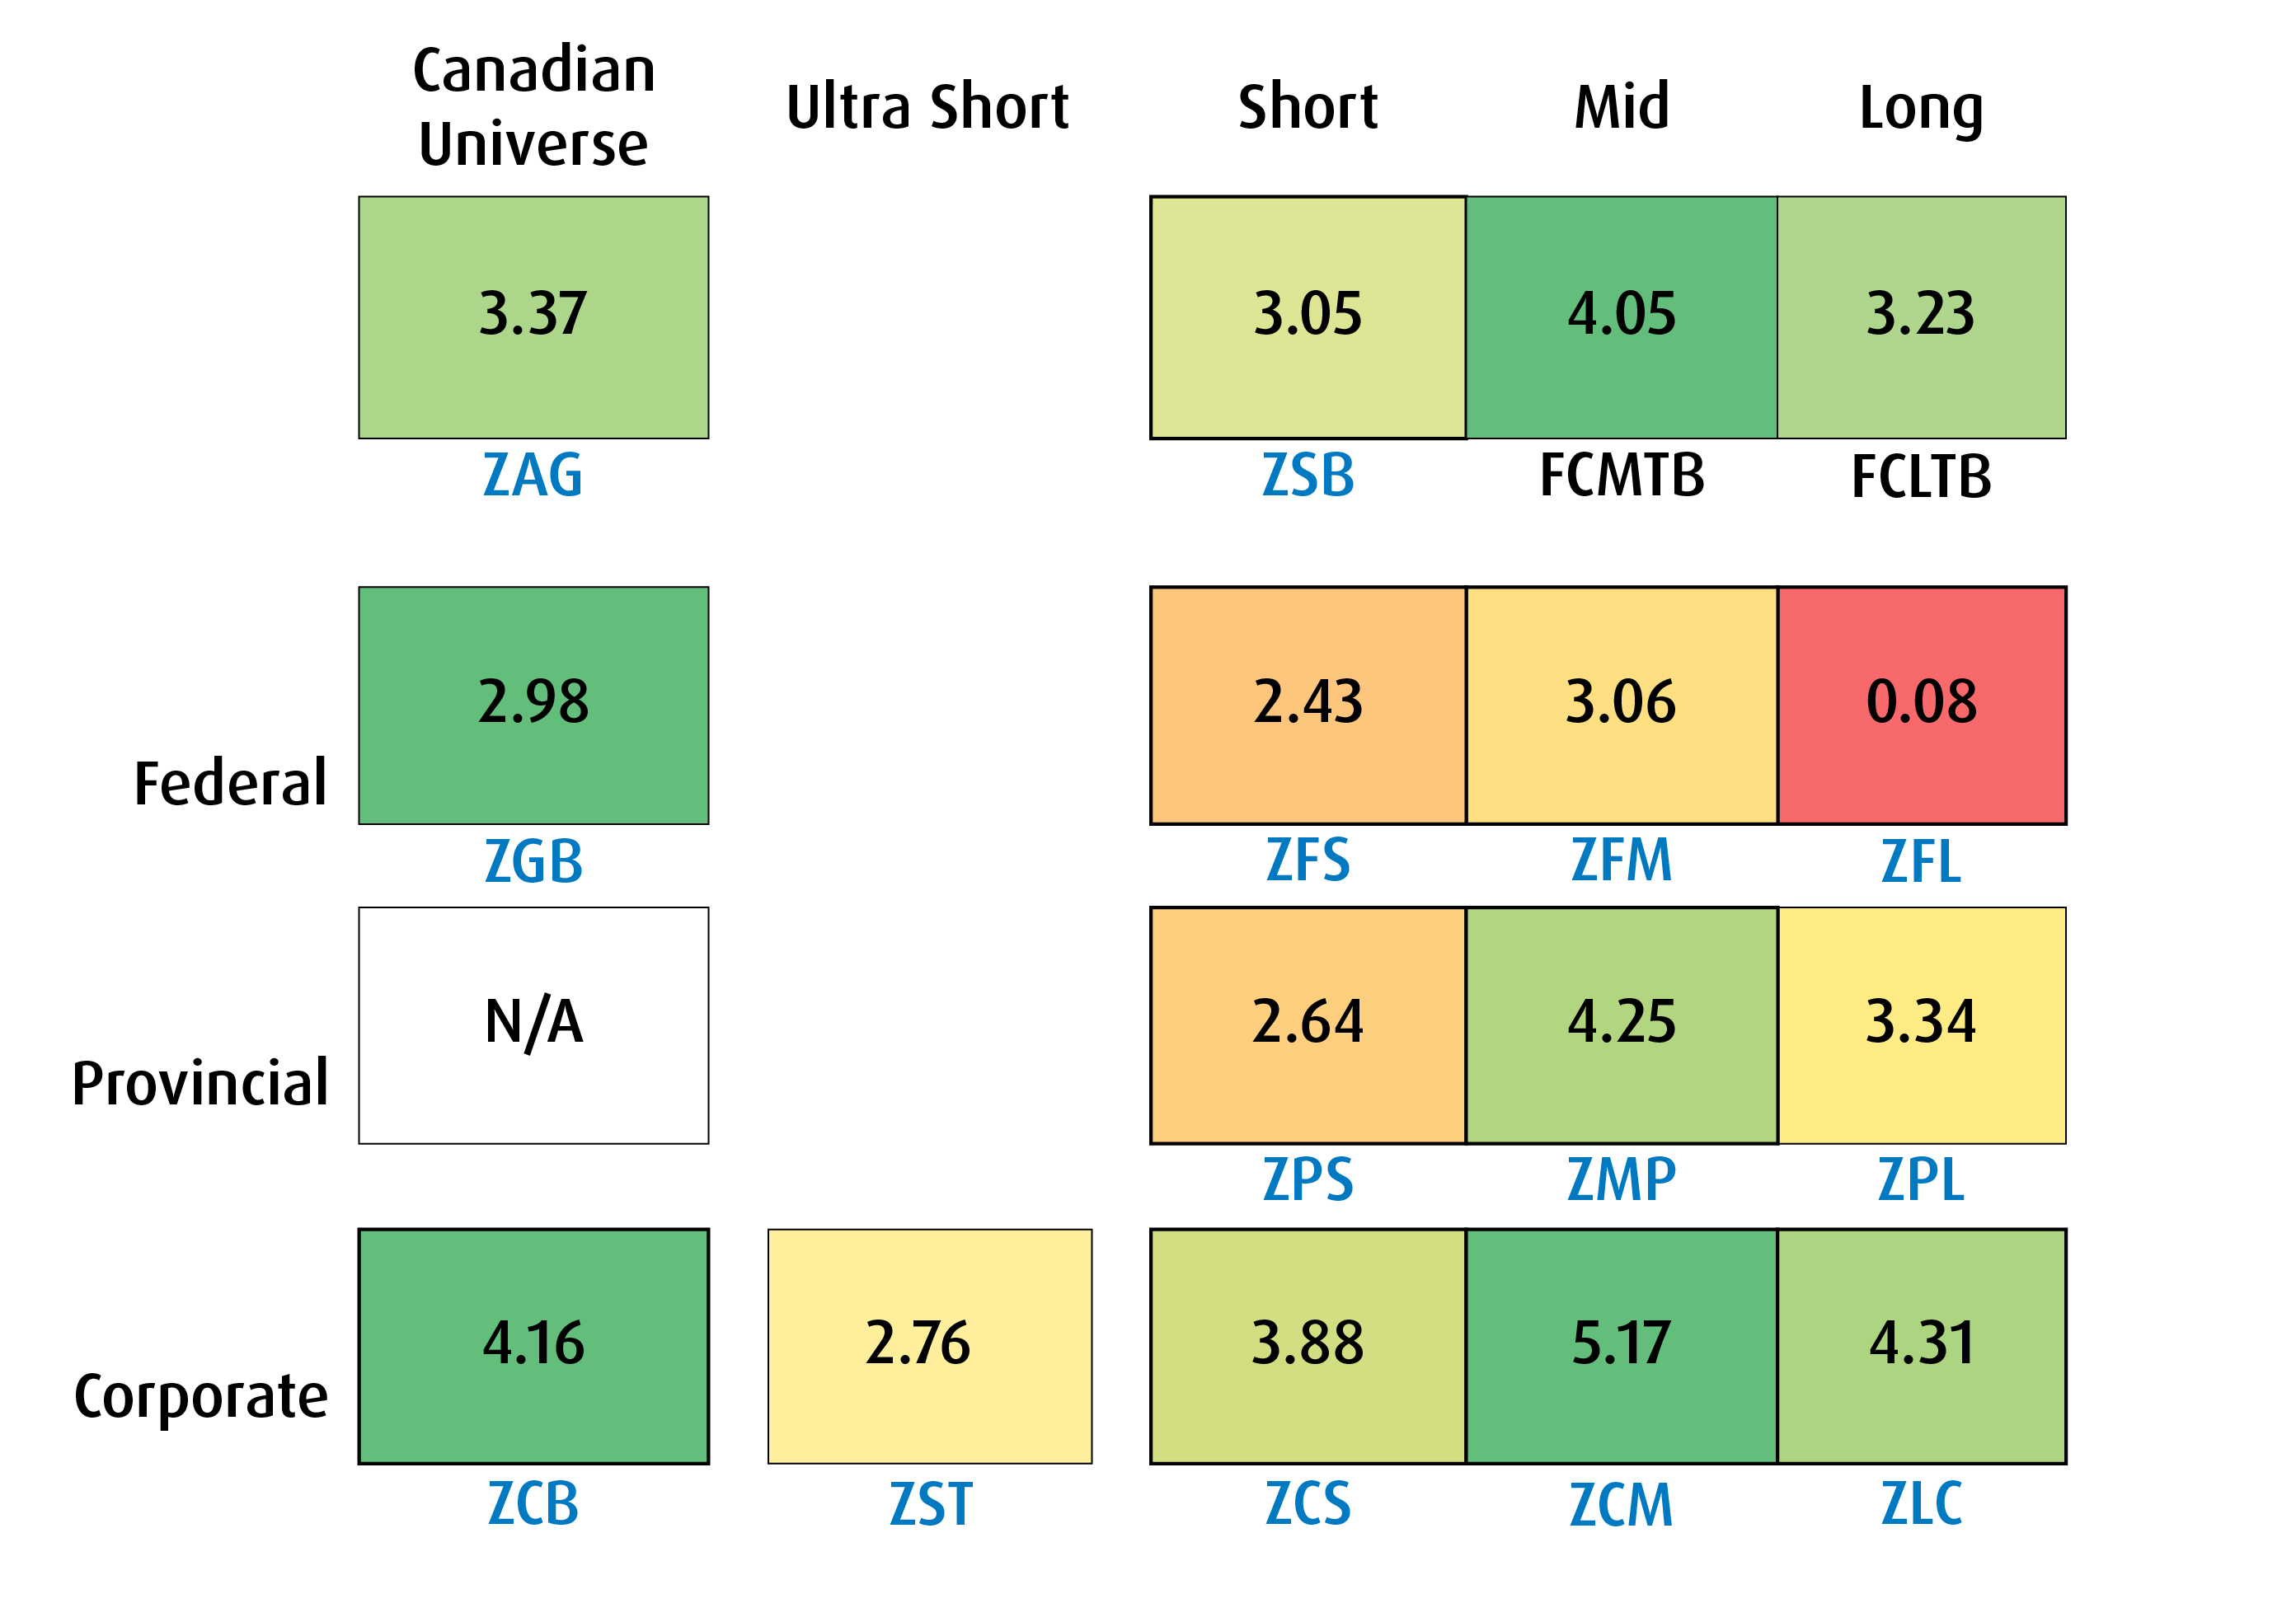
FCMTB = FTSE Canada Mid Term Bond Index. FCLTB = FTSE Canada Long Term Bond Index. Past performance is not indicative of future results.
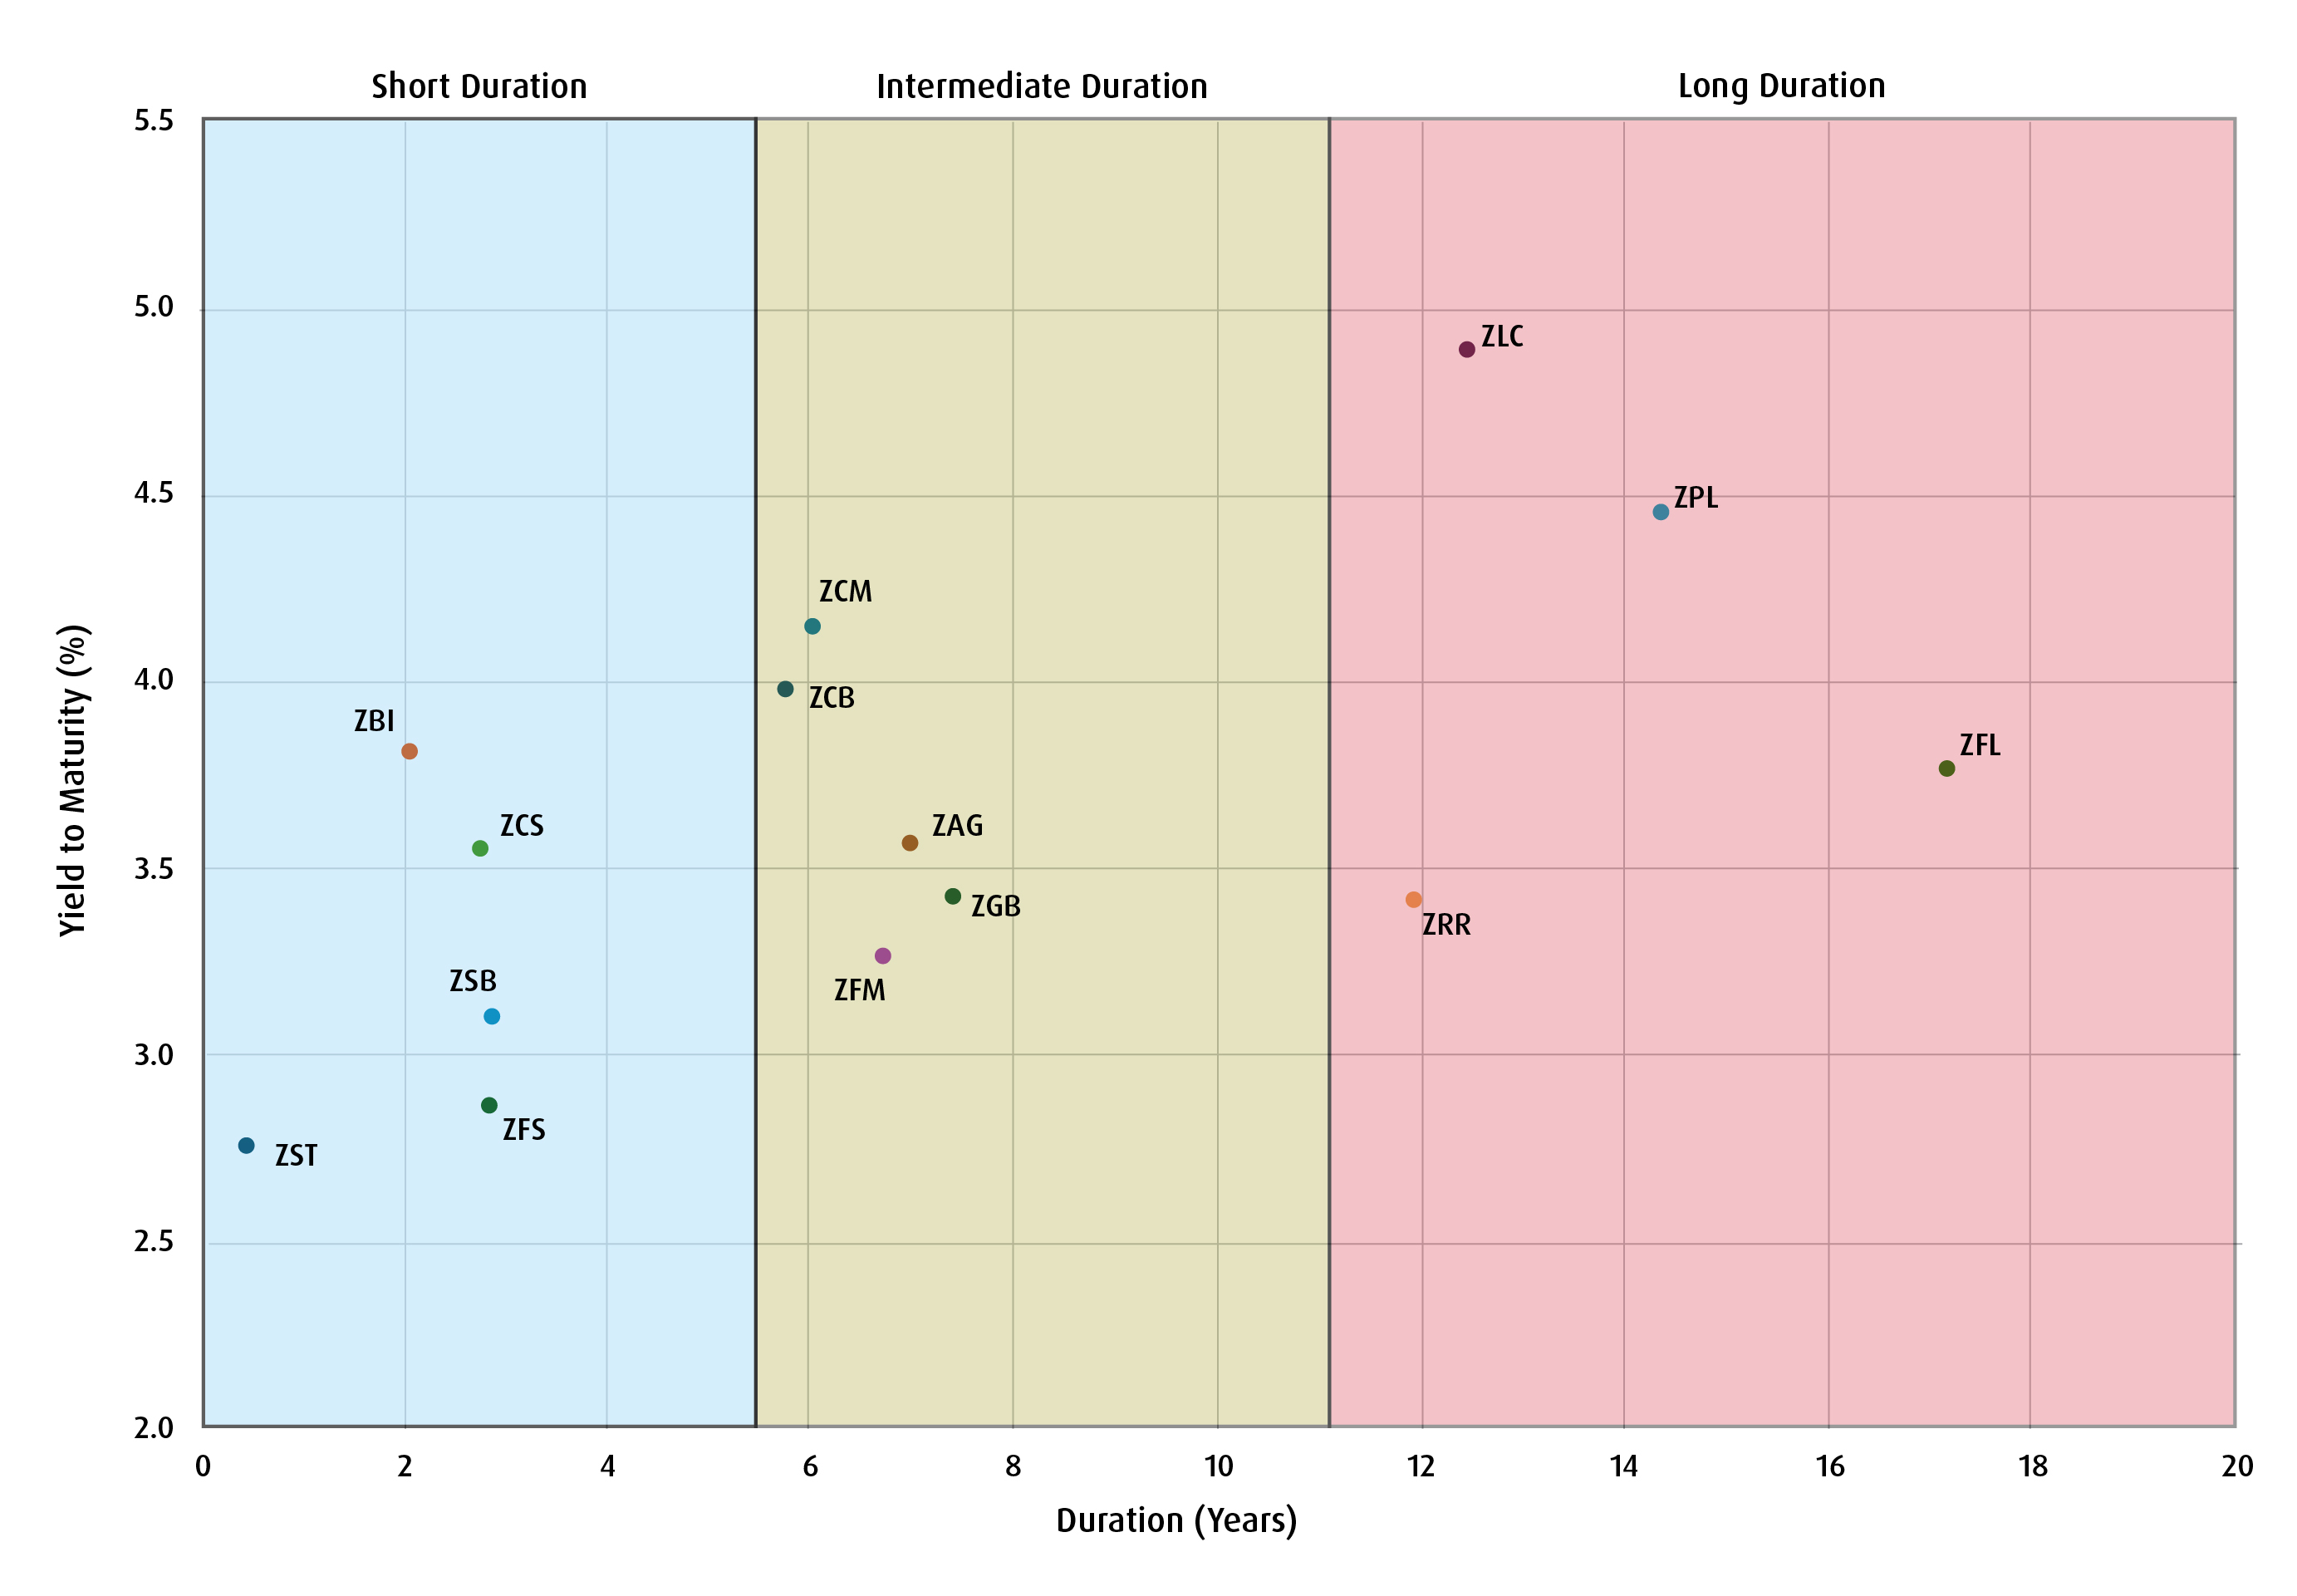
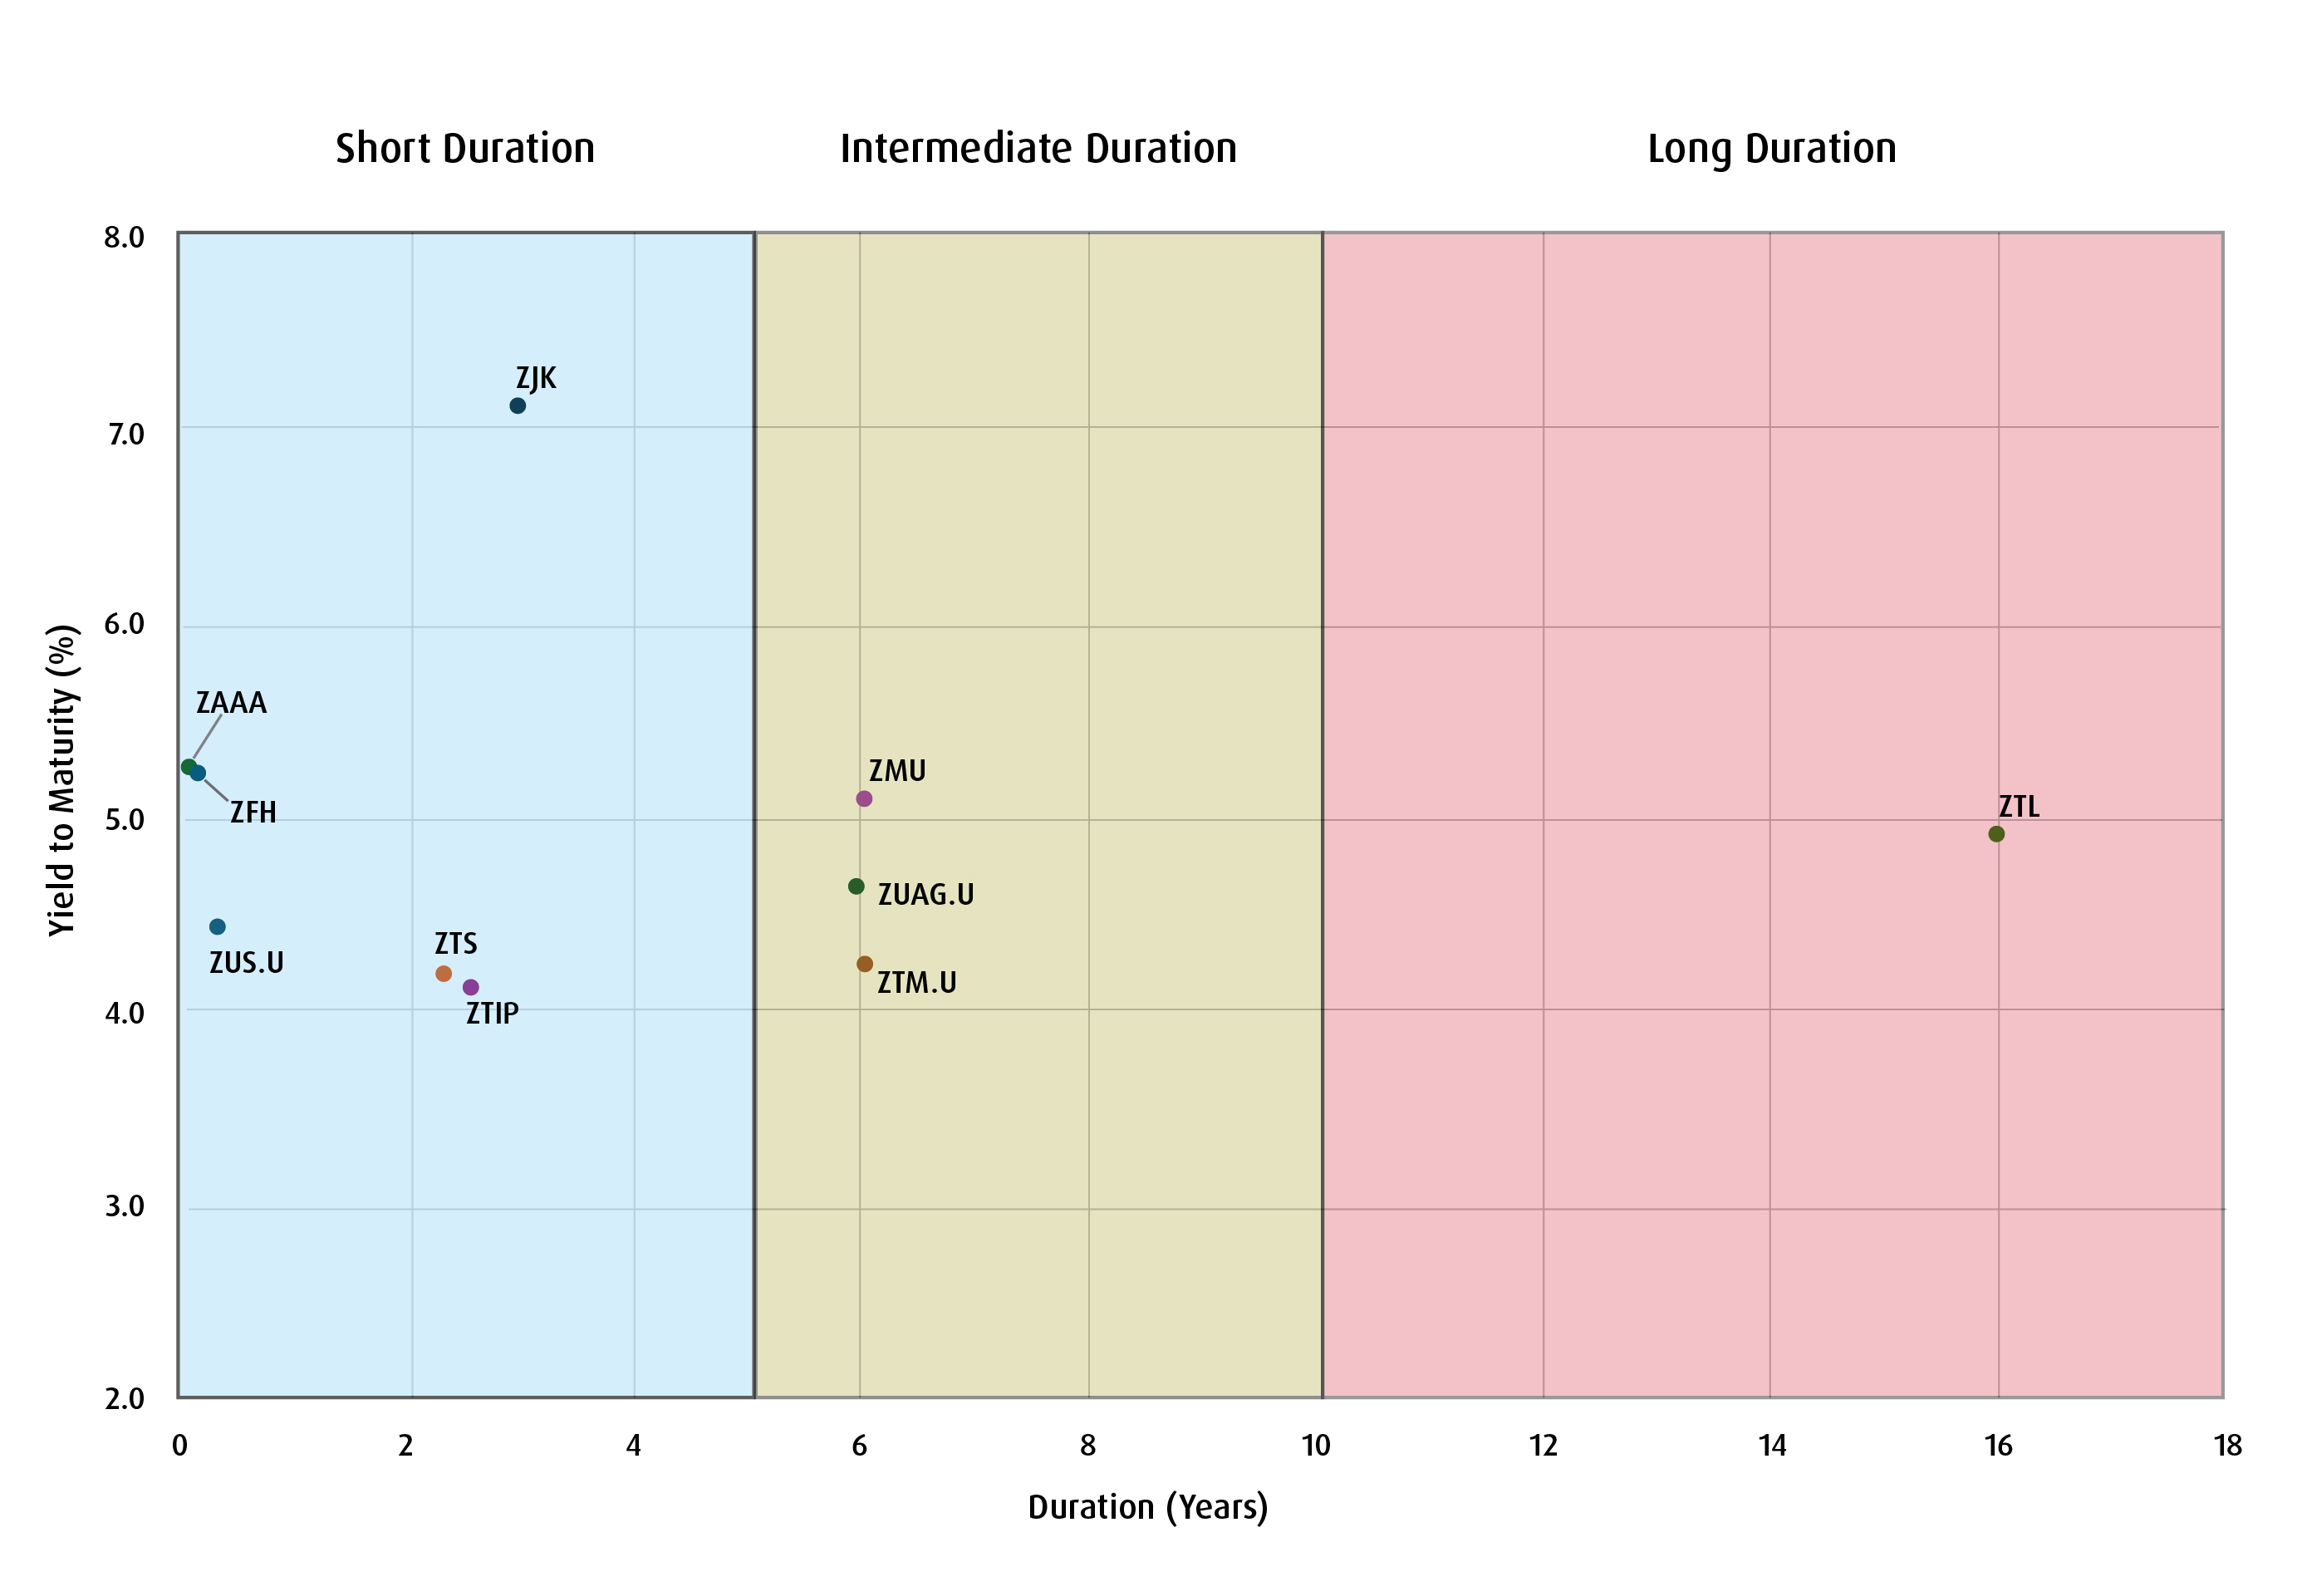
Here is a look at BMO Fixed Income ETFs by Duration and yield to maturity (YTM). Provided for illustrative purposes, these BMO ETFs demonstrate exposure across various fixed income segments. Blue shaded area = short duration (1 to 5 years). Green shaded area = intermediate duration (5 to 10 years). Orange shaded area = Long duration (10-years+).
Yield to maturity is not a measure of future performance and is based on market conditions as of June 30, 2026.
Canadian Fixed Income ETFs: Yield to Maturity vs. Duration
U.S. Fixed Income ETFs: Yield to Maturity vs. Duration
The first half of 2026 is a useful reminder that fixed income is not a static trade. Duration provided the strongest lift as intermediate- and long-term yields declined late in the second quarter, while credit — particularly mid-term corporate bonds — proved more resilient over the full 12-month period.
Performance
Fund name |
Ticker |
Year-To-Date |
1-Month |
3-Month |
6-Month |
1-Year |
3-Year |
5-Year |
10-Year |
Since Inception |
Inception Date |
2.20% |
0.49% |
2.00% |
2.20% |
3.37% |
4.34% |
0.71% |
1.61% |
2.88% |
2010-01-19 |
||
1.67% |
0.36% |
1.48% |
1.67% |
3.88% |
6.14% |
2.97% |
2.81% |
3.02% |
2009-10-20 |
||
-0.38% |
-0.03% |
0.66% |
-0.38% |
2.45% |
4.45% |
-0.13% |
1.78% |
2.43% |
2013-03-20 |
||
1.29% |
0.23% |
0.72% |
1.29% |
2.76% |
4.18% |
3.23% |
2.48% |
2.22% |
2011-01-28 |
||
2.12% |
0.37% |
2.07% |
2.12% |
4.16% |
6.04% |
2.14% |
— |
2.99% |
2018-03-02 |
||
5.11% |
3.06% |
4.39% |
5.11% |
9.98% |
10.80% |
6.34% |
— |
5.60% |
2017-10-04 |
||
2.50% |
0.57% |
2.29% |
2.50% |
5.17% |
7.10% |
2.47% |
3.04% |
4.21% |
2010-01-19 |
||
3.03% |
0.72% |
2.74% |
3.03% |
0.08% |
-0.55% |
-4.21% |
-1.49% |
1.96% |
2010-05-19 |
||
2.20% |
0.53% |
1.98% |
2.20% |
2.98% |
3.63% |
0.11% |
— |
1.62% |
2018-03-02 |
||
1.20% |
0.34% |
0.98% |
1.20% |
2.43% |
4.07% |
1.57% |
1.36% |
1.70% |
2009-10-20 |
||
2.34% |
0.72% |
2.02% |
2.34% |
4.25% |
5.25% |
1.37% |
1.85% |
2.61% |
2013-03-19 |
||
1.98% |
0.73% |
1.62% |
1.98% |
3.06% |
3.86% |
0.19% |
0.69% |
2.47% |
2009-05-29 |
||
1.27% |
0.36% |
1.06% |
1.27% |
2.64% |
4.47% |
1.77% |
1.71% |
2.12% |
2009-10-20 |
||
3.48% |
0.46% |
3.74% |
3.48% |
3.34% |
2.14% |
-2.24% |
0.48% |
2.07% |
2013-03-19 |
||
2.94% |
0.22% |
3.31% |
2.94% |
4.31% |
5.24% |
0.63% |
2.46% |
4.80% |
2010-01-19 |
||
2.42% |
0.34% |
3.70% |
2.42% |
6.19% |
9.39% |
6.95% |
5.77% |
5.37% |
2014-02-10 |
||
1.41% |
0.36% |
1.18% |
1.41% |
3.05% |
4.93% |
2.15% |
— |
2.39% |
2018-03-02 |
||
2.10% |
0.39% |
1.53% |
2.10% |
5.20% |
8.35% |
— |
— |
4.20% |
2022-02-07 |
||
4.81% |
0.80% |
3.66% |
4.81% |
4.03% |
3.35% |
-0.21% |
1.08% |
2.73% |
2010-05-19 |
||
3.64% |
2.92% |
2.13% |
3.64% |
6.73% |
6.46% |
4.01% |
— |
2.46% |
2017-02-21 |
||
4.23% |
4.12% |
2.91% |
4.23% |
6.83% |
0.63% |
-4.18% |
— |
-0.08% |
2017-02-21 |
||
1.83% |
0.29% |
1.01% |
1.83% |
4.13% |
4.93% |
3.56% |
— |
2.82% |
2019-02-12 |
||
5.64% |
3.28% |
3.47% |
5.64% |
9.33% |
— |
— |
— |
7.36% |
2025-04-30 |
||
5.07% |
2.53% |
2.67% |
5.07% |
7.85% |
7.50% |
6.02% |
— |
5.59% |
2021-01-20 |
||
0.80% |
0.25% |
0.78% |
0.80% |
3.88% |
4.04% |
— |
— |
3.30% |
2023-01-23 |
||
-0.13% |
0.18% |
0.04% |
-0.13% |
2.40% |
3.41% |
-0.51% |
— |
1.28% |
2017-02-21 |
Source: Bloomberg, as of June 30, 2026. Performance is shown net of fees, in the currency of the respective share class with dividends reinvested. Past performance is not indicative of future results.
1 FTSE Canada Universe Bond Index.
2 FTSE Canada Mid Term Bond Index, FTSE Canada Long Term Bond Index, as of June 30, 2026.
Disclaimers
Advisor Use Only.
This article is for information purposes. The information contained herein is not, and should not be construed as, investment, tax or legal advice to any party. Particular investments and/or trading strategies should be evaluated relative to the individual’s investment objectives and professional advice should be obtained with respect to any circumstance.
The viewpoints expressed by the author represent their assessment of the markets at the time of publication. Those views are subject to change without notice at any time. The information provided herein does not constitute a solicitation of an offer to buy, or an offer to sell securities nor should the information be relied upon as investment advice. Past performance is no guarantee of future results. This communication is intended for informational purposes only.
BMO ETFs are not in any way sponsored, endorsed, sold or promoted by FTSE Global Debt Capital Markets Inc. (FGDCM), FTSE International Limited (FTSE), Frank Russell Company (Frank Russell), FTSE Fixed Income LLC (FTSE FI) or the London Stock Exchange Group companies (together with FGDCM, FTSE, Frank Russell and FTSE FI, the Licensor Parties). The Licensor Parties make no claim, prediction, warranty or representation whatsoever, expressly or impliedly, either as to (i) the results to be obtained from the use of the FTSE BMO ETF Indices, (ii) the figure at which any of the FTSE BMO ETF Indices stands at any particular time on any particular day or otherwise, or (iii) the suitability of an Underlying Index for the particular purpose to which is it being put in connection with the FTSE BMO ETFs. Each of the FTSE BMO ETF Indices is compiled and calculated by FGDCM of FTSE and all copyright in any of the FTSE BMO ETF Indices values and constituent lists vests in FGDCM or FTSE, respectively. The Licensor Parties shall not be liable (whether in negligence or otherwise) to any person for any error in any of the FTSE BMO ETF Indices and the Licensor Parties shall not be under any obligation to advise any person of any error therein. FTSE® is a trade mark of the London Stock Exchange Group companies and is used under licence.
CLOs are floating- or fixed-rate debt securities issued in different tranches, with varying degrees of risk, by trusts or other special purpose vehicles (“CLO Issuers”) and backed by an underlying portfolio consisting primarily of below investment grade corporate loans. The BMO ETF pursues its investment objective by investing, under normal circumstances, at least 85% of its net assets in CLOs that, at the time of purchase, are rated AAA or the equivalent by a nationally recognized statistical rating organization.
AAA herein refers to the order of payments, should there be any defaults, and does not represent the ratings of the underlying loans within the CLO. If there are loan defaults or the CLO Issuer’s collateral otherwise underperforms, scheduled payments to senior tranches take precedence over those of mezzanine tranches (a tranche or tranches subordinated to the senior tranche), and scheduled payments to mezzanine tranches take precedence over those to subordinated/equity tranches. The riskiest portion is the “Equity” tranche, which bears the first losses and is expected to bear all or the bulk of defaults from the corporate loans held by the CLO Issuer serves to protect the other, more senior tranches from default.
Distribution yields are calculated by using the most recent regular distribution, or expected distribution, (which may be based on income, dividends, return of capital, or capital gains, as applicable) and excluding additional year end distributions, and special reinvested distributions annualized for frequency, divided by current net asset value (NAV). The yield calculation does not include reinvested distributions.
Distributions are not guaranteed, may fluctuate and are subject to change and/or elimination. Distribution rates may change without notice (up or down) depending on market conditions and NAV fluctuations. The payment of distributions should not be confused with the BMO ETF’s performance, rate of return or yield. If distributions paid by a BMO ETF are greater than the performance of the investment fund, your original investment will shrink. Distributions paid as a result of capital gains realized by a BMO ETF, and income and dividends earned by a BMO ETF, are taxable in your hands in the year they are paid. Your adjusted cost base will be reduced by the amount of any returns of capital. If your adjusted cost base goes below zero, you will have to pay capital gains tax on the amount below zero.
Cash distributions, if any, on units of a BMO ETF (other than accumulating units or units subject to a distribution reinvestment plan) are expected to be paid primarily out of dividends or distributions, and other income or gains, received by the BMO ETF less the expenses of the BMO ETF, but may also consist of non-taxable amounts including returns of capital, which may be paid in the manager’s sole discretion. To the extent that the expenses of a BMO ETF exceed the income generated by such BMO ETF in any given month, quarter, or year, as the case may be, it is not expected that a monthly, quarterly, or annual distribution will be paid. Distributions, if any, in respect of the accumulating units of BMO Short Corporate Bond Index ETF, BMO Short Federal Bond Index ETF, BMO Short Provincial Bond Index ETF, BMO Ultra Short-Term Bond ETF and BMO Ultra Short-Term US Bond ETF will be automatically reinvested in additional accumulating units of the applicable BMO ETF. Following each distribution, the number of accumulating units of the applicable BMO ETF will be immediately consolidated so that the number of outstanding accumulating units of the applicable BMO ETF will be the same as the number of outstanding accumulating units before the distribution. Non-resident unitholders may have the number of securities reduced due to withholding tax. Certain BMO ETFs have adopted a distribution reinvestment plan, which provides that a unitholder may elect to automatically reinvest all cash distributions paid on units held by that unitholder in additional units of the applicable BMO ETF in accordance with the terms of the distribution reinvestment plan. For further information, see the distribution policy in the BMO ETFs’ prospectus.
Commissions, management fees and expenses all may be associated with investments in exchange-traded funds. Please read the ETF Facts or prospectus of the BMO ETFs before investing. The indicated rates of return are the historical annual compounded total returns including changes in unit value and reinvestment of all dividends or distributions and do not take into account sales, redemption, distribution or optional charges or income taxes payable by any unitholder that would have reduced returns. Exchange-traded funds are not guaranteed, their values change frequently and past performance may not be repeated.
For a summary of the risks of an investment in the BMO ETFs, please see the specific risks set out in the BMO ETF’s prospectus. BMO ETFs trade like stocks, fluctuate in market value and may trade at a discount to their net asset value, which may increase the risk of loss. Distributions are not guaranteed and are subject to change and/or elimination.
This article may contain links to other sites that BMO Global Asset Management (BMO GAM) does not own or operate. Any content from or links to a third-party website are not reviewed or endorsed by BMO GAM. Investors use any external websites or third-party content at their own risk. Accordingly, BMO GAM disclaims any responsibility for them.
BMO ETFs are managed by BMO Asset Management Inc., an investment fund manager, a portfolio manager, and a separate legal entity from Bank of Montreal.
BMO Global Asset Management is a brand name under which BMO Asset Management Inc. and BMO Investments Inc. operate.
“BMO (M-bar roundel symbol)” is a registered trademark of Bank of Montreal, used under licence.