Rebalance your emerging-markets exposure with a bigger commodities tilt
Technology now dominates broad emerging market (EM) allocations. For clients seeking a stronger commodity allocation, pairing ZEM with ZLAT can broaden the sector mix while retaining broad EM participation.


Latin America is home to over 650 million people and some of the world’s largest suppliers of the metals, energy and food the global economy runs on. Yet despite its scale and economic importance, the region represents only a small portion of most global equity allocations.
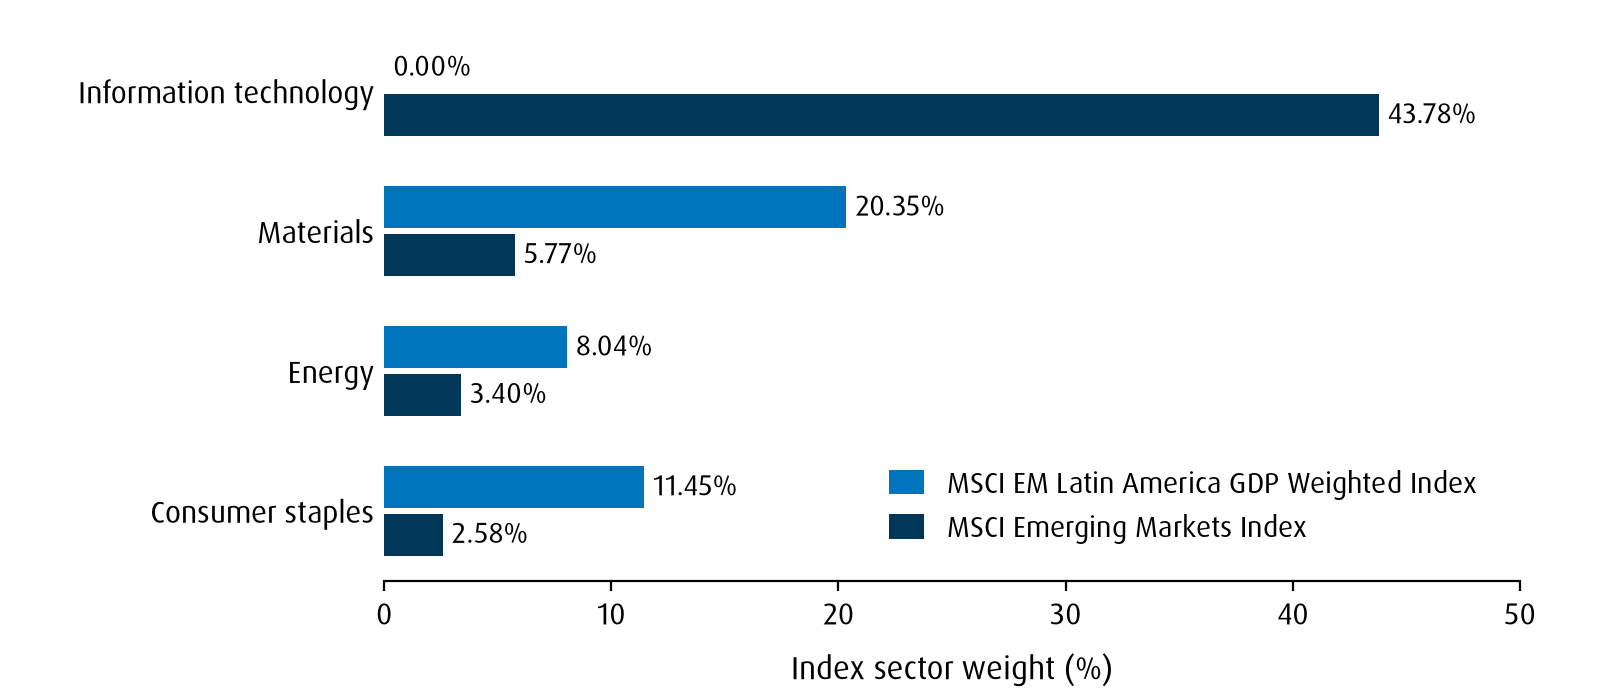
For clients who want more participation in the commodity cycle, consider shifting part of an existing broad EM allocation into Latin America. Broad EM remains useful, but its composition deserves attention: information technology represented more than 40% of the MSCI Emerging Markets Index.¹
By contrast, the MSCI EM Latin America GDP Weighted Index holds no information technology exposure, while materials and energy combined represent just over 28%, compared with a little over 9% for the MSCI Emerging Markets Index.¹ That provides a concrete way to change the sector balance when technology exposure has become prominent across a client’s holdings — as we are seeing now.
The rationale centres on demand for energy, minerals and agricultural products, including the materials needed for electrification and digital infrastructure. Latin America offers what could be considered as more “torque” to that theme.
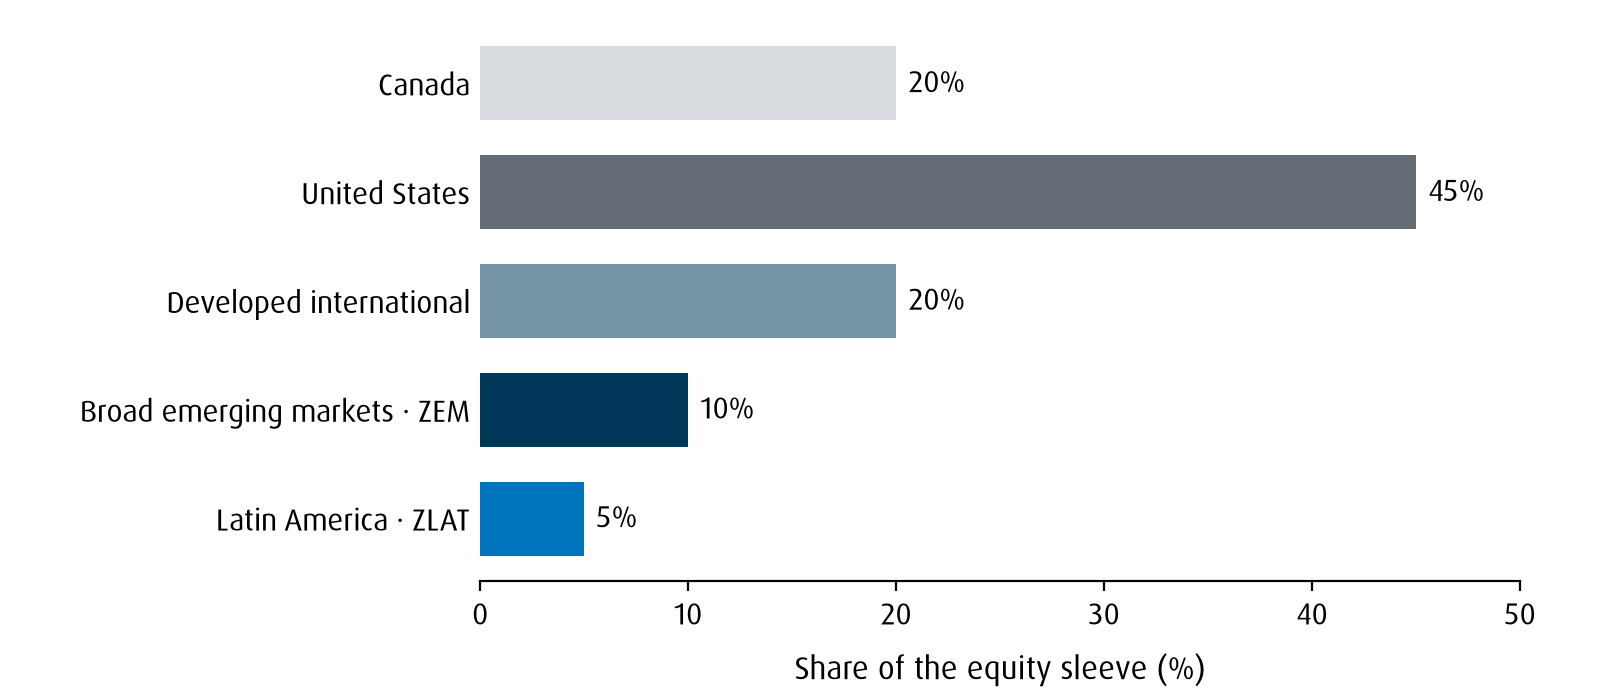
As a hypothetical portfolio construction exercise, let’s take an equity sleeve of 20% Canada, 45% U.S., 20% developed international and 15% EM. Split the EM component into 10% ZEM and 5% ZLAT. The regional position represents one-third of the EM sleeve and 5% of equities (not the whole balanced portfolio).
Instead of weighting countries only by equity-market size, ZLAT uses GDP to set country weights, adding meaningful participation in Colombia, Peru and Chile alongside Brazil and Mexico. Currency exposure is unhedged, and political developments can affect returns. However, we view both the fiscal and economic outlook of Latin America as constructive.
As a measure of due diligence, set a review date and allocation limits at implementation; reassess the position if the macro direction of commodities reverses or weakens or it exceeds the client’s risk profile.
Illustrative equity allocation
Sector exposures behind the trade
We favour using a dedicated Latin American allocation selectively alongside broad EM when a client wants greater commodity participation. Though it should be noted that a review of the combined portfolio should be undertaken before increasing the position: Canadian allocations, for example, may already carry overweighted resources exposure.
But for investors looking to rebalance into a less technology-reliant EM allocation, ZLAT offers that tilt.
Performance
Ticker |
Year-to-date |
1-month |
3-month |
6-month |
1-year |
3-year |
5-year |
10-year |
Since inception |
Inception date |
14.48% |
-10.04% |
-5.57% |
-0.03% |
12.26% |
21.45% |
8.62% |
8.24% |
6.46% |
Oct. 20, 2009 |
|
Returns are not available as there is less than one year’s performance data. |
October 6, 2026 |
|||||||||
Source: BMO Global Asset Management, as of October 30, 2026. Past performance is not indicative of future results.
1 MSCI, September 30, 2026.
Disclosure
For advisor use only. No portion of this material may be reproduced or distributed to retail clients.
This material is for information purposes only. The information contained herein is not, and should not be construed as investment, tax or legal advice to any party. Particular investments and/or trading strategies should be evaluated and professional advice should be obtained with respect to any circumstance.
Any statement that necessarily depends on future events may be a forward-looking statement. Forward-looking statements are not guarantees of performance. They involve risks, uncertainties and assumptions. Although such statements are based on assumptions that are believed to be reasonable, there can be no assurance that actual results will not differ materially from expectations. Investors are cautioned not to rely unduly on any forward-looking statements. In connection with any forward-looking statements, investors should carefully consider the areas of risk described in the most recent prospectus.
Index returns do not reflect transactions costs or the deduction of other fees and expenses and it is not possible to invest directly in an Index. Past performance is not indicative of future results.
The BMO ETFs referred to herein are not sponsored, endorsed, or promoted by MSCI Inc. (MSCI) and MSCI bears no liability with respect to the relevant BMO ETF or any index on which such BMO ETF is based. The relevant BMO ETF’s prospectus contains a more detailed description of the limited relationship MSCI has with BMO Asset Management Inc. and any related BMO ETFs.
Commissions, management fees and expenses all may be associated with investments in exchange-traded funds. Please read the ETF Facts or prospectus of the BMO ETF before investing. The indicated rates of return are the historical annual compounded total returns including changes in unit value and reinvestment of all dividends or distributions and do not take into account sales, redemption, distribution or optional charges or income taxes payable by any unitholder that would have reduced returns. Exchange-traded funds are not guaranteed, their values change frequently and past performance may not be repeated.
For a summary of the risks of an investment in the BMO ETFs, please see the specific risks set out in the ETF facts or prospectus. BMO ETFs trade. The BMO ETF trades like stocks, fluctuates in market value and may trade at a discount to its net asset value, which may increase the risk of loss. Distributions are not guaranteed and are subject to change and/or elimination.
BMO ETFs are managed by BMO Asset Management Inc., an investment fund manager, a portfolio manager, and a separate legal entity from Bank of Montreal. BMO Global Asset Management is a brand name under which BMO Asset Management Inc. and BMO Investments Inc. operate.
“BMO (M-bar roundel symbol)” is a registered trademark of Bank of Montreal, used under licence.
Publication Date: November 2026.