Adding Alpha Through Sector Investing: ETFs Represent the Optimal Tool for Tactical Rotation Strategies
Lower costs, high liquidity and tax efficiency are just three reasons why ETFs are elegant yet practical solutions for trading into (and out of) precise sector exposures. Daniel Stanley, Director, Institutional & Advisory ETF Distribution, BMO ETFs, makes the strong case that for discretionary portfolio managers, there is simply no better product out there.


There are 11 different stock market sectors according to the Global Industry Classification Standard (GICS) – energy, materials, industrials, utilities, healthcare, financials, consumer discretionary consumer staples, information technology, communication services, real estate. Sector investing means investing your money through the lens of these 11 GICS sectors.
Sectors can be thought of in relation to the economy; some are defensive, producing goods and services that are necessities, having inelastic demand. Food, medicine, and electricity, for example. These sectors often suffer less in a recession. Other sectors are cyclical, producing goods and services that increase or decrease in demand when the economy strengthens or weakens: gasoline, cars, semiconductors, vacations, and construction materials, for example. These are sectors that because of their elastic demand will do well in times of prosperity but suffer in a recession.
Generally speaking, sector investing can enhance portfolio diversification, reduce volatility, and give managers the ability to add alpha through rotation strategies.
Another important consideration is that sector trends tend to be global, providing additional information for investment managers to adapt portfolios across the economic cycle. It may be difficult to time geographic allocations, but sector or industry changes provide insightful trend information which can be distilled more broadly, providing more opportunities for portfolio manager to manage risk and return.
Why Use ETFs?
When it comes to sector investing, discretionary portfolio managers have a plethora of tools at their disposal. Searching for individual securities in sectors is both costly and time consuming so that leaves sector based mutual funds and ETFs as options. Both sector funds and ETFs have exploded in growth in the last 20 years, BMO ETFs alone having 37 sector-specific ETFs, each with over $100 million in assets under management.1 But only ETFs give portfolio managers the ability to block trade quickly and effectively on an intraday basis with a single trade.
ETFs usually track an index, which is sometimes referred to as passive exposure. In fact, the index changes all the tie, like a giant weathervane following investor capital as it flows from one sector to another through an economy. Unlike an active manager, an index has no emotion or personal bias, and the ETF provides precise data that can be used to analyze the relative attractiveness of one sector compared to another.
For discretionary portfolio managers in family offices or investment counselling firms there is simply no better tool than a sector ETF; they are low cost, precise, tax efficient, liquid and supported by years of risk and return data that is unobstructed by the whims of an investment manager’s style.
When weighing ETF allocation decisions, here are two other product characteristics to take into consideration:
Canadian vs. U.S. Sector Investing
While Canada has a mature marketplace for sectors such as Financials, Energy and Resources, it lacks exposure to sectors like Health Care and Technology, and often domestic sectors are dominated by one or two corporations. US sector ETFs like the BMO Equal Weight US Health Care Hedged to CAD Index ETF (ticker: ZUH) and the BMO Nasdaq 100 Equity Hedged to CAD Index ETF (ticker: ZQQ), help fill those gaps.
Equal Weight or Market Cap?
Equal Weight Sector ETFs have equal percentage exposures to each of the underlying securities in the sector. This has the effect of reducing concentration risk, improving sector diversification, and a common biproduct is a higher yield. Market cap weighted sector ETFs may concentrate the exposure in the underlying securities with the biggest market capitalizations.
Sector Road Map
The risk to sector investing is picking a sector that is negatively impacted by the business cycle. Investing in cyclical sectors just before a downturn or investing in defensive sectors just before an upturn are two examples. Understanding how different sectors behave at different points in the cycle is an important consideration to sector investing. Markets are forward looking, and some sectors tend to lead the broader economic cycle.
The chart below sums up the various points in a conventional cycle and the respective best-performing sectors in each stage:
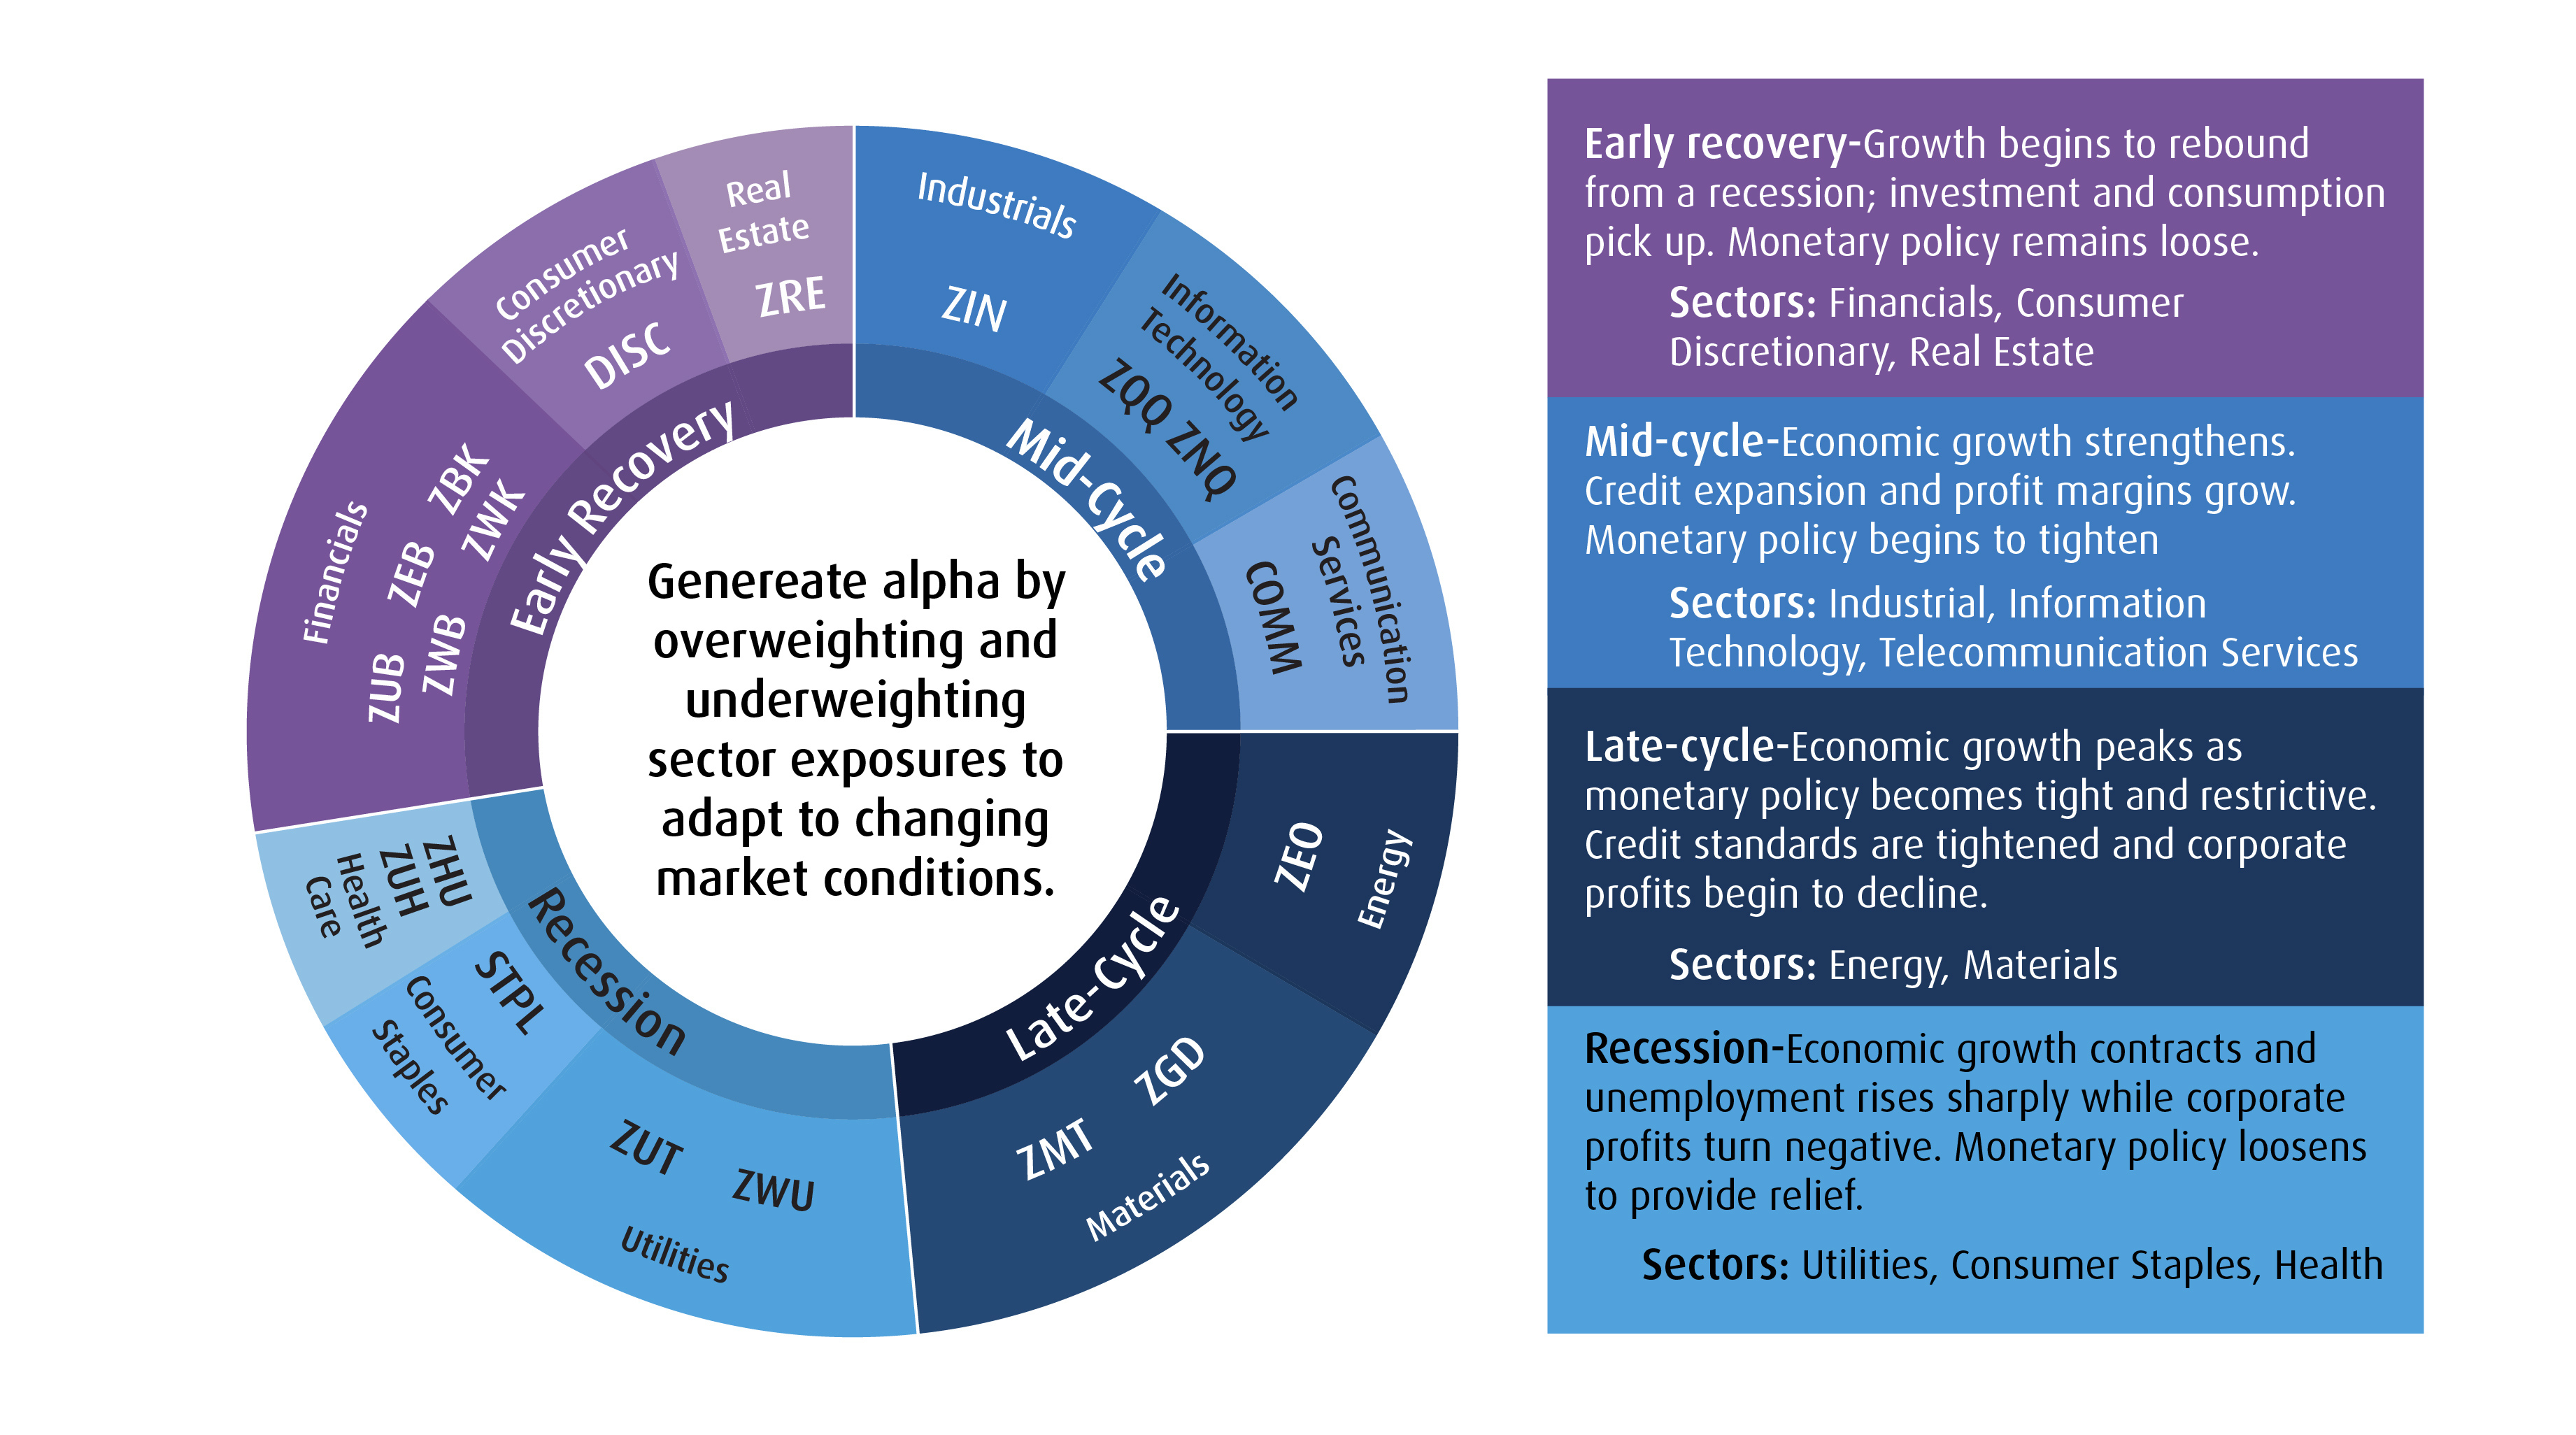
BMO Global Asset Management has strategically built our suite across key exposures, ensuring investors can position their portfolios to benefit from both domestic and global growth. Different sectors have different return drivers, and we have thoughtfully constructed our strategies to take advantage of each of these opportunities.
The above diagram is a handy tool that will help managers make sector choices that will benefit from expected economic and business conditions. It’s also a tool that can be used to identify anomalies between expectations and reality.
Take the Technology sector, for example. If you assume that we’re on the cusp of a recession, or “Late Cycle” on the chart, then one would not expect ZQQ to be up 30% year to date.2 Technology is a “Mid Cycle” sector performer and should be entering a period of weakness. Instead, fueled by an AI-driven multiple expansion, ZQQ is having an extremely bullish first half of the year.
The above diagram also notes that the Consumer Staples and Health Care sectors do well in a recession, so the fact that the BMO Global Consumer Staples Hedged to CAD Index ETF (ticker: STPL) is up just 1%3 year to date and the BMO Equal Weight US Health Care Hedged to CAD Index ETF (ticker: ZUH) is down over 0.5% year to date4, reinforces the idea that while close, we are not yet in a recession.
Further reinforcing the belief that we are late in the current cycle is the performance of materials sector ETFs like the BMO Equal Weight Global Gold Index ETF (ticker: ZGD), which is up an impressive 4.5% year to date.5
Current Sector Performance Overview
Given that most businesses rely on loans to produce goods and services, it follows that interest rates will be an important driver of the business cycle. Interest rates in general rise at the beginning of a cycle and peak just before a recession, the latter sounding a lot like our current situation. How have the markets and various sectors held up in this environment?
According to Ned Davis Research (NDR) in a June 15 report entitled, “A Lopsided Bull Market”, while the S&P500 has gained more than 20% from its October 2022 lows, “sector leadership has been more narrow than usual.” The report notes the current rally has been dominated by Technology, which has been responsible for 10.3 percentage points of the 20% gain for the S&P500 — the highest contribution for any single sector on record. It’s not hard to see why this is a concern for the broader market as a whole. If there aren’t enough legs to stand on, it is at risk of falling.
“The most economically sensitive sectors have severely lagged their average bull market performances this cycle,” the NDR report says. In the months since the trough, Energy has been the worst-performing sector, undoing much of the 20% rise that preceded the October 2022 lows. No prior bull market has seen weaker returns from the sector through the first eight months. If there is any commodity that is sensitive to the strength of the economy, it’s the oil and gas that drives our cars and heats our homes. Clearly this price performance is forward looking to tougher times ahead.
NDR also points out that the gains within Financials following last October have been in the middle of the pack compared to previous bull markets, while regional banks, which make up less than 5%, of the S&P 500, have experienced the “worst” bull market performance for the sub-sector on record, eclipsing the 1990 performance. Lenders do well in early recoveries when financial conditions remain loose. The Bank of Canada recently surprised the markets and raised their benchmark rate again in June — making that 10 rate increases in just 1.5 years. The Federal Reserve has also increased rates. This is not a loose monetary policy environment, and is clearly taking a toll on U.S. and Canadian banks. The BMO Equal Weight Banks Index ETF (ZEB) is up 2.5% year-to-date5.
Reinforcing the idea that we are not in a recession yet, “low beta sectors (defensives) have also lagged their bull market averages. For Consumer Staples, only the 2002 and 2016 cases were weaker through the first eight months. Likewise, Health Care has given up some of its initial gains off the low in 2023, with the current case ranking second worst all time,” the NDR report said. These are sectors that you would expect to outperform when we finally do go into recession.
As we previously noted, Technology has been the outright winner year-to-date, up almost 50% since the market trough. The sector has been led by the mega caps, including Apple, Microsoft, and NVIDIA, while Communication Services has likewise been led by its mega caps (Alphabet, Meta, and Netflix). Yet the current case for each sector is now above their respective bull-market average.
Reversion To the Mean
Another tool to use in conjunction with the economic cycle chart above is the below chart of all sectors’ annual performances over the last 10 years. Unlike individual securities, groups of securities tend follow reversion patterns, whereby if they underperform for one or two years then they reverse and outperform for the next two. Utilities, Industrials and Energy are just three examples of many that express these patterns in the data.
Sector Returns - By Year (2012−2022)
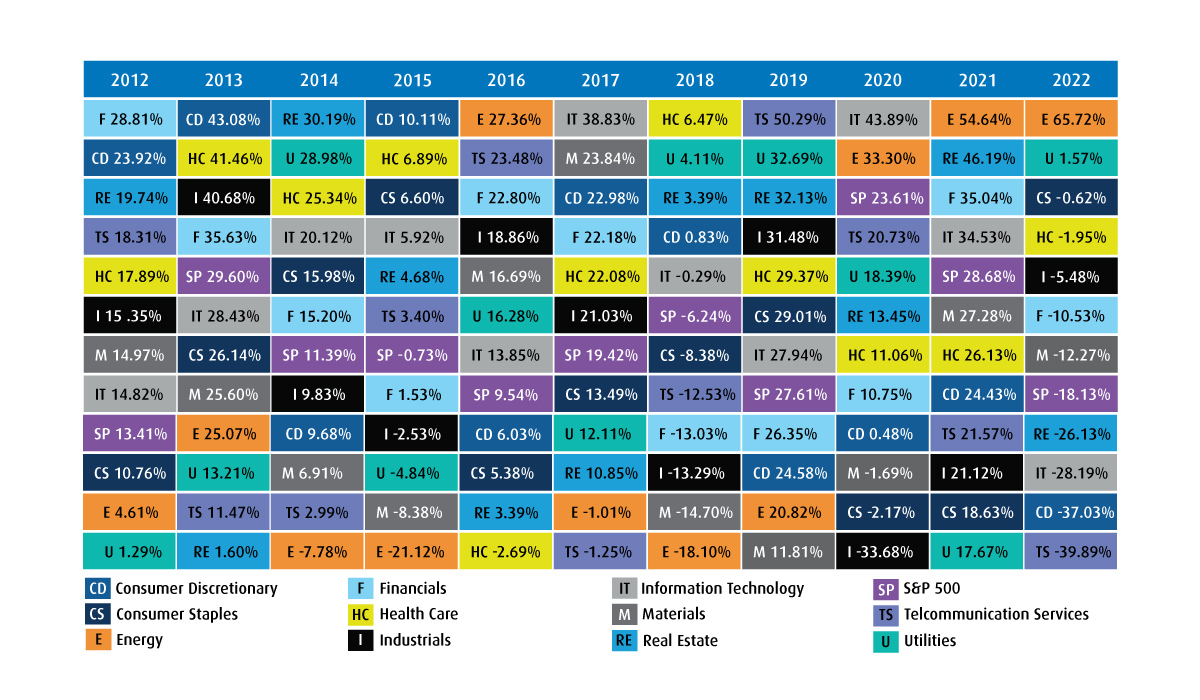
Source: BMO Exchange Traded Funds – Rotating For Success with BMO ETFs.
Discretionary portfolio managers have a unique advantage: the ability to trade on someone else’s behalf. This advantage is particularly helpful if you want to sector rotate, a strategy that requires being nimble and ready to trade intraday when opportunities arise. Only ETFs deliver the ability to tactically change exposures on an intraday basis with a single trade.
BMO Sector ETFs
Early Recovery
| ETF Name | Ticker | Geography | Portfolio Construction | Beta* | MER† |
BMO Equal Weight US Banks Hedged to CAD Index ETF | ZUB | U.S. | Equal Weighted | 1.52 | 0.38% |
BMO Equal Weight Banks Index ETF | ZBK | U.S. | Equal Weighted | 1.24 | 0.38% |
BMO Covered Call US Banks ETF | ZWK | U.S. | Equal Weighted with Options | 1.23 | 0.71% |
BMO Equal Weight Banks Index ET | ZEB | Canada | Equal Weighted | 1.00 | 0.28% |
BMO Covered Call Canadian Banks ETF | ZWB | Canada | Equal Weighted with Options | 0.92 | 0.72% |
BMO Global Consumer Discretionary Hedged to CAD Index ETF | DISC | Global | UCITS | 1.49 | 0.40% |
BMO Equal Weight REITs | ZRE | Canada | Equal Weighted | 1.17 | 0.61% |
Mid-cycle
| ETF Name | Ticker | Geography | Portfolio Construction | Beta* | MER† |
| BMO Equal Weight Industrials Index ETF | ZIN | Canada | Equal Weighted | 1.53 | 0.61% |
| BMO Nasdaq 100 Equity Hedged to CAD Index ETF | ZQQ | U.S. | Market Capitalization Weighted | 1.42 | 0.39% |
| BMO Nasdaq 100 Equity Index ETF | ZNQ | U.S. | Market Capitalization Weighted | 1.17 | 0.38% |
| BMO Global Communications Index ETF | COMM | Global | UCITS | 0.96 | 0.40% |
Late-cycle
| ETF Name | Ticker | Geography | Portfolio Construction | Beta* | MER† |
| BMO Equal Weight Global Gold Index ETF | ZGD | Global | Equal Weighted | 1.15 | 0.61% |
| BMO Equal Weight Global Base Metals Hedged to CAD Index ETF | ZMT | Global | Equal Weighted | 1.10 | 0.61% |
| BMO Equal Weight Oil & Gas Index | ZEO | Canada | Equal Weighted | 0.87 | 0.61% |
| BMO Global Agriculture ETF | ZEAT | Global | Market Capitalization Weighted | - | 0,73 %‡ |
| BMO Covered Call Energy ETF | ZWEN | Global | Equal Weighted with Options | - | 0,73 %‡ |
Recession
| ETF Name | Ticker | Geography | Portfolio Construction | Beta* | MER† |
| BMO Covered Call Utilities ETF | ZWU | Canada | Equal Weighted with options | 0.74 | 0.71% |
| BMO Equal Weight Utilities Index ETF | ZUT | Canada | Equal Weighted | 0.55 | 0.61% |
| BMO Global Consumer Staples Hedged to CAD Index ETF | STPL | Global | UCITS | 0.59 | 0.40% |
| BMO Equal Weight US Health Care Hedged to CAD Index ETF | ZUH | U.S. | Equal Weighted | 1.13 | 0.39% |
| BMO Equal Weight US Health Care Index ETF | ZHU | U.S. | Equal Weighted | 0.82 | 0.39% |
| BMO Covered Call Health Care ETF | ZWHC | U.S. | Equal Weighted with Options | - | 0,73 %‡ |
* 3-year historical beta. Source Morningstar February 28 2023. Beta: A measure of the volatility, or systematic risk, of a security or a portfolio in comparison to the market as a whole.
†MERs as of December 31, 2022.
‡Estimate only. Audited MER is unavailable since the ETF has not yet completed a financial year.
Source: BMO Exchange Traded Funds – Rotating For Success with BMO ETFs.
1 https://www.bmogam.com/ca-en/advisors/investment-solutions/etf-centre/
2 38.28% year-to-date, as at July 18, 2023. Annualized performance as at July 18, 2023: 1 year: 30.63%; 3-year: 13.47%; 5-year: 15.53%; 10-year: 17.72%; Since inception (January 19, 2010): 16.53%.
3 1.19% year-to-date, as at July 18, 2023. Annualized performance as at July 18, 2023: 1 year: 6.2%; 3-year: 4.41%; 5-year: 6.95%; 10-year: 11.24%; Since inception (May 27, 2016) :12.92%.
4 0.56% year-to-date as at July 18, 2023. Annualized performance as at July 18, 2023: 1 year: 6.2%; 3-year: 4.41%; 5-year: 6.95%; 10-year: 11.24%; Since inception (April 5, 2017): 12.92%.
5 4.48% year-to-date, as at July 18, 2023. Annualized performance as at July 18, 2023: 1 year: 20.39%; 3-year: -3.25%; 5-year: 9.68%; 10-year: 6.87%; Since inception (November. 14, 2012): -0.36%.
6 2.5% year-to-date, as at July 18, 2023. Annualized performance as at July 18, 2023: 1 year: 2.59%; 3-year: 16.7%; 5-year: 7.15%; 10-year: 10.4%; Since inception (October 20, 2009): 9.97%.
Disclosures:
Any statement that necessarily depends on future events may be a forward-looking statement. Forward-looking statements are not guarantees of performance. They involve risks, uncertainties and assumptions. Although such statements are based on assumptions that are believed to be reasonable, there can be no assurance that actual results will not differ materially from expectations. Investors are cautioned not to rely unduly on any forward-looking statements. In connection with any forward-looking statements, investors should carefully consider the areas of risk described in the most recent simplified prospectus.
The viewpoints expressed by the authors represents their assessment of the markets at the time of publication. Those views are subject to change without notice at any time without any kind of notice. The information provided herein does not constitute a solicitation of an offer to buy, or an offer to sell securities nor should the information be relied upon as investment advice. Past performance is no guarantee of future results. The statistics in this update are based on information believed to be reliable but not guaranteed.
This article is for information purposes. The information contained herein is not, and should not be construed as, investment, tax or legal advice to any party. Investments should be evaluated relative to the individual’s investment objectives and professional advice should be obtained with respect to any circumstance.
Commissions, management fees and expenses all may be associated with investments in exchange traded funds. Please read the ETF Facts or prospectus before investing. The indicated rates of return are the historical annual compounded total returns including changes in unit value and reinvestment of all dividends or distributions and do not take into account sales, redemption, distribution or optional charges or income taxes payable by any unitholder that would have reduced returns. Exchange traded funds are not guaranteed, their values change frequently and past performance may not be repeated.
For a summary of the risks of an investment in the BMO ETFs, please see the specific risks set out in the prospectus. BMO ETFs trade like stocks, fluctuate in market value and may trade at a discount to their net asset value, which may increase the risk of loss. Distributions are not guaranteed and are subject to change and/or elimination.
BMO ETFs are managed by BMO Asset Management Inc., which is an investment fund manager and a portfolio manager, and a separate legal entity from Bank of Montreal.
BMO Global Asset Management is a brand name under which BMO Asset Management Inc. and BMO Investments Inc. operate.
®/™ Registered trademarks/trademark of Bank of Montreal, used under licence.