BMO ARK Next Generation Internet Fund ETF Series- ARKW
Q1 2024 Quarterly Commentary
May 28, 2024General Market Commentary
Broad-based global equity indexes1 rallied in the fourth quarter, buoyed by growing consensus that the Federal Reserve (Fed) will lower rates in 2024. Now that consensus expectations have veered toward a soft landing, ARK continues to expect that a loss of pricing power will force corporations into employment cutbacks that will cause a harder-than-expected landing. Indeed, the US economy seems to have been in a rolling recession, depressing sectors like housing, autos, and commercial real estate while inventories continue to build. In response, the potential growth in ARK’s Five Innovation Platforms2 could play an outsized role in pulling the economy out of recession, salvaging corporate margins as inflation gives way to deflation in many sectors.
Rolling recessions suggest that the Fed should end its rate hiking program and weigh the merits of a pivot in policy. Unfortunately, the Fed still is focused on lagging indicators like employment and headline inflation. Indeed, the Bureau of Labor Statistics (BLS) has revised nonfarm payroll statistics down for eight of the last nine months, suggesting that the labor market is weaker than government reports have suggested. The last time that the BLS revised nonfarm payroll employment statistics down for such an extended period of time was in 2007, months before the onset of the Global Financial Crisis (GFC).
- The auto industry faced significant challenges during the COVID-19 pandemic and, while sales did enter a V-shaped recovery in 2021, current unit sales are annualizing at a 15.8 million3 annual rate, still well below the pre-COVID range of 17-18 million units. Notably, to increase affordability in a sluggish consumer environment, Tesla slashed the price of its Model Y by more than 20% year-over-year. Interestingly, in the early days of the pandemic, autos accounted for roughly one third of the inflation spike, a trend that Tesla seems to be reversing.
- Housing metrics like median prices, housing starts, and affordability also are sending troubling signals. At 3.8 million units, the number of new and existing home sales is approaching a level last seen during the global housing crisis.4
- Despite stronger-than-expected real Gross Domestic Product (GDP) growth, many companies are reporting revenues well below expectations. During the third quarter, UPS domestic average daily delivery volume dropped 11.5% on a year-over-year basis, and 3M’s global sales on an organic, local currency basis dropped more than 3%.5 In our view, companies pushed prices to unacceptable levels as supply chains seized up, so consumers rebelled, pushing inventories to excessive levels. If prices drop as inventories unwind, margins could collapse, forcing companies not only to lay off excess labor but also to harness AI and other automation to salvage margins.
- Strongly correlated with real GDP the U.S. Leading Economic Index (LEI) has been falling for 17 consecutive months and now is down 7.6% on a year-over-year basis,6 a decline that always has foreshadowed a recession. Real Gross Domestic Income (GDI) — which should equal real GDP over time — has declined 0.1% on a year-over-year basis, well below the 2.9% growth calculated in the real GDP accounts.7 During the last two quarters, the near record divergence in real growth rates between GDP and GDI has been begging the question about revisions: will the Bureau of Economic Analysis (BEA) revise GDI up or GDP down. Our view is the latter.
- M28 growth still is down 3.0% on a year-over-year basis, a rate not seen since the 1930s.9 While sequential declines seemed natural after the COVID-related surge, continued weakness could be pointing to recession. Additionally, because rising mortgage rates have trapped homeowners in their homes, growth in the velocity of money seems to be slowing down, exacerbating the decline in M2 and raising the odds of broad-based price deflation.
- The ratio of the Commodity Research Bureau (CRB) Metals price index to the Gold price index is falling and is close to the lows recorded during the GFC in 2008-2009. Since the GFC and until last year, this ratio has correlated closely to long-term interest rates. In 2023, the metals to gold ratio dropped near to decade-long lows as long-term interest rates surged.
The Federal Funds Target Rate surged 22-fold in 17 months, a record-breaking pace that caused significant strains in regional banking and commercial real estate. According to Milton Friedman, monetary policy works with “long and variable lags”; this suggests that the full impact of the Fed’s unprecedented tightening has yet to be felt.
While the Fed is focused on squelching inflation with higher interest rates, the bond market has been signaling trouble ahead. From March 2021 to July 2023, the yield curve10 inverted from +159 basis points to -108 basis points,11 hitting the steepest levels since the early 1980s when the Fed was fighting double-digit inflation. Since July 2023, the yield curve has entered a bear steepening, with long-term rates increasing relative to short-term rates, lessening the inversion to -35 basis points12 and suggesting that both real growth and inflation could surprise on the low side of expectations. In ARK’s view, the Fed is making decisions based on lagging indicators — employment and headline inflation — and ignoring leading indicators that are telegraphing recession and/or price deflation.
The Federal Reserve began increasing interest rates when the year-over-year Consumer Price Index (CPI) — a lagging economic indicator — reached 8.5% on a year-over-year basis in March 2022. Shortly thereafter, an inflationary surge influenced by geopolitical pressures and inventory hoarding peaked at 9.1% year-over-year. Since then, CPI inflation has dropped to 3.1%,13 thanks to various deflationary forces – – good, bad, and cyclical.
Innovation can be a source of good deflation, as learning curves cut costs and increase productivity. Yet, we believe many companies have catered to short-term-oriented, risk-averse shareholders, satisfying their demands for immediate profits/dividends. On balance, they have leveraged their balance sheets to buy back stock, bolster earnings, and increase dividends. In so doing, many have curtailed investments and could be ill-prepared for the potential disintermediation associated with disruptive innovation. Saddled with aging products and services, they could be forced to cut prices to clear unwanted inventories and service debt, causing bad deflation. In our view, history will show that inflation, initially triggered by supply shocks, was transitory and evolved into disinflation, then ultimately deflation. Consequently, interest rates are likely to surprise on the low side of expectations.
Fund Commentary
Among the top contributors were Coinbase Global (COIN) and Block (SQ). Block reported higher-than-expected third-quarter revenues and earnings. As Interim Head of Square, Jack Dorsey committed to reaching the Rule of 40 in 2026 with gross profit growth in the mid-teens or higher and adjusted operating income margin in the mid-twenties. Dorsey also committed to increased collaboration between Square and Cash App. Overall crypto strength — including bitcoin and ether price increases of 56.8% and 36.5%, respectively, propelled Coinbase.
Among the top detractors from performance were Vuzix (VUZI) and Tesla (TSLA). Shares of Vuzix depreciated after the company announced that third-quarter revenue declined 36% year-over-year, dropping well below consensus expectations in response to extended sales cycles. Tesla missed both revenue and earnings expectations for the third quarter, after downtimes for factory updates caused lower vehicle production and deliveries. Importantly, Tesla surpassed its forecast for full-year deliveries of 1.80 million vehicles. In December, Tesla “recalled” ~2 million vehicles, delivering over-the-air software updates, in response to a National Highway Traffic Safety Administration (NHTSA) investigation of Autopilot safety features. The update included several safety features, including warnings to Tesla drivers not paying attention to the road. Finally, on a more positive note, Tesla delivered its first Cybertrucks at the end of November.
Portfolio Construction
All weights are subject to change.
Top 10 Holdings |
Weight |
COINBASE GLOBAL INC -CLASS A |
13.55% |
ROKU INC |
7.98% |
3IQ BITCOIN ETF |
7.42% |
BLOCK INC |
7.04% |
UIPATH INC - CLASS A |
5.85% |
ZOOM VIDEO COMMUNICATIONS-A |
5.05% |
ROBLOX CORP -CLASS A |
4.62% |
UNITY SOFTWARE INC |
4.61% |
ROBINHOOD MARKETS INC - A |
4.53% |
TESLA INC |
4.50% |
68.15% |
 | 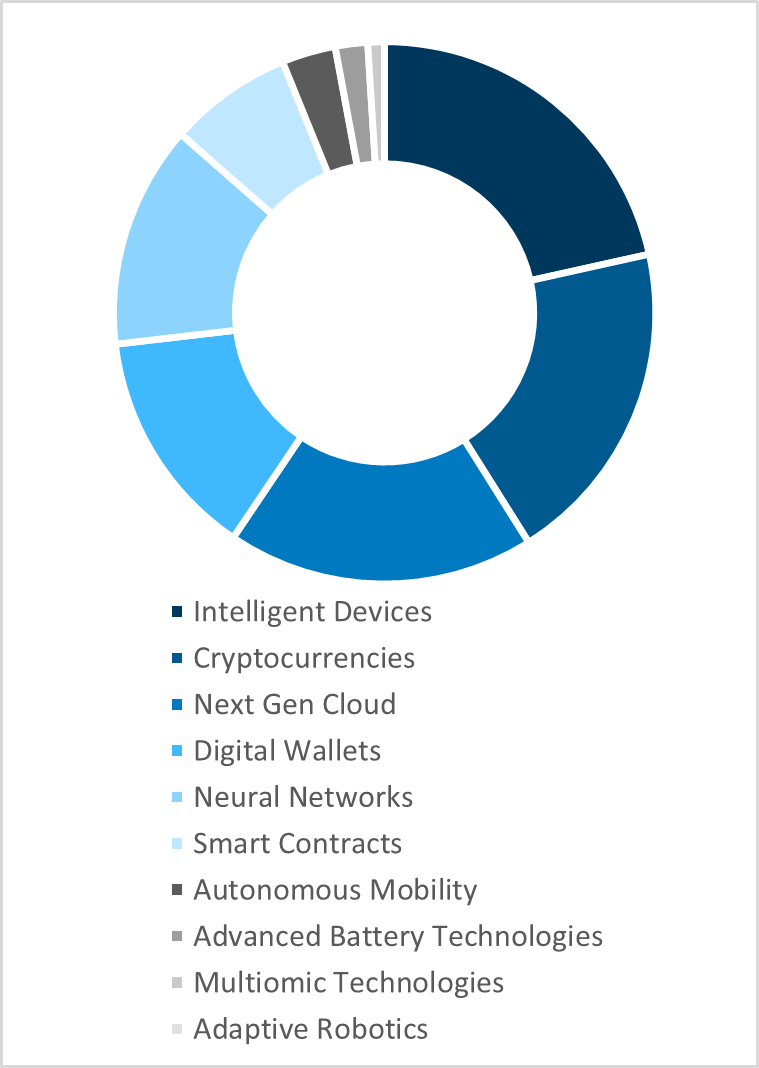 |  |
Market Capitalization | Portfolio Composition | Sectors |
|
|
|
Portfolio construction as of March 30, 2024.
Portfolio Manager Bio
Catherine “Cathie” D. Wood

Cathie registered ARK Investment Management LLC (“ARK”) as an investment adviser with the U.S. Securities and Exchange Commission in January 2014. With over 40 years of experience identifying and investing in innovation, Cathie founded ARK to focus solely on disruptive innovation while adding new dimensions to research. Through an open approach that cuts across sectors, market capitalizations, and geographies, Cathie believes that ARK can identify large-scale investment opportunities in the public markets resulting from technological innovations centered around DNA sequencing, robotics, artificial intelligence, energy storage, and blockchain technology. As Chief Investment Officer (“CIO”) and Portfolio Manager, Cathie led the development of ARK’s philosophy and investment approach and has ultimate responsibility for investment decisions.
Prior to ARK, Cathie spent twelve years at AllianceBernstein as CIO of Global Thematic Strategies where she managed over $5 billion. Cathie joined Alliance Capital from Tupelo Capital Management, a hedge fund she cofounded, which in 2000, managed approximately $800 million in global thematic strategies. Prior to her tenure at Tupelo Capital, she worked for 18 years with Jennison Associates LLC as Chief Economist, Equity Research Analyst, Portfolio Manager and Director. She started her career in Los Angeles, California at The Capital Group as an Assistant Economist. Cathie received her Bachelor of Science, summa cum laude, in Finance and Economics from the University of Southern California in 1981.
In 2018, Cathie launched the Duddy Innovation Center of Excellence at her alma mater, Notre Dame Academy in Los Angeles. The institute offers a challenging educational experience for young women eager to stretch their learning beyond the boundaries of traditional acquisition of knowledge, while influencing a new way of thinking and learning throughout the campus.
1 As measured by the S&P 500 and MSCI World.
2 ARK’s Five Innovation Platforms are Artificial Intelligence, Robotics, Energy Storage, Multiomic Sequencing and Blockchain Technology.
3 WARD’s Automotive Group. Data as of March 31, 2024.
4 Manheim Used Vehicle Value Index. Data as of March 31, 2024.
5 National Associate of Realtors. Data as of February 29, 2024.
6 U.S. Bureau of Labor Statistics. Data as of December 31, 2024.
7 U.S. Federal Reserve Economic Data as of December 2024. GDP is the total market value of all finished goods and services produced within a country’s border within a specific time period, typically a year. GDI is a measure of the total income generated by a country’s economy within a specific time period, typically a year.
8 National Federation of Independent Business. Data as of March 2024.
9 M2 is a measure of the U.S. money stock that includes M1 (currency and coins held by the non-bank public, checkable deposits, and travelers’ checks) plus savings deposits (including money market deposit accounts), small time deposits under $100,000, and shares in retail money market mutual funds.
10 U.S. Federal Reserve Economic Data from January 1960 to December 2023. M2 prior to 1960 is calculated by adding Currency Held By The Public, Deposits Adjusted Commercial Banks, Bank Vault Cash, Monetary Gold Stock, and Deposits At Nonbank Thrift Institutions.
11 As measured by the difference between yields on the 10-year Treasury bond and the 2-year Treasury note.
12 An “inversion” means that the long-term Treasury yield is lower than the short-term Treasury yield. The yield difference was +159 basis points on March 29, 2021, and -108 basis points on July 3, 2023. One basis point is equal to 1/100 of a percentage point, or 0.01%.
13 The yield different was -39 basis points on March 28, 2024.
14 U.S. Bureau of Labor Statistics. Data as of February 29, 2024.
Not intended for distribution outside of Canada.
Certain of the products and services offered under the brand name BMO Global Asset Management are designed specifically for various categories of investors in a number of different countries and regions and may not be available to all investors. Products and services are only offered to such investors in those countries and regions in accordance with applicable laws and regulations.
This communication is intended for informational purposes only and is not, and should not be construed as, investment, legal or tax advice to any individual. Particular investments and/or trading strategies should be evaluated relative to each individual’s circumstances. Individuals should seek the advice of professionals, as appropriate, regarding any particular investment. Past performance does not guarantee future results.
The viewpoints expressed by the Portfolio Manager represents their assessment of the markets at the time of publication. Those views are subject to change without notice at any time. The information provided herein does not constitute a solicitation of an offer to buy, or an offer to sell securities nor should the information be relied upon as investment advice. Past performance is no guarantee of future results. This communication is intended for informational purposes only.
The portfolio holdings are subject to change without notice and only represent a small percentage of portfolio holdings. They are not recommendations to buy or sell any particular security.
Any statement that necessarily depends on future events may be a forward-looking statement. Forward-looking statements are not guarantees of performance. They involve risks, uncertainties and assumptions. Although such statements are based on assumptions that are believed to be reasonable, there can be no assurance that actual results will not differ materially from expectations. Investors are cautioned not to rely unduly on any forward-looking statements. In connection with any forward-looking statements, investors should carefully consider the areas of risk described in the most recent simplified prospectus.
Commissions, management fees and expenses all may be associated with investments in exchange traded funds. Please read the ETF Facts or prospectus of the BMO ETFs before investing. Exchange traded funds are not guaranteed, their values change frequently, and past performance may not be repeated.
For a summary of the risks of an investment in the BMO ETFs, please see the specific risks set out in the BMO ETF’s prospectus. BMO ETFs trade like stocks, fluctuate in market value and may trade at a discount to their net asset value, which may increase the risk of loss. Distributions are not guaranteed and are subject to change and/or elimination.
BMO ETFs are managed by BMO Asset Management Inc., which is an investment fund manager and a portfolio manager, and a separate legal entity from Bank of Montreal.
BMO Global Asset Management is a brand name that comprises BMO Asset Management Inc. and BMO Investments Inc.
®/™Registered trademarks/trademark of Bank of Montreal, used under licence.