Sectors portfolio: Takeaways from earnings season


Takeaways from Earnings Season…
- At the time we’re writing this, just over 70% of firms in the S&P 500 have reported earnings for the second quarter. Of those, close to 80% of them have beaten earnings-per-share (EPS) expectations – which is slightly above the five-year average of 78%.
- The strength in earnings has led to a meaningful revision higher in EPS estimates for the present quarter. For instance, expectations for fiscal year earnings for the S&P 500 have moved from US$264.48 at the end of Q2 to US$267.27 – an increase of 1.05% over that time (according to estimates provided by Bloomberg). That’s not bad considering the broader macro backdrop of tariffs and a decelerating U.S. economy.
- The uptick in optimism has been paced by strong earnings growth in sectors like Communications, Technology and Financials. Of course, that speaks to the performance of some of the larger names in each of those sectors.
- Which leads us to a bit of a conundrum: while we are constructive given the fundamentals, we are very cautious given extant valuation as well as other factors (including seasonality and the trade backdrop).
- For instance, we continue to see upside in the Technology sector, but at over 32x price-to-forward-earnings, we’re likely to increase allocation only modestly. As another example, despite the increase in earnings expectations for this year, Health Care remains vulnerable given the adverse macro backdrop (including the possibility of pharmaceutical tariffs being levied by the U.S.).
- In our minds, we continue to like the barbell approach to sector allocation. We’ll pair overweight positions in pro-cyclical sectors like Tech, Communications and Financials with Utilities (a traditionally defensive sector).
- We’re cutting back on our exposure to Materials and Real Estate. The former is too vulnerable to the shift in the trade regime which is why we are downgrading it to an underweight position. The latter should benefit as the Federal Reserve re-starts its easing cycle this fall, but sustained performance will need the economic cycle to turn first.
Sectors we are overweight:
Chart 1 – Change in earnings expectations for 2025 by sector (year-over-year %)

Table 1 – BMO sector ETF portfolio for August
| Index | Sector Portfolio | Difference | Weighting | |
| S&P 500 | 100.00% | 100.00% | ||
| Tech | 34.16% | 38.50% | 4.34% | Overweight |
| Financials | 13.64% | 15.00% | 1.36% | Overweight |
| Comms. | 9.93% | 13.00% | 3.07% | Overweight |
| Health care | 8.79% | 5.00% | -3.79% | Underweight |
| Disc. | 10.34% | 9.50% | -0.84% | Neutral |
| Industrials | 8.57% | 6.00% | -2.57% | Underweight |
| Energy | 2.90% | 0.25% | -2.65% | Underweight |
| Materials | 1.84% | 0.25% | -1.59% | Underweight |
| Utilities | 2.45% | 5.00% | 2.55% | Overweight |
| Real estate | 2.01% | 2.50% | 0.49% | Neutral |
| Staples | 5.37% | 5.00% | -0.37% | Neutral |
Source: BMO Global Asset Management, August 2025. For illustrative purposes only. Past performance is not indicative of future returns.
Chart 2 – BMO sector ETF portfolio weights relative to S&P 500
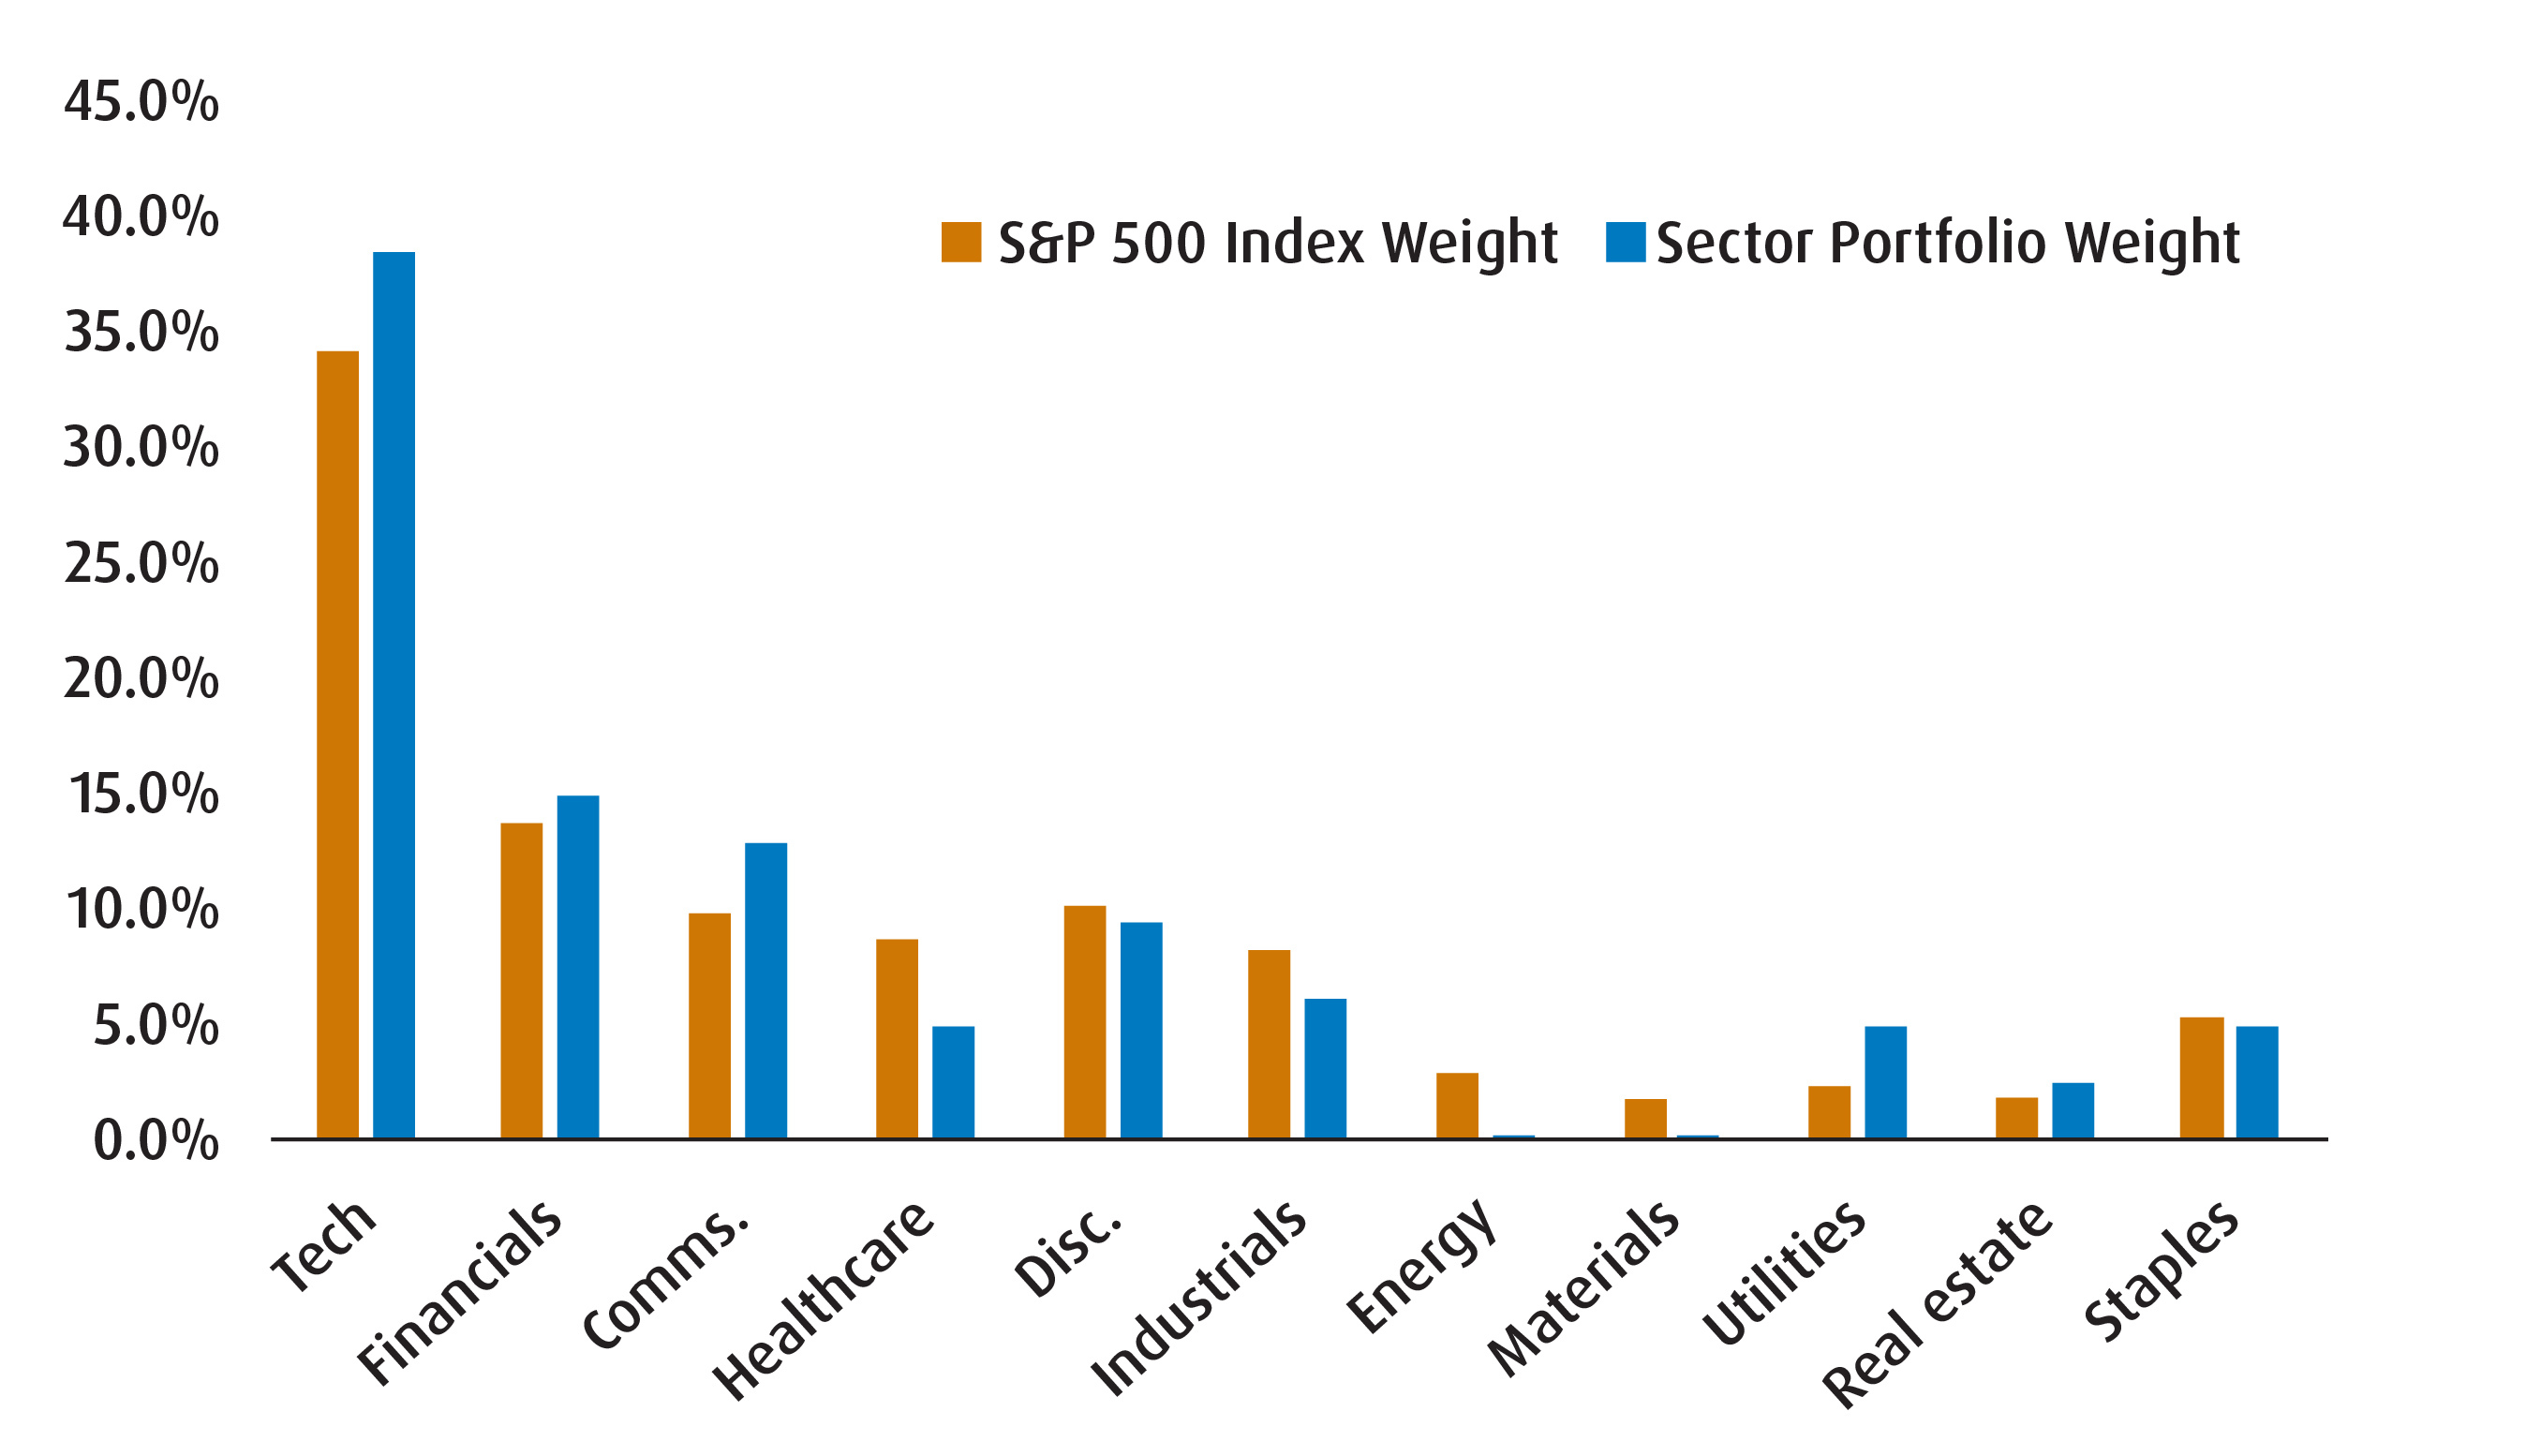
Chart 3 – Returns by sector
| Index | 50-day MAVG* | 100-day MAVG* | Returns (%) | ||||
| 5-day | Month-to-Date | Quarter-to-Date | Year-to-Date | ||||
| S&P 500 | 6349.33 | 6168.45 | 5879.46 | 0.16% | 0.16% | 2.33% | 7.95% |
| Tech | 5252.68 | 4929.73 | 4526.57 | 0.61% | 0.61% | 5.80% | 13.95% |
| Communications | 389.57 | 370.39 | 347.78 | 0.76% | 0.76% | 3.08% | 14.02% |
| Financials | 864.04 | 861.02 | 836.68 | -0.75% | -0.75% | -0.91% | 7.41% |
| Utilities | 435.84 | 418.03 | 408.87 | 0.17% | 0.17% | 5.07% | 13.22% |
| Real Estate | 260.65 | 262.28 | 259.19 | 0.29% | 0.29% | 0.13% | 1.85% |
| Discretionary | 1794.37 | 1755.71 | 1675.07 | -0.30% | -0.30% | 2.31% | -2.01% |
| Energy | 646.81 | 657.17 | 649.83 | -3.01% | -3.01% | -0.29% | -1.23% |
| Industrials | 1278.92 | 1249.20 | 1184.67 | -0.55% | -0.55% | 2.38% | 14.63% |
| Healthcare | 1521.85 | 1560.77 | 1579.23 | 0.23% | 0.23% | -3.22% | -5.17% |
| Staples | 898.93 | 894.73 | 892.10 | 2.79% | 2.79% | 0.20% | 5.30% |
| Materials | 558.41 | 560.77 | 544.52 | 0.93% | 0.93% | 0.42% | 5.41% |
*MAVG = moving average. Source: BMO Global Asset Management, Bloomberg, as of August 7, 2025. The 50/100 day moving average is calculated by averaging the closing prices of a stock or asset over the past 50/100 trading days, and is used by analysts to identify trends. Green = more bullish signal. Red = more bearish signal. For illustrative purposes only. Past performance is not indicative of future returns.
Source: BMO Global Asset Management.
Chart 4 – Earnings and valuation
| Earnings | Forward P/E | ||||
| Expected (Y/Y%) | Last Month | Change (%) | Next 12m | Z-Score | |
| S&P 500 | 4.67% | 3.52% | 1.15% | 23.74 | 1.847 |
| Tech | 12.01% | 10.13% | 1.88% | 32.47 | 1.574 |
| Communications | 1.60% | 7.24% | -5.64% | 20.93 | 1.161 |
| Financials | 1.74% | 1.32% | 0.42% | 17.47 | 1.232 |
| Utilities | 2.33% | 2.41% | -0.08% | 19.69 | 1.348 |
| Real Estate | -1.60% | -0.56% | -1.04% | 20.30 | -0.176 |
| Discretionary | -2.14% | -3.77% | 1.63% | 29.93 | 0.827 |
| Energy | -4.60% | -8.02% | 3.42% | 16.65 | -0.178 |
| Industrials | 2.04% | 2.70% | -0.67% | 26.57 | 1.563 |
| Healthcare | 1.66% | 4.07% | -2.41% | 16.92 | 0.022 |
| Staples | 0.50% | -0.20% | 0.70% | 22.65 | 1.635 |
| Materials | 6.64% | 5.12% | 1.52% | 22.23 | 0.834 |
Source: BMO Global Asset Management/Bloomberg, as of August 7, 2025. Y/Y = year over year. P/E refers to Price-to-Earnings Ratio, which analysts use as a valuation metric. The forward P/E ratio (or forward price-to-earnings ratio) divides the current share price of a company by the estimated future (“forward”) earnings per share (EPS) of that company. Z-Score is a measure of how much a data point varies from the average of the entire data set. A positive z-score says the data point is above average. A negative z-score says the data point is below average. The closer the Z-score is to zero, the closer the value is to the mean. Green = more bullish signal. Red = more bearish signal. For illustrative purposes only. Past performance is not indicative of future returns.
Chart 5 – Seasonality Chart (Avg Rank Over Past 35 Years)
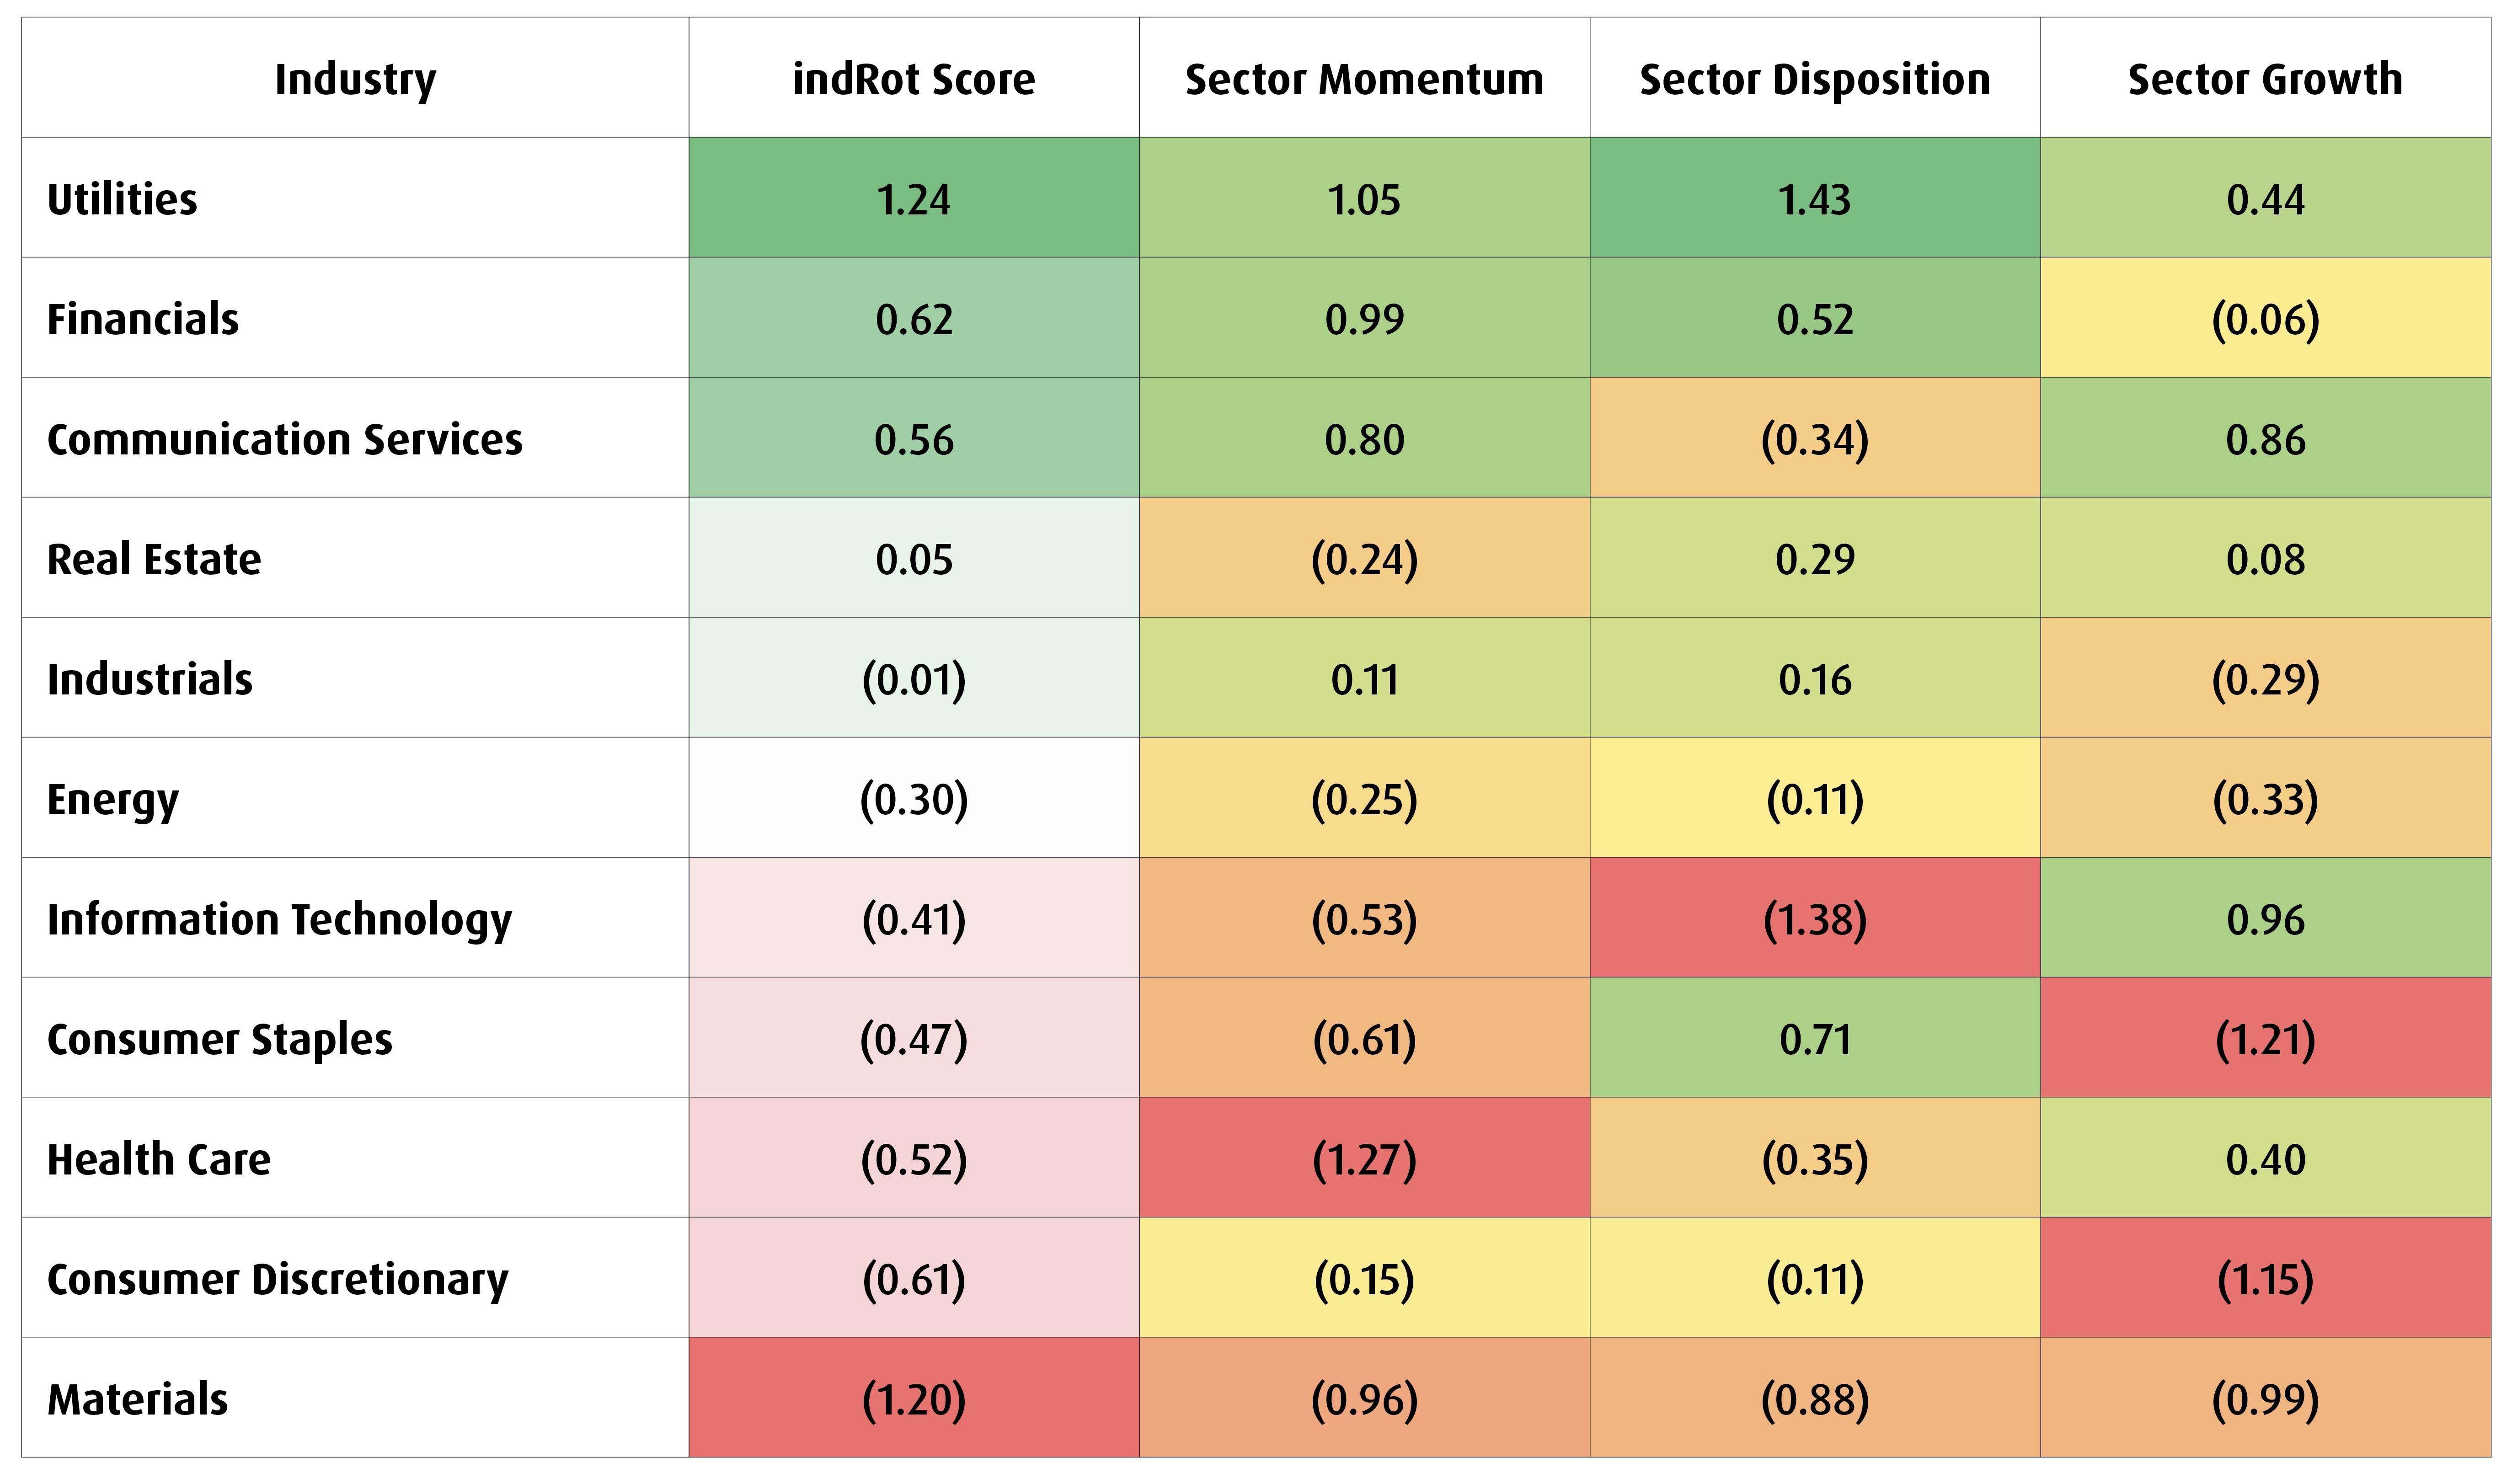
Chart 6 – BMO Global Asset Management quant model
For more market insights and commentary from BMO ETFs Strategist Bipan Rai, please visit and bookmark The Basis Point.
Performance (%)
Ticker |
Year-to-date |
1-month |
3-months |
6-months |
1-year |
3-year |
5-year |
10-year |
Since inception |
ZXLR |
Returns are not available as there is less than one year’s performance data. |
||||||||
ZXLE |
|||||||||
ZXLU |
|||||||||
ZXLK |
|||||||||
ZXLB |
|||||||||
ZXLP |
|||||||||
ZXLY |
|||||||||
ZXLI |
|||||||||
ZXLC |
|||||||||
ZXLV |
|||||||||
ZXLF |
|||||||||
Inception date for all ETFs = February 3, 2025.
Disclaimers:
For Advisor Use.
This article is for information purposes only. The information contained herein is not, and should not be construed as investment, tax or legal advice to any party. Particular investments and/or trading strategies should be evaluated relative to the individual’s investment objectives and professional advice should be obtained with respect to any circumstance.
The viewpoints expressed by the author represents their assessment of the markets at the time of publication. Those views are subject to change without notice at any time. The information provided herein does not constitute a solicitation of an offer to buy, or an offer to sell securities nor should the information be relied upon as investment advice. Past performance is no guarantee of future results. This communication is intended for informational purposes only.
The Select Sector SPDR Trust consists of eleven separate investment portfolios (each a “Select Sector SPDR ETF” or an “ETF” and collectively the “Select Sector SPDR ETFs” or the “ETFs”). Each Select Sector SPDR ETF is an “index fund” that invests in a particular sector or group of industries represented by a specified Select Sector Index. The companies included in each Select Sector Index are selected on the basis of general industry classification from a universe of companies defined by the S&P 500®. The investment objective of each ETF is to provide investment results that, before expenses, correspond generally to the price and yield performance of publicly traded equity securities of companies in a particular sector or group of industries, as represented by a specified market sector index. The Index is a product of S&P Dow Jones Indices LLC or its affiliates (“SPDJI”), and has been licensed for use by the Manager. S&P®, S&P 500®, US 500, The 500, iBoxx®, iTraxx® and CDX® are trademarks of S&P Global, Inc. or its affiliates (“S&P”) and Dow Jones® is a registered trademark of Dow Jones Trademark Holdings LLC (“Dow Jones”), and these trademarks have been licensed for use by SPDJI and sublicensed for certain purposes by the Manager. The ETF is not sponsored, endorsed, sold or promoted by SPDJI, Dow Jones, S&P, their respective affiliates, and none of such parties make any representation regarding the advisability of investing in such product(s) nor do they have any liability for any errors, omissions, or interruptions of the Index. The S&P 500 Index is an unmanaged index of 500 common stocks that is generally considered representative of the U.S. stock market. The index is heavily weighted toward stocks with large market capitalizations and represents approximately two-thirds of the total market value of all domestic common stocks. The S&P 500 Index figures do not reflect any fees, expenses or taxes. An investor should consider investment objectives, risks, fees and expenses before investing. You cannot invest directly in an index.
Commissions, management fees and expenses all may be associated with investments in exchange-traded funds. Please read the ETF Facts or prospectus of the BMO ETFs before investing. Exchange-traded funds are not guaranteed, their values change frequently and past performance may not be repeated.
For a summary of the risks of an investment in the BMO ETFs, please see the specific risks set out in the prospectus. BMO ETFs trade like stocks, fluctuate in market value and may trade at a discount to their net asset value, which may increase the risk of loss. Distributions are not guaranteed and are subject to change and/or elimination.
BMO ETFs are managed and administered by BMO Asset Management Inc., an investment fund manager and a portfolio manager, and a separate legal entity from Bank of Montreal.
BMO Global Asset Management is a brand name under which BMO Asset Management Inc. and BMO Investments Inc. operate.
“BMO (M-bar roundel symbol)” is a registered trademark of Bank of Montreal, used under licence.