Cooling trade tensions may prove temporary. How to prepare for more market flux.
May 20, 2025
A full reprieve from an all-out U.S.-China trade war may prove short lived, and we are cautious about whether the terms agreed to will guide the course of additional trade agreements between the United States and other countries. In our view, the U.K.-U.S. pact is also less informative, once you review the details.
Once market exuberance fades, investors will continue to face a new, more restrictive U.S. trade policy, with material implications for markets. Below we review the two announced deals, and express our view of where investors could consider capital allocation in light of the announcements.
ETFs in focus
Fixed Income
BMO Short Corporate Bond Index ETF (ticker: ZCS)
BMO Target 2027 Canadian Corporate Bond ETF (ticker: ZXCO)
BMO Target 2028 Canadian Corporate Bond ETF (ticker: ZXCP)
BMO Target 2029 Canadian Corporate Bond ETF (ticker: ZXCQ)
Sectors
BMO Equal Weight Industrials Index ETF (ticker: ZIN)
BMO Equal Weight Utilities Index ETF (ticker: ZUT)
BMO Gold Bullion ETF (ticker: ZGLD)
International
Backdrop
After talks in Switzerland, the United States and China agree on May 12 to slash tariff rates by 115% for a period of 90 days. The U.S. will apply an average tariff rate of 30% on Chinese goods imports, and China will apply an average tariff rate of 10%. Notably, both sides have agreed to establish a trade consultation mechanism.
Our take: Markets rallied on the news and there was an element of surprise in the percentages. Most expected an average U.S. tariff rate on Chinese goods being anywhere from 50-80% as part of any accord.
This is really about the Trump team trimming the extremes of trade policy rather than an outright removal of trade barriers. We expect the ensuing rallies to have relatively short shelf lives. True, this is a substantial“climbdown” from April, but the offramp still leads the U.S. economy to a worse exit point than where it was heading into the year.
U.S.-U.K. trade announcement
This is largely a symbolic announcement. Does this establish a template for additional“deals” between the U.S. and other countries? Probably not.
For goods, the U.K. is the U.S.’ eighth-largest goods trading partner,1 and one of the few countries that the U.S. actually runs a trading surplus against. Both countries are mostly net debtors to the rest of the world.
In short, it’s much easier for the U.K. to accept a 10% baseline tariff in exchange for concessions in a few sectors given that trade between the two countries isn’t as comprehensive. We couldn’t see Canada, the EU or China accepting something akin to this.
Overarching strategy?
Are there any hints of the overarching U.S. trade strategy? Yes.
The U.S. is willing to give on tariffs on steel/aluminum – and to a degree on autos – in exchange for purchase agreements and increased market access for U.S. exporters. We suspect the degree of flexibility will depend upon who the U.S. is negotiating with. Are tariffs just a negotiating tactic then? Yes and no.
Trump is showing that he willing to cut some tariffs, but not give up on them completely. The U.S. is not removing the 10% tariff baseline while at the same time it’s keeping the reciprocal tariff at 10%. Remember that since the U.S. runs a goods trade surplus with the U.K., the latter only pays the 10% baseline tariff. That implies that countries that run a trade surplus with the U.S. should expect the floor to be 20% (baseline + reciprocal).
To put it bluntly — tariffs are here to stay and“10% is new 0%.”
To distill the message further: markets have rallied primarily because Trump has been trimming the extremes of his trade policy. Not because the next level of U.S. economic prosperity has been unlocked.
Once the short-term excitement is over, this points to further consolidation and/or downside risks until the Fed starts easing rates. And so far, the data doesn’t suggest that they should be in a hurry to do so.
Portfolio strategy
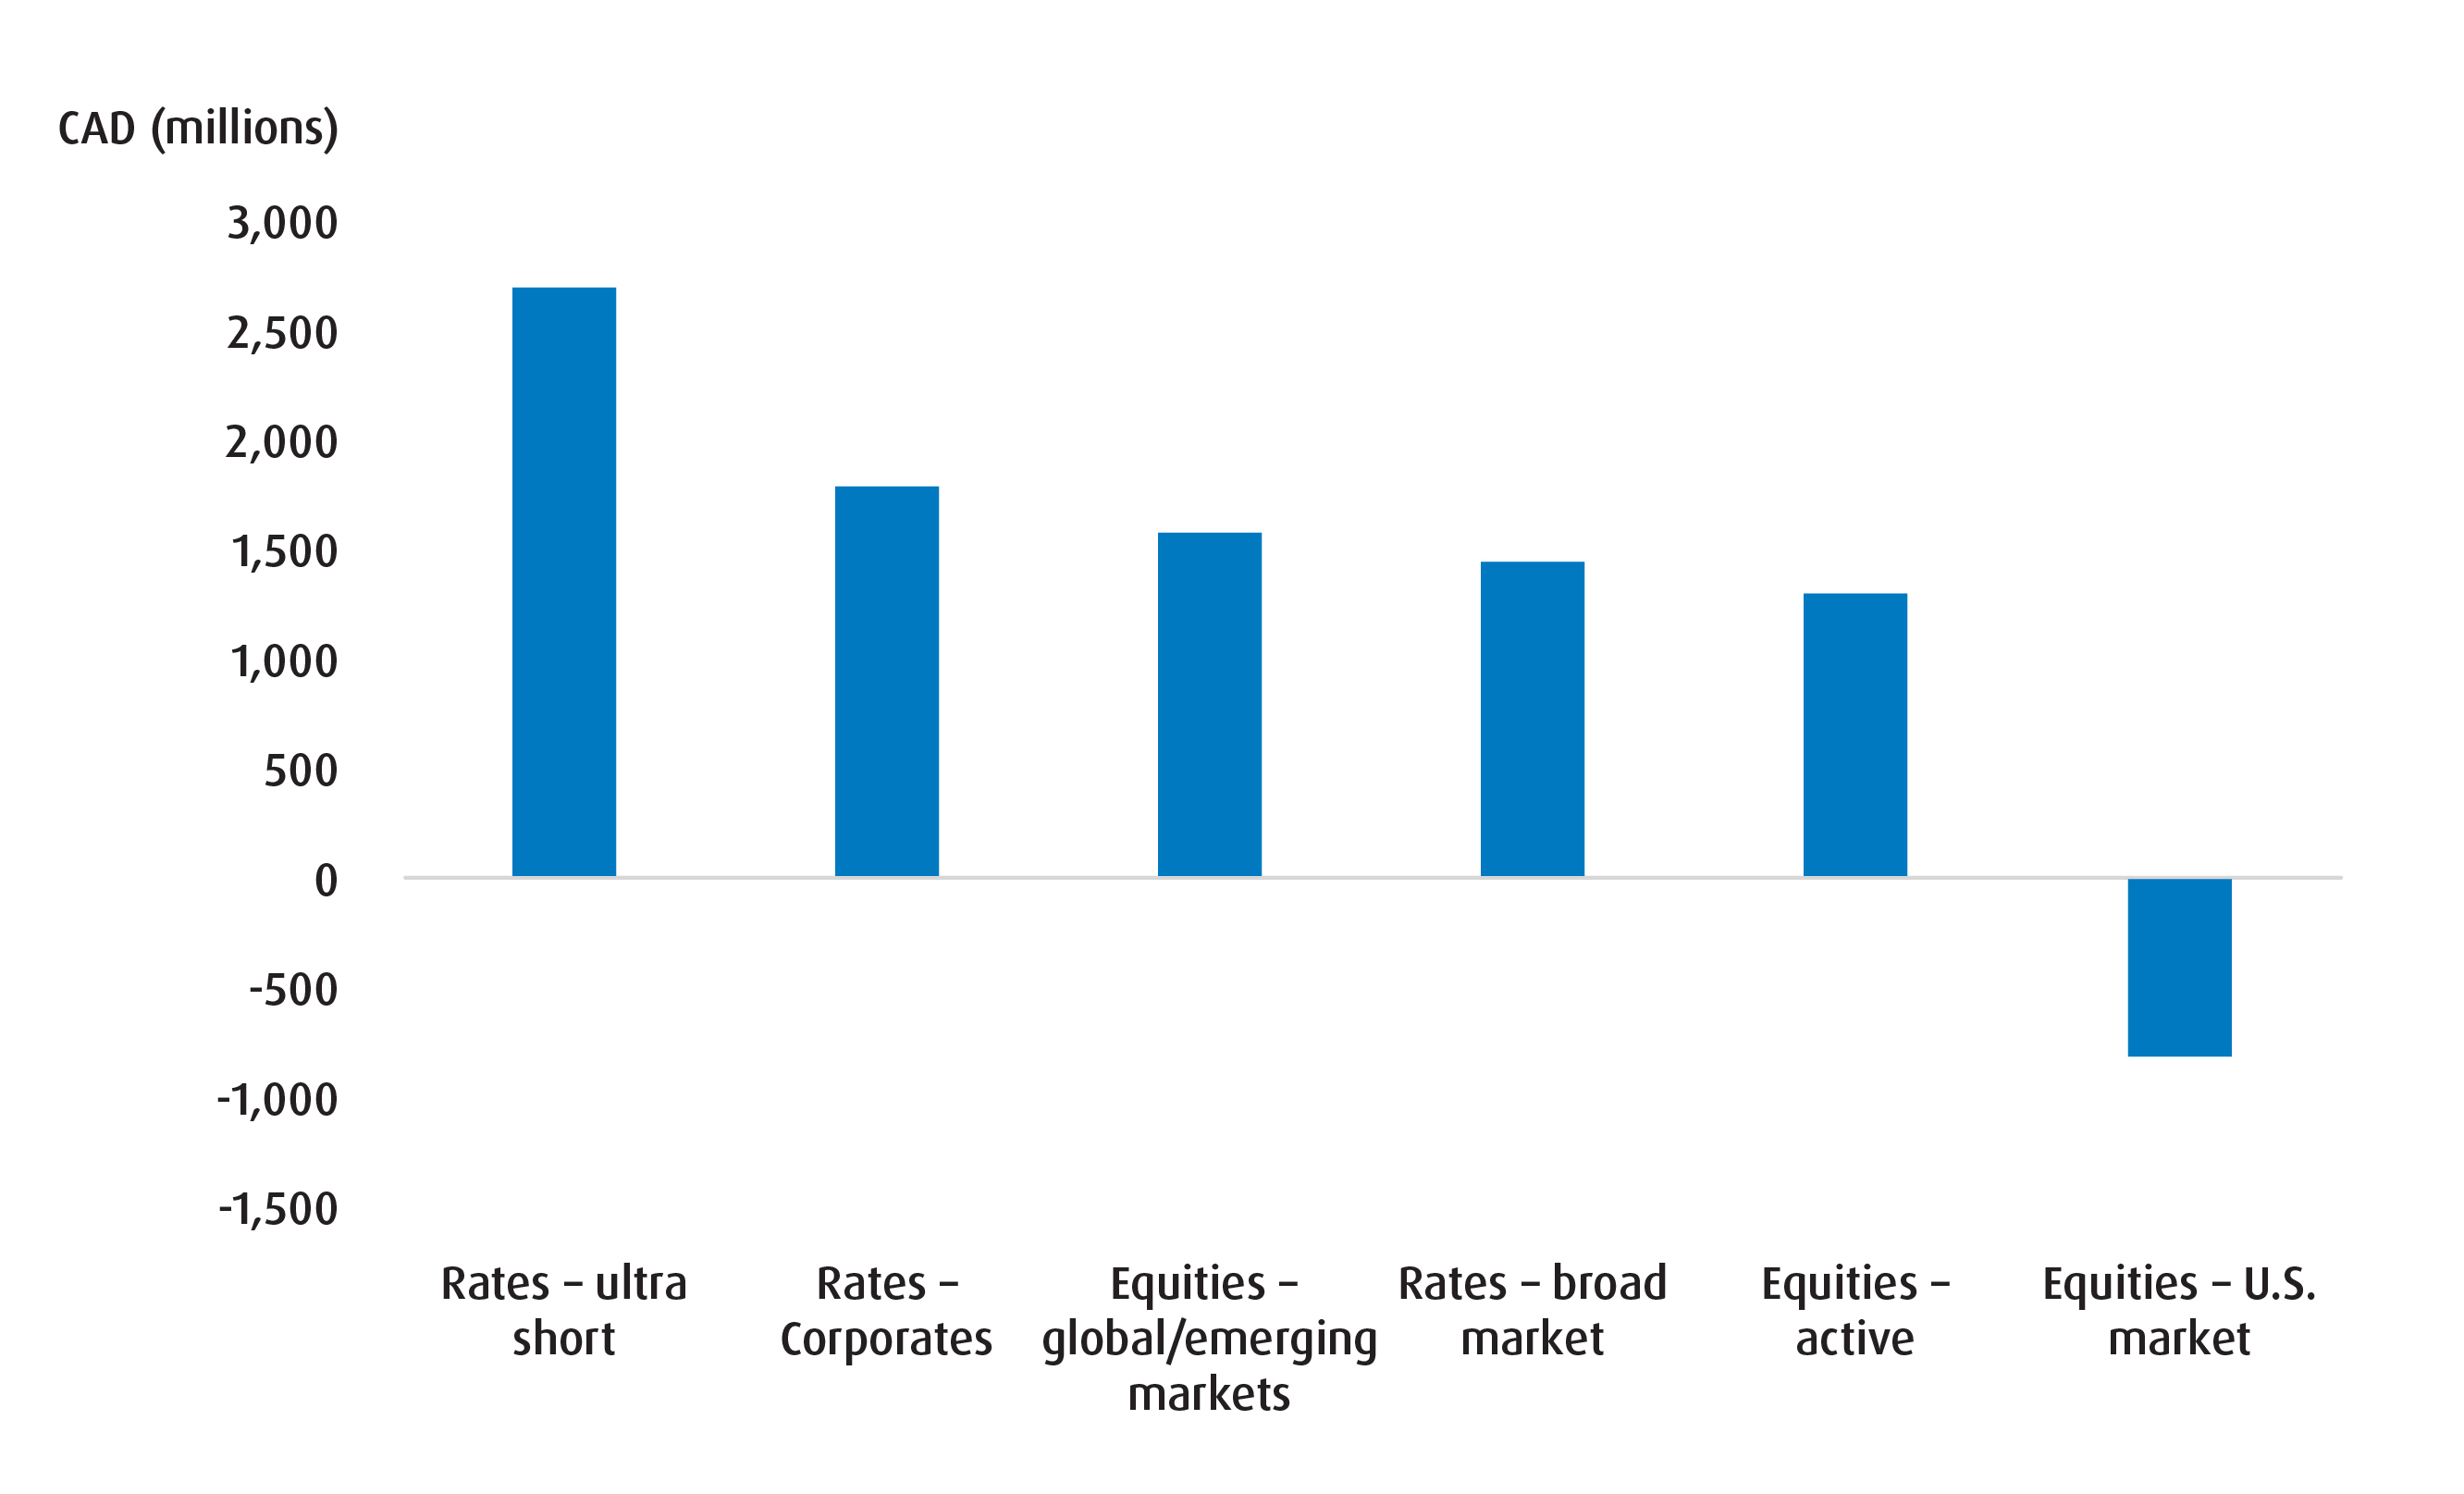
The chart below shows the year-to-date gross inflows and outflows by our own ETF roadmap category. A few interesting observations to make here:
- First, the large amount of flows to the ultra-short category tells us that clients have been prioritizing liquidity amidst the heavy degree of macroeconomic volatility.
- Second, flows into corporate bond ETFs are surprising until we note that most of this has been in short corporates (or ZCS).
- Third, we’ve seen a pick-up in interest for global and emerging market equity tracking funds.
- Finally, investors have exited overweight positions in funds that track U.S. equities.
To us, the flow out of ultra short-term funds is a risk to watch for. Markets have rallied primarily because Trump is trimming the extremes of his trade policy – but we’d caution against buying into further rallies based on“trade deals” like the U.S./U.K. agreement.
For investors looking to continue to prioritize liquid positions as well as capital preservation, the tickers below could be considered:
Fixed Income
BMO Short Corporate Bond Index ETF (ticker: ZCS)
BMO Target 2027 Canadian Corporate Bond ETF (ticker: ZXCO)
BMO Target 2028 Canadian Corporate Bond ETF (ticker: ZXCP)
BMO Target 2029 Canadian Corporate Bond ETF (ticker: ZXCQ)
BMO AAA CLO ETF - Hedged Units (ticker: ZAAA.F)
Largest year-to-date flows into BMO ETFs (by roadmap category)
As for where a portion of those flows go? We suspect it’ll be recycled into the EAFE space – not least as markets become more tuned into the reality that while Trump may be moderating a bit on tariffs, they won’t be going away completely. It is this point that we expect to support the EAFE > U.S. even more in the period ahead.
International
BMO International Dividend ETF (ticker: ZDI)
Other funds and strategies that we continue to like…
- Industrials (as a sector). Our own ZIN has performed fairly well over the past few weeks and we suspect this is due to expectations of fiscal stimulus here in Canada. It still feels like this theme has more room to run.
- Utilities (covered call). ZUT provides decent yield and some shelter from trade-related risks given its exposure to Canadian and U.S. names.
- Gold + miners. This is a clarion call for ZGLD, and ZJG more than anything.
Sectors
BMO Equal Weight Industrials Index ETF (ticker: ZIN)
BMO Equal Weight Utilities Index ETF (ticker: ZUT)
BMO Gold Bullion ETF (ticker: ZGLD)
BMO Junior Gold Index ETF (ticker: ZJG)
Performance (%)
Ticker |
Year-to-date |
1-month |
3-month |
6-month |
1-year |
3-year |
5-year |
10-year |
Since inception |
ZCS |
1.66 |
0.10 |
0.77 |
2.81 |
8.40 |
6.31 |
2.86 |
2.59 |
2.94 |
ZXCO |
Returns are not available as there is less than one year’s performance data. |
||||||||
ZXCP |
|||||||||
ZXCQ |
|||||||||
ZAAA.F |
|||||||||
ZDI |
8.32 |
-1.32 |
2.14 |
7.66 |
12.65 |
14.04 |
13.25 |
6.51 |
7.06 |
ZIN |
-12.09 |
-1.54 |
-8.43 |
-7.54 |
-0.03 |
7.26 |
12.10 |
7.88 |
9.68 |
ZUT |
5.72 |
1.94 |
10.76 |
6.76 |
29.68 |
0.33 |
6.94 |
8.10 |
7.46 |
ZGLD |
21.30 |
1.53 |
11.33 |
19.45 |
43.01 |
- |
- |
- |
49.65 |
ZJG |
37.46 |
6.28 |
21.96 |
27.19 |
71.11 |
21.07 |
13.59 |
13.39 |
2.38 |
Bloomberg, as of April 30, 2025. Inception date for ZCS = October 20, 2009, ZDI = November 5, 2014, ZIN = November 14, 2012, ZUT = January 19, 2010, ZGLD = March 4, 2024, ZJG = January 19, 2010.
1 Bloomberg, as of April 30, 2025.
Disclaimers:
Advisor and institutional only. No portion of this communication may be reproduced or distributed to clients.
This article is for informational or educational purposes only and does not provide investment advice or recommendations.
CLOs are floating- or fixed-rate debt securities issued in different tranches, with varying degrees of risk, by trusts or other special purpose vehicles (“CLO Issuers”) and backed by an underlying portfolio consisting primarily of below investment grade corporate loans. The BMO ETF pursues its investment objective by investing, under normal circumstances, at least 85% of its net assets in CLOs that, at the time of purchase, are rated AAA or the equivalent by a nationally recognized statistical rating organization.
AAA herein refers to the order of payments, should there be any defaults, and does not represent the ratings of the underlying loans within the CLO. If there are loan defaults or the CLO Issuer’s collateral otherwise underperforms, scheduled payments to senior tranches take precedence over those of mezzanine tranches (a tranche or tranches subordinated to the senior tranche), and scheduled payments to mezzanine tranches take precedence over those to subordinated/equity tranches. The riskiest portion is the“Equity” tranche, which bears the first losses and is expected to bear all or the bulk of defaults from the corporate loans held by the CLO Issuer serves to protect the other, more senior tranches from default.
All investments involve risk. The value of an ETF can go down as well as up and you could lose money. The risk of an ETF is rated based on the volatility of the ETF’s returns using the standardized risk classification methodology mandated by the Canadian Securities Administrators. Historical volatility doesn’t tell you how volatile an ETF will be in the future. An ETF with a risk rating of “low” can still lose money. For more information about the risk rating and specific risks that can affect an ETF’s returns, see the BMO ETFs’ simplified prospectus.
BMO Global Asset Management is a brand name under which BMO Asset Management Inc. and BMO Investments Inc. operate.
Commissions, management fees and expenses all may be associated with investments in exchange traded funds. Please read the ETF Facts or simplified prospectus of the BMO ETFs before investing. The indicated rates of return are the historical annual compounded total returns including changes in unit value and reinvestment of all dividends or distributions and do not take into account sales, redemption, distribution or optional charges or income taxes payable by any unitholder that would have reduced returns. Exchange traded funds are not guaranteed, their values change frequently and past performance may not be repeated.
For a summary of the risks of an investment in the BMO ETFs, please see the specific risks set out in the BMO ETF’s prospectus. BMO ETFs trade like stocks, fluctuate in market value and may trade at a discount to their net asset value, which may increase the risk of loss. Distributions are not guaran- teed and are subject to change and/or elimination.
BMO ETFs are managed by BMO Asset Management Inc., which is an investment fund manager and a portfolio manager, and a separate legal entity from Bank of Montreal.
This material is for information purposes only. The information contained herein is not, and should not be construed as investment, tax or legal advice to any party. Particular investments and/or trading strategies should be evaluated and professional advice should be obtained with respect to any circumstance.
The viewpoints expressed by the author represents their assessment of the markets at the time of publication. Those views are subject to change without notice at any time. The information provided herein does not constitute a solicitation of an offer to buy, or an offer to sell securities nor should the information be relied upon as investment advice. Past performance is no guarantee of future results. This communication is intended for informational purposes only.
Any statement that necessarily depends on future events may be a forward-looking statement. Forward-looking statements are not guarantees of performance. They involve risks, uncertainties and assumptions. Although such statements are based on assumptions that are believed to be reasonable, there can be no assurance that actual results will not differ materially from expectations. Investors are cautioned not to rely unduly on any forward-looking statements. In connection with any forward-looking statements, investors should carefully consider the areas of risk described in the most recent simplified prospectus.
“BMO (M-bar roundel symbol)” is a registered trademark of Bank of Montreal, used under licence.