Deconstructing Beta and Understanding Alpha – The Role of Factors in Investing
Daniel Stanley, Director, Institutional & Advisory, dives deep into Factor investing, examining the differences between Factors and Styles, outlining Factor investing’s key benefits, and exploring how a strategy like low volatility can best be integrated into a portfolio.


We use simple references to explain relativities in the investment world, but do we understand their deep significance? One of the most common references is to a benchmark, a theoretical construct to measure manager risk and return. Benchmark returns are referred to as Beta, or market risk — a term that emphasizes their universality.
The first serious benchmark index — no offence to Charles Dow and Edward Jones for their creation of the Dow Jones Industrial Average (DJIA) — was the S&P 500. It was conceived in 1956 and published in 1957, and its objective was to provide a yardstick to determine if managers were skillful or lucky. At the time, a robust and representative measure was required because the 30-stock, price-weighted DJIA did not represent market breadth and depth. The benchmark index provided a standard against which managers could be measured, to determine if they provided Alpha over and above the market’s Beta.
After a number of years, it was apparent that many managers did not beat the index. In fact, those managers who trailed the index return had negative Alpha. Some underperforming managers, however, may have claimed to have assumed lower risk. To address the validity of such claims, further research and analysis resulted in the Sharpe Ratio being conceived to position returns relative to their risk level.
A landmark 1986 study by Gary P. Brinson, L. Randolph Hood and Gilbert L. Beebower revealed that asset allocation was the overwhelming determinant in aligning investment outcomes to objectives, with security selection and market timing having minimal relevance.1 But this did not explain why some strategies delivered Alpha and why.
With greater computing and data sourcing, analysis coined a new concept known as Factors — the de facto excess return drivers. Alpha could now be categorized as a major contributor to outperformance:
The evolution of indexing
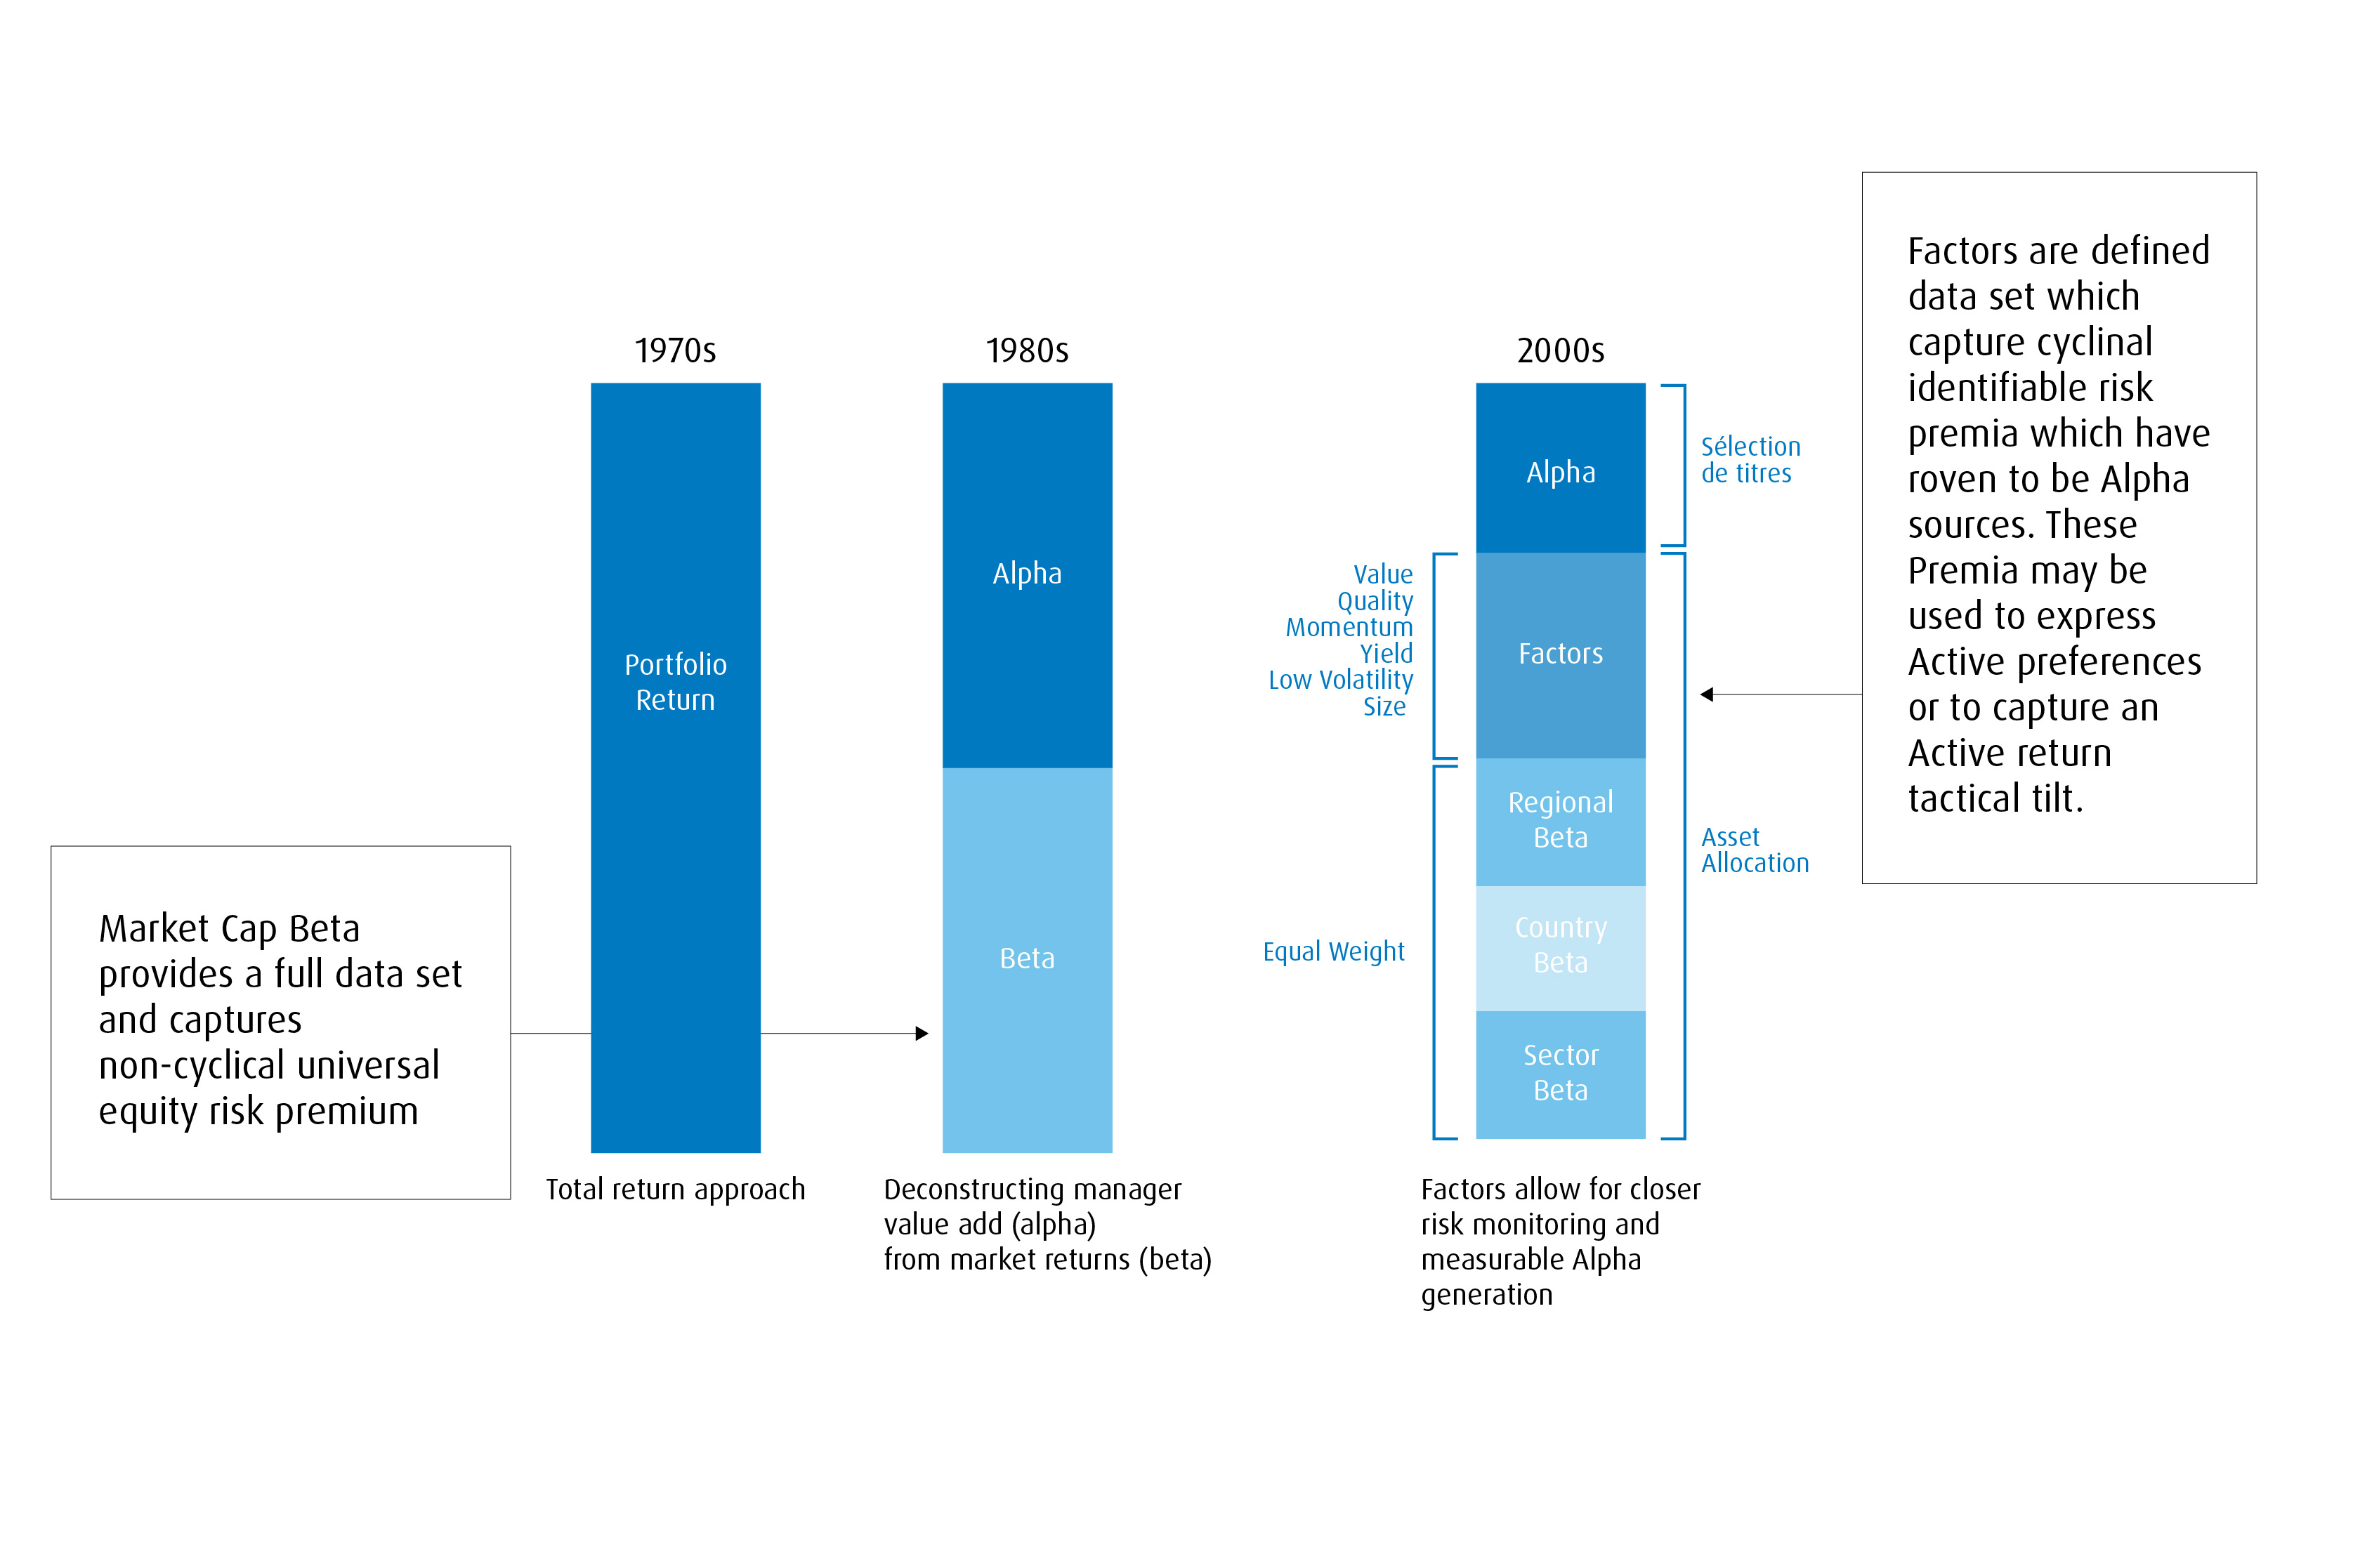
Source: BMO Global Asset Management, as of March 31, 2023.
With greater computing and data sourcing, analysis coined a new concept known as Factors — the de facto excess return drivers. Alpha could now be categorized as a major contributor to outperformance.
Factors versus Style:
Prior to Factors, the investment industry had recognized the need to distinguish between Value and Growth managers, acknowledging the inherent differences in the approaches and the cyclicality in each’s returns at different points in an economic cycle. Eventually, Growth-at-a-Reasonable-Price emerged as yet another style, albeit a hybrid.
Investors may ask — how do Factors differ from styles? Styles make distinctions between valuations and the objective prices managers are willing to pay for earnings, but style indices retain a market capitalization weighting methodology. In contrast, Factors identify characteristics which have been shown to drive long-term excess returns across all markets. For a Factor to be legitimate, it must display relevance over time and across regions; idiosyncrasies undermine Factor relevance.
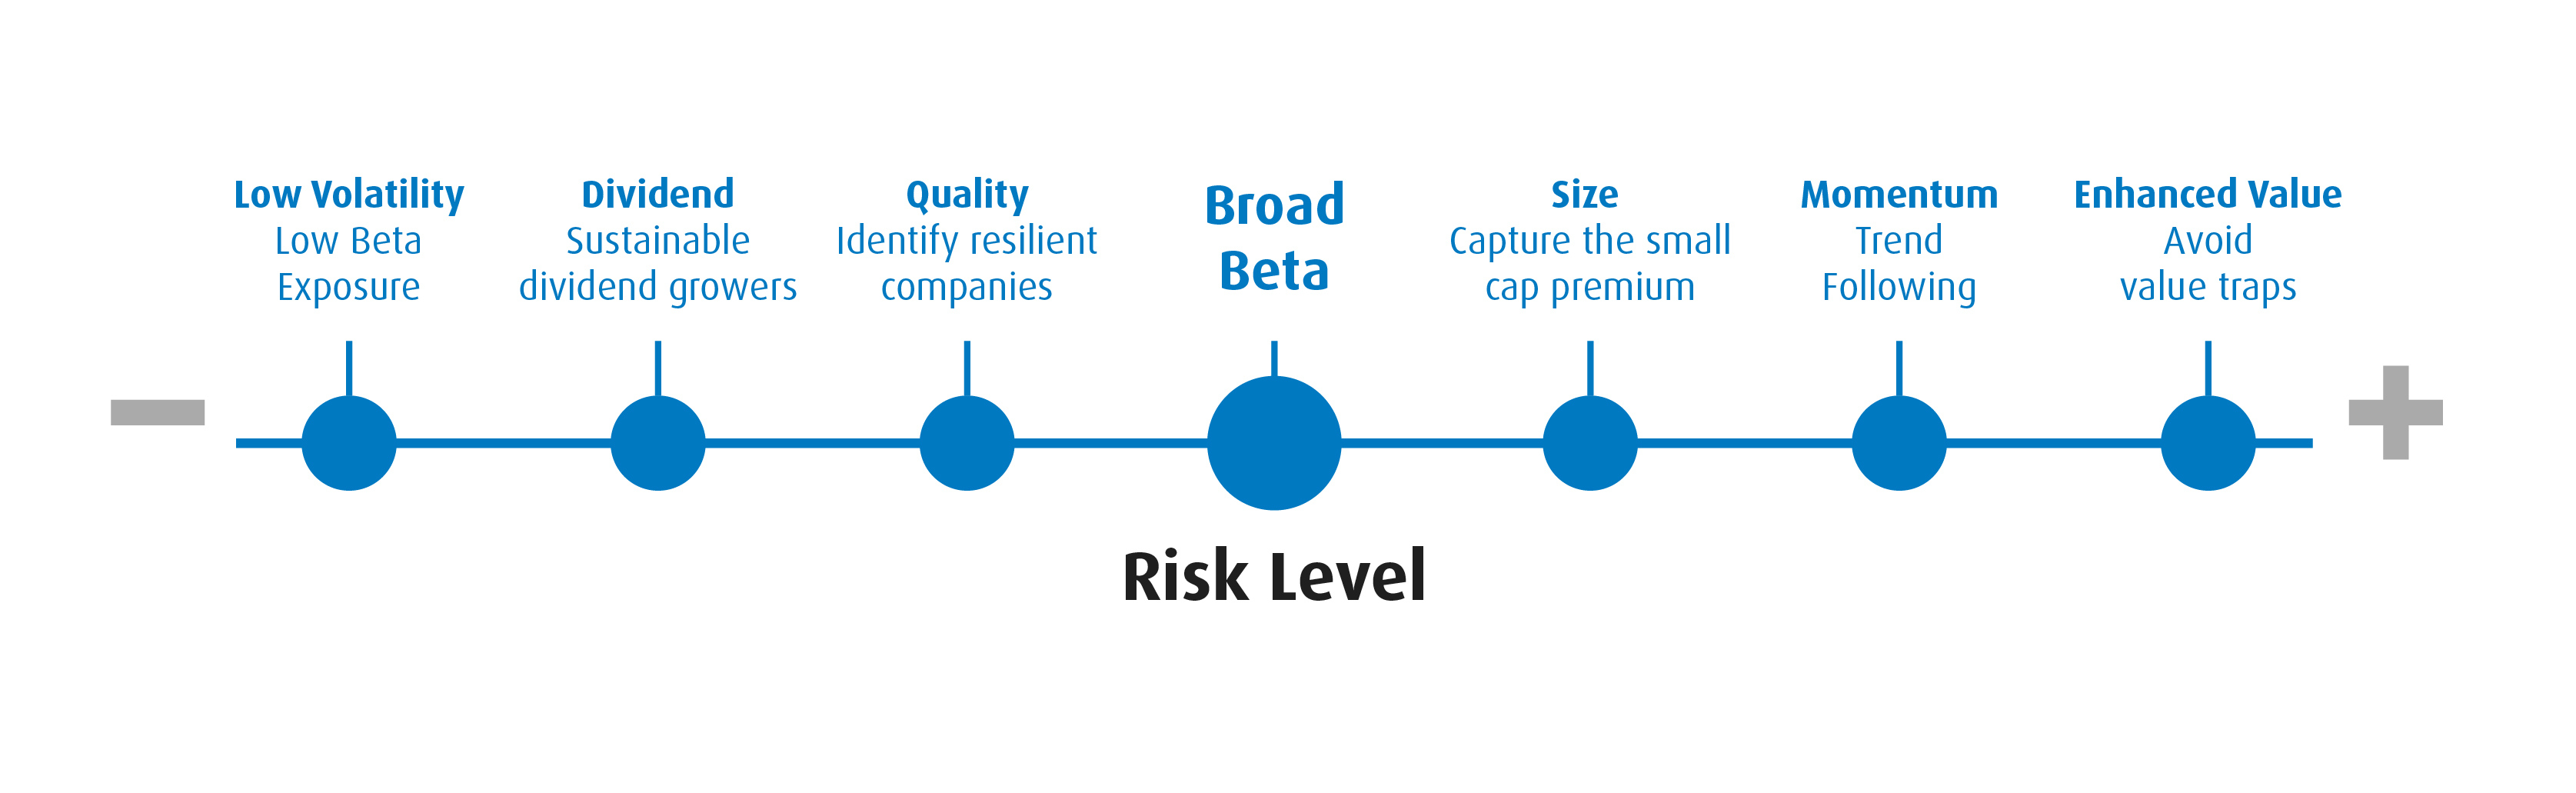
MSCI has identified six Factors, and each is weighted according to its own metrics, to maximize the integrity the Factor captures in the screening process:
Source: BMO Global Asset Management.
It is possible to consider Factors as a crossover between Active management and Broad Beta indexing. Like the index, it is transparent and derives its consistency from a rules-based methodology.
Like an Active mandate, Factors provide:
- A conviction portfolio;
- A more concentrated portfolio;
- Tracking Error due to its Active share compared to the benchmark;
- The opportunity to generate cyclical Alpha.
Adding a Factor ETF may help to manage risk and may provide simple execution to an area where a firm does not have resources or expertise.
Integrating Factors into portfolios
As the linear graphic above shows, Factors line up nicely relative to the broad Beta benchmark from which they are constructed. Pension plans perform Factor analysis to hold their managers accountable (essential asking the question, “are the managers drifting away from their mandates?”), and to align exposures with plan maturity and required risk.
Investment counselling firms usually have a very defined approach when they screen stocks, so Factor ETFs can be very good complementary exposures to established internal capabilities. Adding a Factor ETF may help to manage risk and may provide simple execution to an area where a firm does not have resources or expertise.
Low Volatility tends to have the broadest application for client portfolios, suitable in different concentrations for both conservative and growth investors. The premise is very simple but effective. There is a low volatility anomaly – over the long-term, low volatility investors can achieve better risk-adjusted returns by not losing as much money in declining markets, leaving more capital to participate in a market rebound.
Fund/Index |
Return |
Risk |
Sharpe |
Inception Date |
BMO Low Volatility Canadian Equity ETF (Ticker: ZLB) |
11.87% |
12.07% |
0.98 |
26-Oct-11 |
S&P/TSX Composite Total Return Index |
7.44% |
18.35% |
0.41 |
|
Difference |
4.43% |
24% Less Risk |
||
BMO Low Volatility US Equity ETF (Ticker: ZLU) |
14.80% |
14.40% |
1.03 |
26-Mar-13 |
S&P 500 Total Return Index (CAD) |
15.09% |
17.61% |
0.86 |
|
Difference |
-0.29% |
18% Less Risk |
Source: As of March 31, 2023. Index returns align with respective inception date of ZLB and ZLU. Annualized data. ZLB Annualized Returns: 1-year: -0.37%, 3-year: 7.56%, 5-year: 8.05%, 10-year: 11.41%. ZLU Annualized Returns: 1-year: 7.98%, 3-year: 10.01%, 5-year: 14.91%. Index returns do not reflect transactions costs or the deduction of other fees and expenses and it is not possible to invest directly in an Index. Past performance is not indicative of future results.
For investment counselling firms, exposure to the Size Factor through a Small- or Mid-Cap index ETF provides liquid exposure to a valuable part of the market which can be very tedious to trade at the security level.
Factor definitions are very important and should not be overlooked, and the Small/Mid-Cap example is perfect foil to illustrate their importance. Though some people gravitate to the Russell indices to gain exposure to this market segment, it is merely market capitalization weighted, without any additional considerations.
S&P Dow Jones, however, screens for four consecutive quarters of positive earnings when constructing the S&P 400 (ZMID) and S&P 600 (ZSML). Rules make a qualitative difference, which has generated excess returns over time:
Index |
Return |
Sharpe |
Average Price- |
Inception Date |
S&P SmallCap 600 Index |
10.02% |
0.46 |
17.1 |
31-Dec-93 |
Russell 2000 Index |
8.23% |
0.37 |
21.4 |
|
Difference |
1.79% |
|||
S&P MidCap 400 Index |
11.02% |
0.53 |
16.4 |
31-Dec-93 |
Russell 1000 Index |
9.73% |
0.50 |
16.5 |
|
Difference |
1.29% |
Source: As of March 31, 2023. Index returns do not reflect transactions costs or the deduction of other fees and expenses and it is not possible to invest directly in an Index. Past performance is not indicative of future results.
BMO Exchange Traded Funds has a comprehensive Factor suite, providing Low Volatility, Dividend/Yield, Quality, Size and Enhanced Value exposures to complement your firm’s core capabilities. The BMO ETF Roadmap provides a full overview of our listings.
For more information on BMO’s Factor investing solutions, reach out to your regional Institutional BMO ETF Specialist.
Disclosures:
Any statement that necessarily depends on future events may be a forward-looking statement. Forward-looking statements are not guarantees of performance. They involve risks, uncertainties and assumptions. Although such statements are based on assumptions that are believed to be reasonable, there can be no assurance that actual results will not differ materially from expectations. Investors are cautioned not to rely unduly on any forward-looking statements. In connection with any forward-looking statements, investors should carefully consider the areas of risk described in the most recent simplified prospectus.
The viewpoints expressed by the authors represents their assessment of the markets at the time of publication. Those views are subject to change without notice at any time without any kind of notice. The information provided herein does not constitute a solicitation of an offer to buy, or an offer to sell securities nor should the information be relied upon as investment advice. Past performance is no guarantee of future results. The statistics in this update are based on information believed to be reliable but not guaranteed.
This article is for information purposes. The information contained herein is not, and should not be construed as, investment, tax or legal advice to any party. Investments should be evaluated relative to the individual’s investment objectives and professional advice should be obtained with respect to any circumstance.
Commissions, management fees and expenses all may be associated with investments in exchange traded funds. Please read the ETF Facts or prospectus before investing. The indicated rates of return are the historical annual compounded total returns including changes in unit value and reinvestment of all dividends or distributions and do not take into account sales, redemption, distribution or optional charges or income taxes payable by any unitholder that would have reduced returns. Exchange traded funds are not guaranteed, their values change frequently and past performance may not be repeated.
For a summary of the risks of an investment in the BMO ETFs, please see the specific risks set out in the prospectus. BMO ETFs trade like stocks, fluctuate in market value and may trade at a discount to their net asset value, which may increase the risk of loss. Distributions are not guaranteed and are subject to change and/or elimination.
BMO ETFs are managed by BMO Asset Management Inc., which is an investment fund manager and a portfolio manager, and a separate legal entity from Bank of Montreal.
BMO Global Asset Management is a brand name under which BMO Asset Management Inc. and BMO Investments Inc. operate.
®/™Registered trademarks/trademark of Bank of Montreal, used under licence.