Extending Duration (and Hedging Against a Market Downswing) with Aggregate Bonds
With interest rate uncertainties persisting, how do Investment Counsellors and Family Offices protect client portfolios against a potential equity market sell-off? Laura Tase, Director, Institutional & Advisory ETF Distribution, BMO ETFs, dives deep into the benefits of extending duration with aggregate bonds, including the BMO Aggregate Bond Index ETF (ticker: ZAG) and the BMO US Aggregate Bond Index ETF (ticker: ZUAG).


Bonds: A Comeback Story
Needless to say, it’s been an interesting couple of years for bonds.
Since yields bottomed out in the early days of the pandemic, they’ve rebounded significantly — though given market volatility and uncertainty around monetary policy, it hasn’t been in a straight line. Driven by higher interest rates than we’ve seen in decades, short-term bonds now offer very attractive yields, with both the U.S. 2-Year Treasury Note and the Canada 2-Year Bond topping 4.5%.1 But it’s the long end of the curve that offers another benefit: diversification.
Inflation and Fixed Income Markets
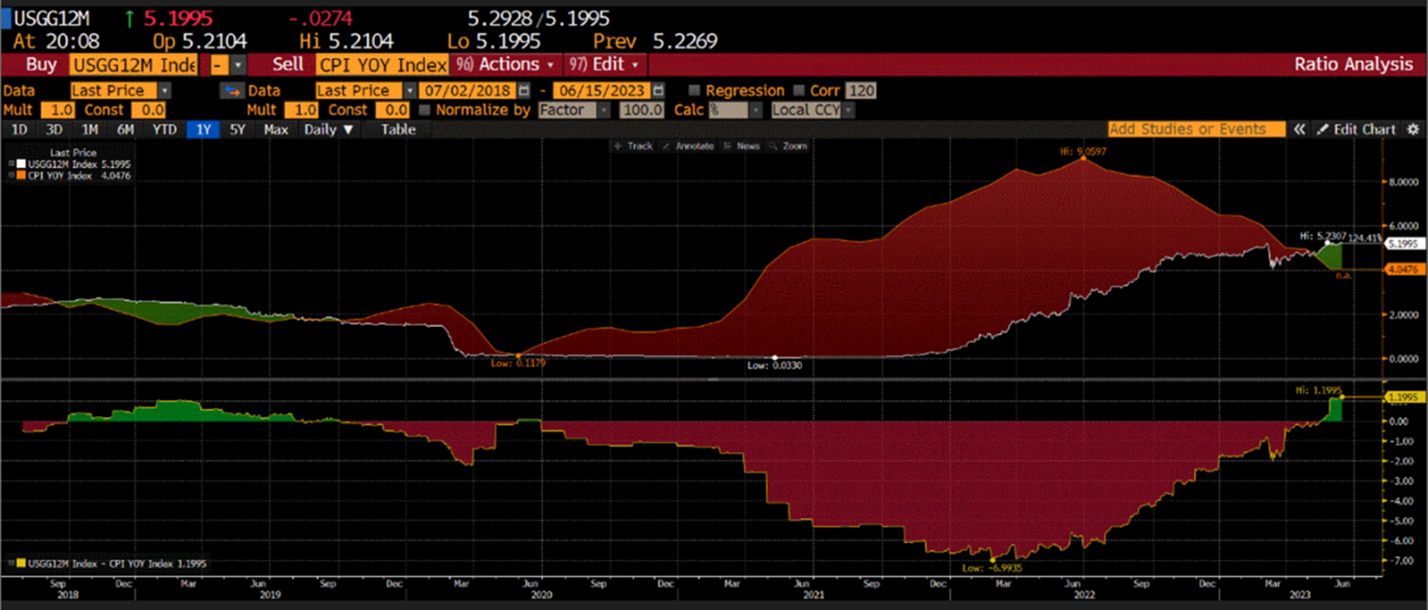
A close examination of the macroeconomic picture reveals an environment that is favourable for bonds. As the Consumer Price Index (CPI) has started to trend in the right direction, rate hikes by both the U.S. Federal Reserve (Fed) and Bank of Canada (BoC) have slowed, with the Fed following through in June on what some analysts have dubbed a “hawkish pause” — keeping interest rates unchanged while maintaining a relatively hawkish tone in its commentary. The chart below shows that real interest rates, as calculated by subtracting year-over-year CPI from the U.S. 1-Year Treasury yield, are finally positive for the first time since 2019. This is a significant sign that inflation is on the mend, and is a positive bellwether for fixed income markets.
Additionally, real-time inflation, which is calculated daily by the firm Truflation based on millions of data points, also appears to be slowing, as shown in the graph below.
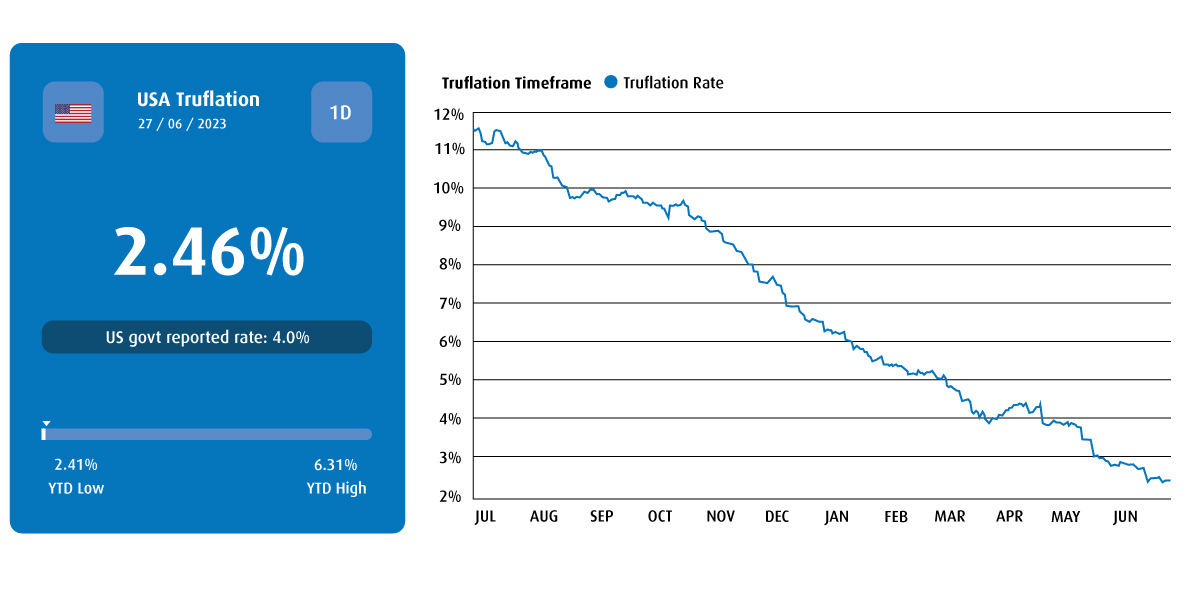
Rising prices in goods have largely abated and supply chains are normalizing. Inflation in services has been more resilient but also shows signs of easing. This provides additional justification for the Fed’s pause.
Hedging Against an Equities Sell-Off With Aggregate Bonds
So, with the inflation picture improving, where are the risks for investors? If inflation continues to move in the right direction, this may allow the economy to avoid the ‘hard landing’ that markets had feared. Although inflation and the cost of money have risen, the labour market has remained resilient, helping to delay the onset of a potential recession. This is, generally speaking, good news. However, further rate hikes have the potential to expose systemic risks, which could prompt an equity market sell-off.
One strategy to sidestep such a scenario is to extend duration in your client’s bond holdings. This can help provide protection and act as a hedge against a stock market downturn. For clients not comfortable allocating a portion of their portfolio to long bonds, an aggregate exposure can be an attractive alternative.
Full exposure to the yield curve can often help manage unexpected volatility. Our expectation is that markets will remain volatile for the foreseeable future, and that recovery won’t be a straight line. Having exposure to the full bond market can be helpful in constructing client portfolios that can withstand such periods of uncertainty.
Low-cost core beta solutions like the BMO Aggregate Bond Index ETF (ZAG) and the BMO US Aggregate Bond Index ETF (ZUAG) offer the flexibility to be more precise and tactical around the periphery of a client’s portfolio. If a portfolio has a set allocation to fees, minimizing the cost of its core frees up funds to consider a wider range of satellite solutions. Both ZAG and ZUAG provide high-quality fixed income exposures that enable investors to take advantage of credit spreads without being forced to go extremely overweight bonds in case of a market sell-off — and at an attractive MER of only nine basis points.3
|
|
The Advantages of ETFs
There are several advantages to using bond ETFs for the fixed income allocation of your client portfolios compared to individual bond trading. They include cost effectiveness, greater liquidity, better tactical flexibility, and the ability to precisely target duration and exposure to meet your client’s investment objectives. ETFs also feature tighter spreads relative to individual bonds purchased through a retail advisory desk. As the largest bond ETF provider in Canada,4 BMO GAM offers asset managers the benefits of institutional pricing.
For more information on BMO’s fixed income solutions, reach out to your regional Institutional BMO ETF Specialist.
1 As of June 27, 2023.
2 BMO Global Asset Management, as of June 16, 2023. Yield to Maturity (YTM) is the discount rate that equates the present value of a bond’s cash flows with its market price (including accrued interest). The measure does not include fees and expenses. Annualized Distribution Yield: The most recent regular distribution, or expected distribution, (excluding additional year end distributions) annualized for frequency, divided by current NAV. Duration: A measure of sensitivity of bond prices to changes in interest rates. For example, a 5-year duration means the bond will decrease in value by 5% if interest rates rise 1% and increase in value by 5% if interest rates fall 1%. Generally, the higher the duration the more volatile the bond’s price will be when interest rates change.
3 As ZUAG is less than one year old, the actual Management Expense Ratio (MER) will not be known until the fund financial statements for the current fiscal year are published. The estimated MER is an estimate only of expected fund costs until the completion of a full fiscal year and is not guaranteed.
Disclosures:
Any statement that necessarily depends on future events may be a forward-looking statement. Forward-looking statements are not guarantees of performance. They involve risks, uncertainties and assumptions. Although such statements are based on assumptions that are believed to be reasonable, there can be no assurance that actual results will not differ materially from expectations. Investors are cautioned not to rely unduly on any forward-looking statements. In connection with any forward-looking statements, investors should carefully consider the areas of risk described in the most recent simplified prospectus.
The viewpoints expressed by the authors represents their assessment of the markets at the time of publication. Those views are subject to change without notice at any time without any kind of notice. The information provided herein does not constitute a solicitation of an offer to buy, or an offer to sell securities nor should the information be relied upon as investment advice. Past performance is no guarantee of future results. The statistics in this update are based on information believed to be reliable but not guaranteed.
This article is for information purposes. The information contained herein is not, and should not be construed as, investment, tax or legal advice to any party. Investments should be evaluated relative to the individual’s investment objectives and professional advice should be obtained with respect to any circumstance.
The payment of distributions is not guaranteed and may fluctuate. The payment of distributions should not be confused with an Exchange Traded Fund’s performance, rate of return or yield. If distributions paid by the Exchange Traded Fund are greater than the performance of the Exchange Traded Fund, your original investment will shrink. Distributions paid as a result of capital gains realized by an Exchange Traded Fund, and income and dividends earned by an Exchange Traded Fund are taxable in your hands in the year they are paid. Your adjusted cost base will be reduced by the amount of any returns of capital. If your adjusted cost base goes below zero, you will have to pay capital gains tax on the amount below zero. Please refer to the Exchange Traded Funds, distribution policy in the prospectus.
Commissions, management fees and expenses all may be associated with investments in exchange traded funds. Please read the ETF Facts or prospectus before investing. The indicated rates of return are the historical annual compounded total returns including changes in unit value and reinvestment of all dividends or distributions and do not take into account sales, redemption, distribution or optional charges or income taxes payable by any unitholder that would have reduced returns. Exchange traded funds are not guaranteed, their values change frequently and past performance may not be repeated.
For a summary of the risks of an investment in the BMO ETFs, please see the specific risks set out in the prospectus. BMO ETFs trade like stocks, fluctuate in market value and may trade at a discount to their net asset value, which may increase the risk of loss. Distributions are not guaranteed and are subject to change and/or elimination.
BMO ETFs are managed by BMO Asset Management Inc., which is an investment fund manager and a portfolio manager, and a separate legal entity from Bank of Montreal.
BMO Global Asset Management is a brand name under which BMO Asset Management Inc. and BMO Investments Inc. operate.
®/™Registered trademarks/trademark of Bank of Montreal, used under licence.