Factors: Separating the Wheat from the Chaff
As the market fragmentation continues, we examine how factors are chosen and constructed, diving deep into the methodology of strategies that can replace or complement active mandates in your portfolio
Jan 21, 2022
An alternative to active strategies
In previous editions of THE VAULT, we explored factor investing, as well as various strategies to integrate factor-based ETFs into one’s portfolios. In this issue, we will deconstruct the underlying methodologies to reveal how rules-based “smart or factor beta” exposures can enhance returns.
Factors can help family offices and investment counsel firms to screen for, or control, systemic risks, and even eliminate idiosyncratic risks that don’t provide returns. As such, they can be a direct replacement for active mandates, providing both risk mitigation and alpha generation over the long term. However, when evaluating a specific factor, there are several aspects worth taking into consideration:
- Does the characteristic enhance portfolio diversification?
- Is the construction primarily defensive, or does it help complement returns?
- Are there compelling benefits across all market conditions?
- Is it tradeable across the cycle?
Risk and factor investing
Factor analysis can help investors allocate assets to styles that have performed well across different phases of the economic cycle. MSCI has identified six that have excelled consistently over long-term cycles, though with varying levels of risk corresponding to the overall market.
This chart indicates that low volatility, dividend and quality have provided outperformance for less risk relative to the broad index from which they were constructed. by contrast, size, momentum and value have also delivered superior performance, albeit with a higher risk profile than the broad index.
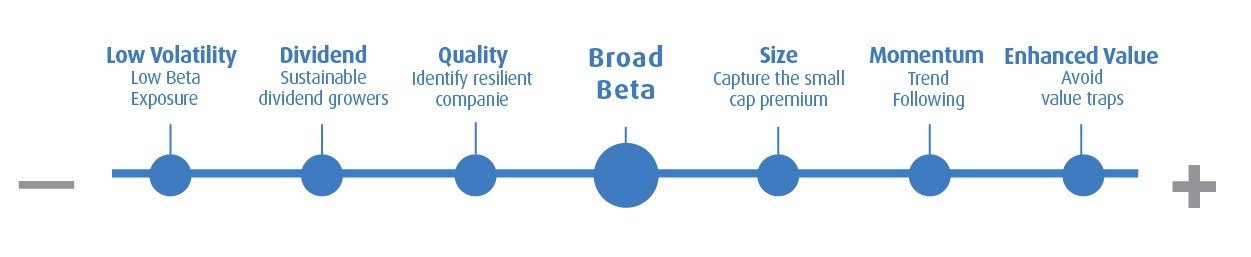
Source: BMO Global Asset Management.
Under the hood: Factor methodologies
It’s important to remember that not all factor-based solutions are built on the same set of rules. As a result, due diligence should evaluate not only the strategy’s objectives but also its underlying methodology, as the latter could create unintended portfolio risk.
As noted above, unconstrained methodologies may lead to additional exposure to sector concentration and interest rate sensitivity (this could occur with Low Volatility or Dividend). Constrained methodologies, on the other hand, may constrain the factor’s effectiveness (and performance) since it may track the parent index’s risk exposure.
BMO’s approach to its factor-based solutions combines both attributes (i.e., objective and weighting), which we use when completing our analysis and making empirical decisions on asset selection. This includes yield-weighting for dividends; a fixed number of securities for both quality and enhanced value, ranked according to relevance; and inverse beta-weighting for low volatility.
Let’s take a closer look at each of these factors in order to gain a better appreciation for their purpose, use case and construction process.
A closer look at low volatility
Low volatility investing is one of the largest and most surprising opportunities to earn alpha. Investors have an inherent belief that return is related to risk, inferring that higher risk should lead to higher returns. However, studies have shown that the low volatility anomaly holds true across markets, with low beta stocks outperforming the broad market over the last 90 years.
This phenomenon challenges the conventional wisdom about risk and return, showing that strategies with a primary focus on capital preservation can actually do better than the broad benchmarks. Moreover, this principle is not localized; it has been observed across the globe. The fact is, low volatility stocks have shallower dips during a market drawdown, which allows their value to compound from a higher level in a rebound and beyond. This is particularly important for Canada, where a large part of the economy is cyclical.
From the outset, our team created a proprietary methodology for low volatility – we’re the only Canadian ETF provider using beta rather than standard deviation or minimum variance as our risk measure. we did this because beta measures systemic risk rather than idiosyncratic risk, an important distinction for institutional investors who manage liabilities and need to remain vigilant of the macro environment.
Furthermore, individual stocks can have a low standard deviation while still having a high beta; there’s no guarantee that they will display a defensive nature in a broad market correction. Standard deviation can vary quite remarkably for a variety of reasons, while beta is a more enduring, predictable measure to manage risk.
Diving into the dividend universe
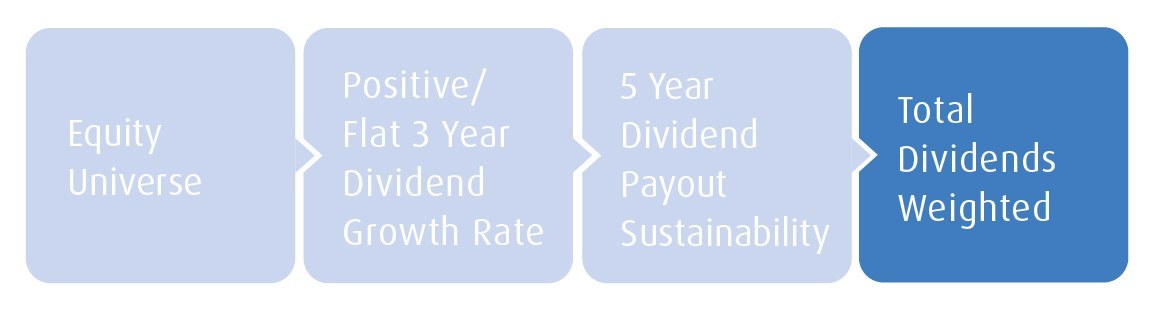
Dividend is another area where we have constructed a proprietary, rules-based methodology, this time focused on sustainable dividend growth. Yield has historically been a significant contributor to total return; evidence shows that the market rewards companies whose management team demonstrates an ability to increase sustainable yields on a consistent basis.
The selection universe consists of those securities that meet market cap and liquidity requirements. From there, we screen for eligible companies that have paid dividends for a minimum of 3 years and have a positive or flat 3-year dividend growth rate. The remaining securities will then be sorted based on the total dividends paid out, helping to reduce the value tilt and capture more capital growth in the portfolio.
The implications of quality factors
Investors looking to generate alpha for their portfolios often focus on earnings growth as an indicator of companies that will outperform. This is captured to some extent in our proprietary Dividend methodology, however it’s more obvious when using the quality screen. Stable earnings growth is the fundamental principle identified by Graham & Dodd, which states that a company can be valued by understanding the predictability and durability of their profit over time (Graham and Dodd, Security Analysis).
The quality factor
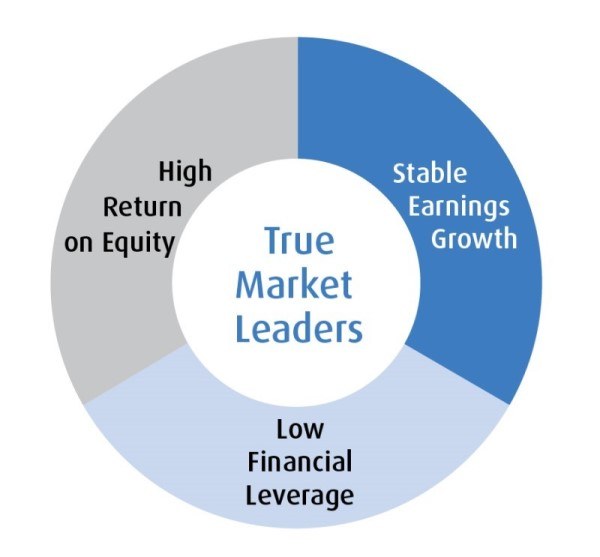
Source: MSCI, June 2, 2021. For illustrative purposes.
- High-quality stocks can be components of well-constructed portfolios
- MSCI defines high-quality stocks as:
- High return on equity (ROE) – “Winners”
- Low earnings variability – “Consistency”
- Low financial leverage – “Can withstand economic downturns”
- Companies tend to have strong, competitive moats
- Screening for these metrics provides access to a portfolio of companies with sustainable, competitive advantages
Although quality is on the lower end of the risk spectrum, as was noted earlier, this factor has generated strong results despite its defensive posture. This can be attributed to the sturdiness of the companies held within the portfolio, their respective balance sheets and their proven track record of sustainable growth, which is backed by long-term tailwinds.
Our methodology ensures that each company is assigned, in equal weights, a quality score consisting of three noteworthy variables – a high return on equity (ROE), low earnings variability and low financial leverage. rather than assigning the portfolio by market capitalization, these quality scores help us to optimize exposure in the index composition.
A unique perspective on value
Value is often one of the most misunderstood factors since investors instinctively assume it is a conservative one that captures companies trading at a discount to the market. However, this may not always be the case. As a pro-cyclical factor, value can be out of favour for extended periods of time but outperform when economies surge.
The BMO MSCI Canada Value Index ETF (ticker: ZVC) and the BMO MSCI USA Value Index ETF (ticker: ZVU) use an enhanced value methodology that employs three critical metrics for assessing the value of a company – low forward price-to-earnings (P/E) and enterprise value-to-cash flow from operations (EV/CFO), both of which eliminate potential value traps, plus a price-to-book (P/B) that’s below average. Sector exposures are maintained in the same proportion to the broad index. The chart below outlines our approach in more detail.
The value factor
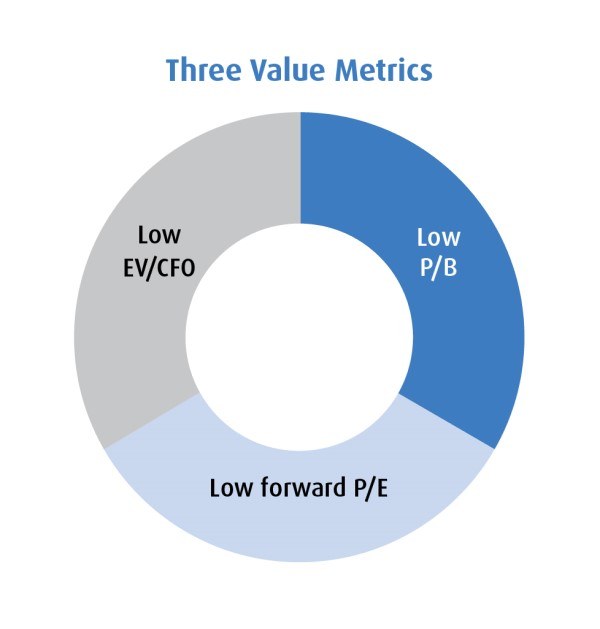
Source: MSCI, July 2021. For illustrative purposes.
- Low forward price-to-earnings (P/E)
- Indicates a company is less expensive than its peers who have similar earnings projections; signals a market mispricing
- Low price-to-book (P/B)
- Identifies companies that are less expensive than their peers
- Low enterprise value-to-cash flow from operations (EV/CFO)
- Enterprise value reflects all sources of capital, debt and equity. Therefore, evaluating enterprise value will screen out companies that are highly financially leveraged. Lower EV companies with high levels of operating cash flow indicate a value company.
The selection universe begins with a neutral parent index and then adjusts towards the value factor by using our three, core metrics equally weighted to a composite z-score, which is then scored by sector, producing a final value score that is multiplied by the company’s market cap.
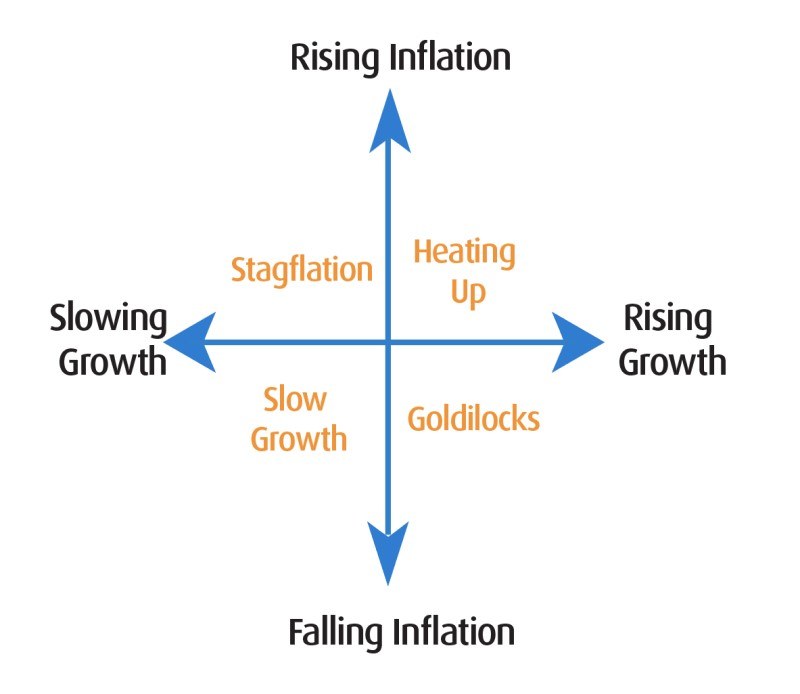
Factors in changing macroeconomic conditions
It’s important to note that not all Factors will have the same macroeconomic drivers as a tailwind. Some will outperform others based on variables like inflation, the interest rate environment and the current phase of the economic cycle. That’s why building a portfolio based in part on each of these 6 factors is key to optimizing returns – and lowering risk.
Smart/factor beta: Factors in changing economic conditions
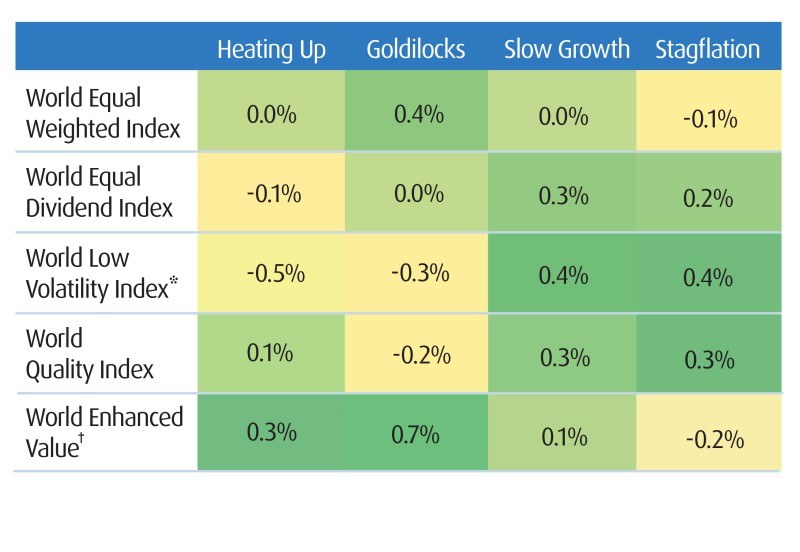
Source: MSCI Inc. Average Monthly Gross Active Returns relative to MSCI World from December 1975 to May 2019. Broad Market Proxy MSCI ACWI Index (USD), Low Volatility Proxy: MSCI ACWI Minimum Volatility Index (USD), Quality Proxy: MSCI ACWI Quality Index (USD), Dividend Proxy: MSCI ACWI High Dividend Yield Index (USD), Value Proxy: MSCI ACWI Enhanced Value Weighted Index (USD).
* Based on official MSCI Minimum Volatility Index levels from May 1988; Low Volatility Tilt Index prior to that.
† Based on MSCI Enhanced Value Index methodology. Prior to 1997, cash earnings to price is used in place of CFO/EV. Before 1994, sector definitions are extended by mapping the Barra model industry classification to the GICS sectors.
The performance of factor exposures also depends on how they are combined. When conducting your due diligence on the suitability of a factor, investment counsellors and family office practitioners should look not only at the macro environment, but the correlation of that factor with the rest of the portfolio.
Fortunately, the proliferation of factor or smart beta ETFs in recent years has led to a wide offering that gives institutional investors the freedom to mix and match products to their specific requirements, requiring little in the way of time, resources or implementation expertise.
When balanced with effective risk management, the research shows clearly that factors optimize performance over the long term. They allow you to separate the wheat from the chaff, ensuring each exposure provides optimal returns for a level of risk.
To learn more about our Factors ETFs, or other ideas to optimize your portfolios, reach out to your BMO ETF Specialist.
Any statement that necessarily depends on future events may be a forward-looking statement. Forward-looking statements are not guarantees of performance. They involve risks, uncertainties and assumptions. Although such statements are based on assumptions that are believed to be reasonable, there can be no assurance that actual results will not differ materially from expectations. Investors are cautioned not to rely unduly on any forward-looking statements. In connection with any forward-looking statements, investors should carefully consider the areas of risk described in the most recent simplified prospectus.
The viewpoints expressed by the authors represents their assessment of the markets at the time of publication. Those views are subject to change without notice at any time without any kind of notice. The information provided herein does not constitute a solicitation of an offer to buy, or an offer to sell securities nor should the information be relied upon as investment advice. Past performance is no guarantee of future results. The statistics in this update are based on information believed to be reliable but not guaranteed.
This article is for information purposes. The information contained herein is not, and should not be construed as, investment, tax or legal advice to any party. Investments should be evaluated relative to the individual’s investment objectives and professional advice should be obtained with respect to any circumstance.
The BMO ETFs or securities referred to herein are not sponsored, endorsed or promoted by MSCI Inc. (“MSCI”), and MSCI bears no liability with respect to any such BMO ETFs or securities or any index on which such BMO ETFs or securities are based. The prospectus of the BMO ETFs contains a more detailed description of the limited relationship MSCI has with BMO Asset Management Inc. and any related BMO ETFs.
Commissions, management fees and expenses all may be associated with investments in exchange traded funds. Please read the ETF Facts or prospectus before investing. The indicated rates of return are the historical annual compounded total returns including changes in unit value and reinvestment of all dividends or distributions and do not take into account sales, redemption, distribution or optional charges or income taxes payable by any unitholder that would have reduced returns. Exchange traded funds are not guaranteed, their values change frequently and past performance may not be repeated.
For a summary of the risks of an investment in the BMO ETFs, please see the specific risks set out in the prospectus. BMO ETFs trade like stocks, fluctuate in market value and may trade at a discount to their net asset value, which may increase the risk of loss. Distributions are not guaranteed and are subject to change and/or elimination.
BMO ETFs are managed by BMO Asset Management Inc., which is an investment fund manager and a portfolio manager, and a separate legal entity from Bank of Montreal.
BMO Global Asset Management comprises BMO Asset Management Inc. and BMO Investments Inc.
®/TMRegistered trade-marks/trade-mark of Bank of Montreal, used under licence.