Getting Tactical with Sector ETFs
With the rising tide of easy money now in the past, many investors are looking for satellite exposures to re-position their portfolios for the late cycle — or even perhaps a recession. Erika Toth, Director, Institutional & Advisory, BMO ETFs, offers a closer look at which sectors are best suited to the current environment, and the benefits of accessing them in a single trade.


Heightened demand for sector ETFs
To say markets were volatile in the first half of 2022 would be an understatement. In addition, as of Friday June 30, U.S. stocks had their worst first-half year since 1970, as the S&P 500 sank by 21%.
High inflation — plus aggressive tightening by central banks — have caused pullbacks in asset values. We also saw oil prices surge due to Russia’s invasion of Ukraine and renewed demand from economic re-openings — which in turn caused a ramp-up in production costs, other commodity prices and ongoing supply chain issues.
As a result, we’ve seen growing demand for sector ETFs, as portfolio managers seek ways to be more tactical and targeted in their allocations by, for example, adding commodity exposure to their holdings. Sector ETFs can also help investors get tactical in a hurry, allowing them to quickly over- or underweight sectors with a single trade as the market evolves. The chart below provides an excellent overview as to which sectors tend to generate alpha during each stage of the economic cycle, offering investors a good baseline from which to start their analysis.
How to use sector ETFs across market cycles

Tracking inflows to sector ETFs
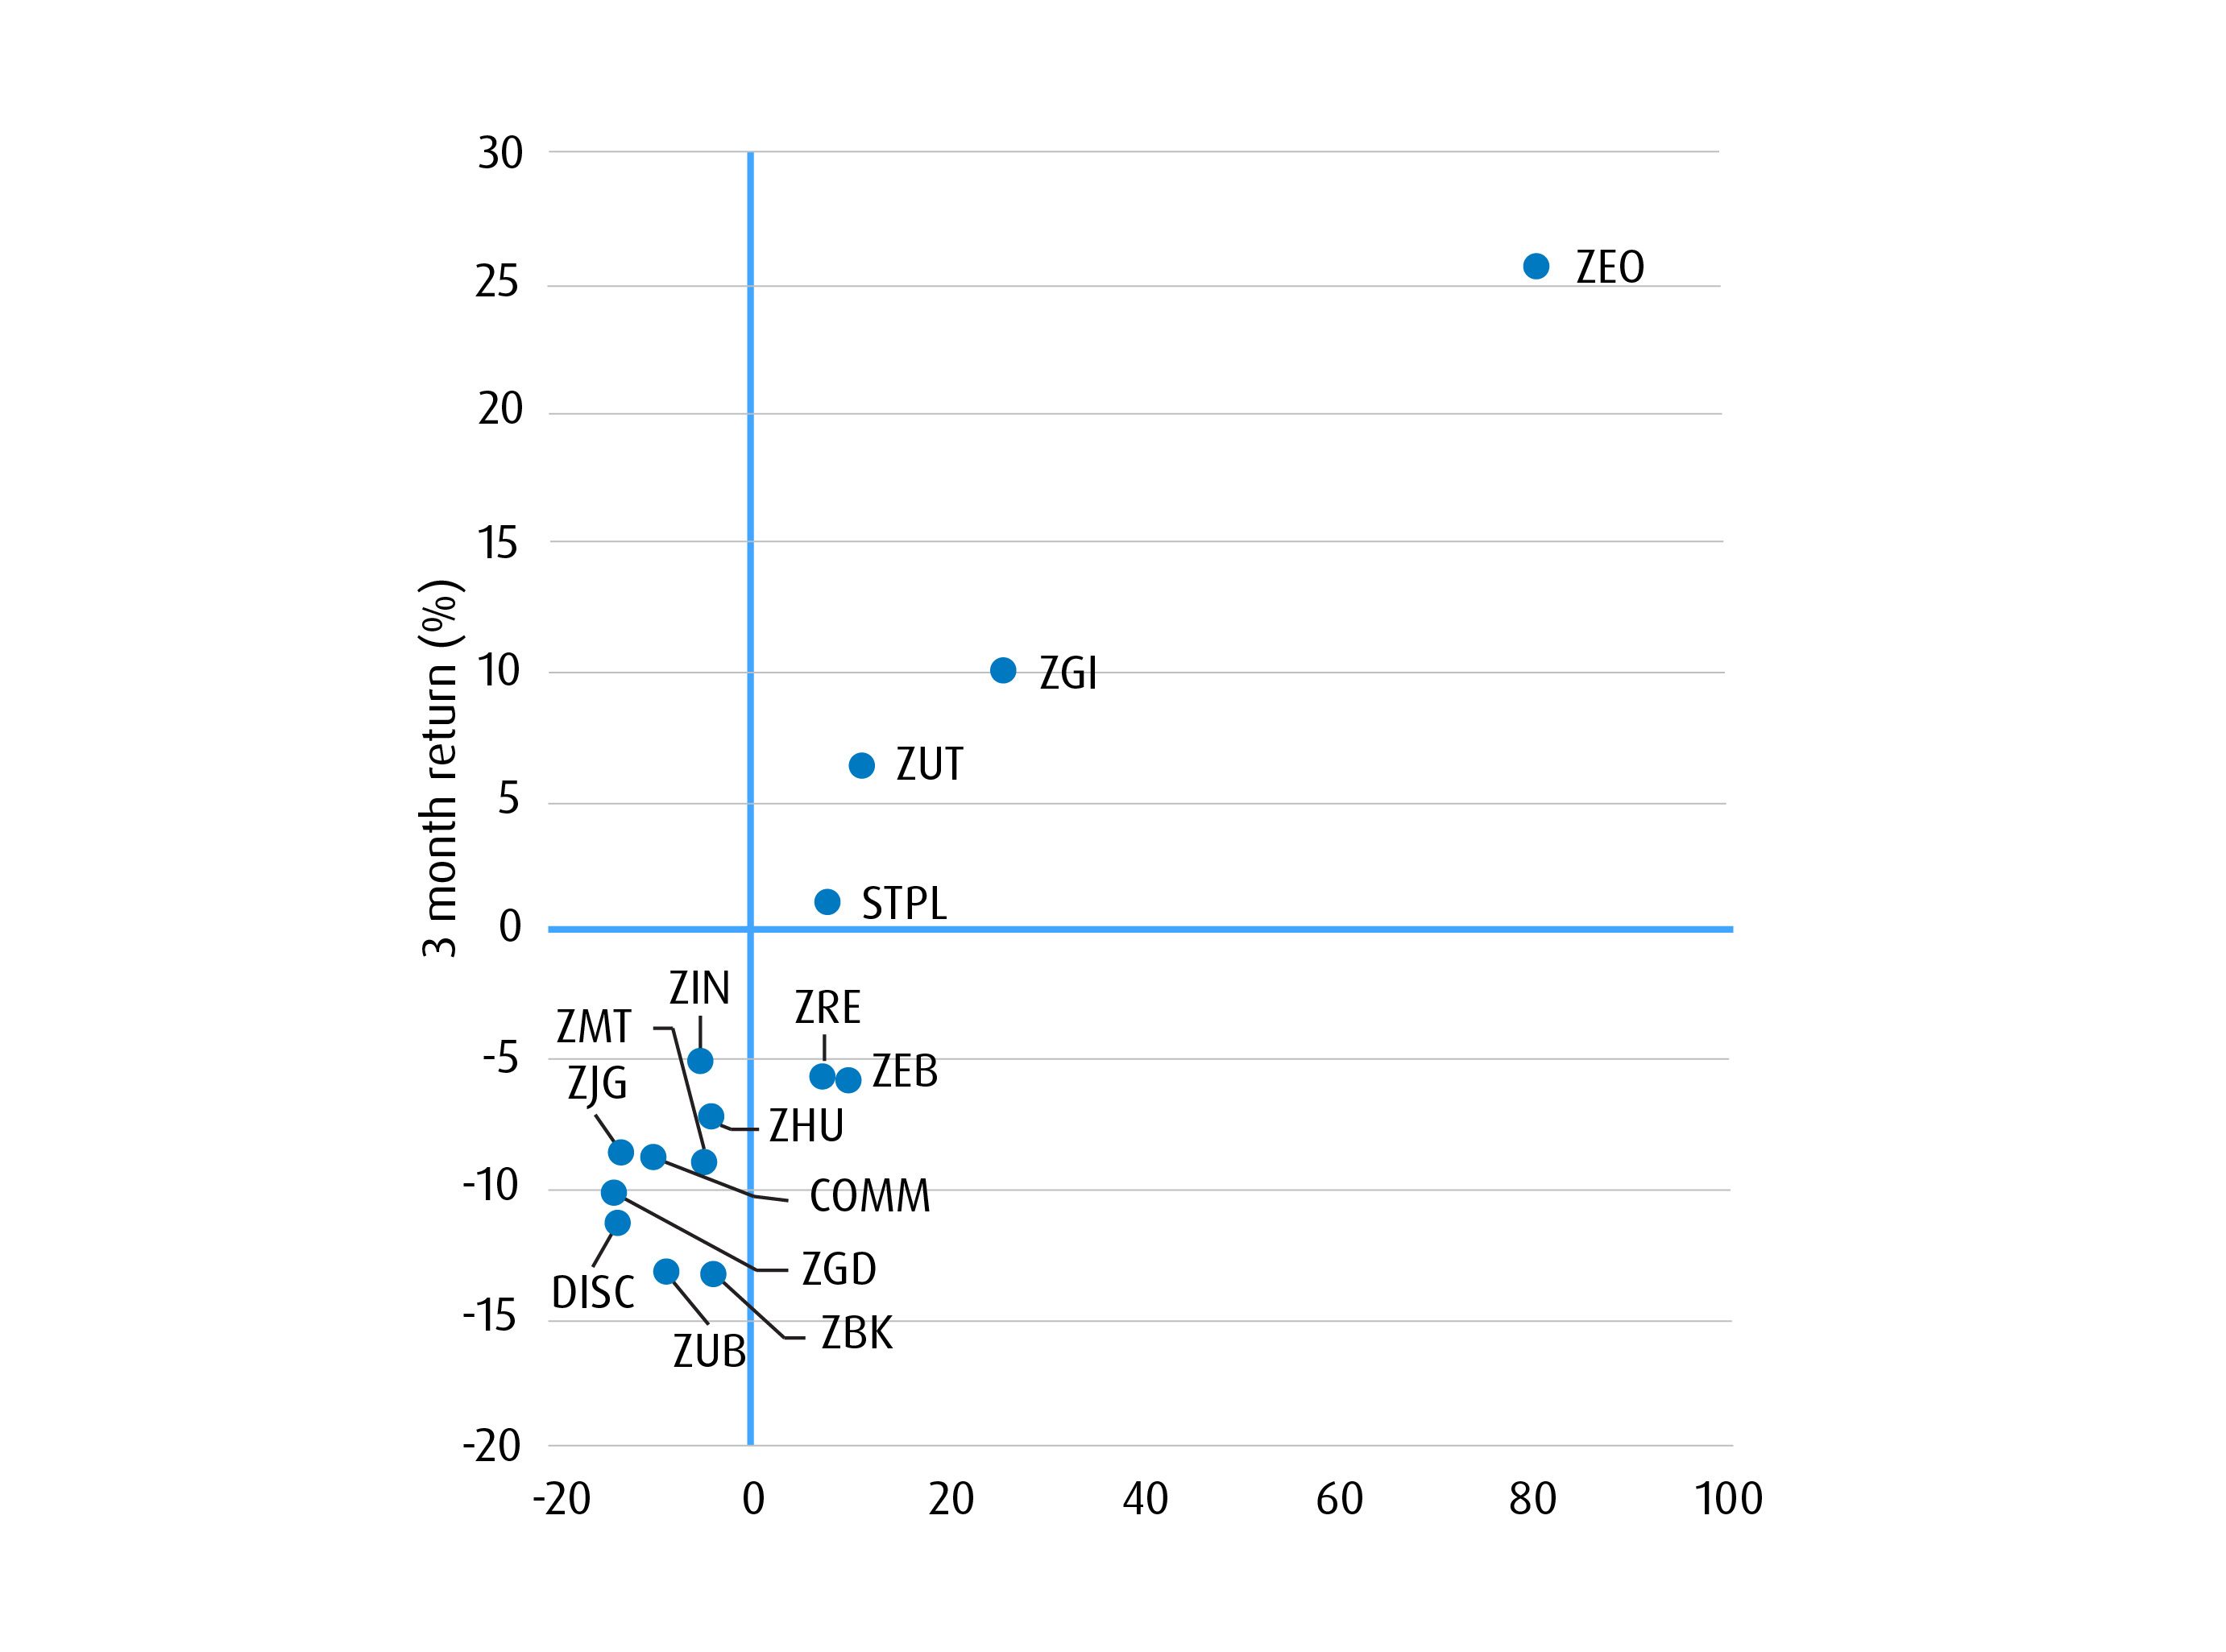
Technology and growth-oriented stocks have led the pack for several years, but lately we’ve seen investors rotate away from this paradigm and move in a new direction. Over the first two quarters of the year, Energy and more defensive sectors — such as infrastructure, utilities and consumer staples — have outperformed the broader market on a relative basis.
Of those aforementioned sectors, Energy is the only one that’s considered cyclical, meaning that it typically underperforms during a market slowdown. Case in point: U.S. crude oil future tanked in 2020 at the beginning of the COVID-19 lockdowns, going as low as minus $40 at one point because: a) everything was closed and oil demand shrank considerably, and b) investors perceived that a bear market was on the horizon. That bear market turned out to be short-lived, and oil prices quickly bounced back, but that moment is illustrative of how oil prices typically perform during economic slowdowns.
This time appears to be different. The conflict in Ukraine and other supply-side shocks have driven oil prices higher in recent months. In fact, the chart below shows that our equal weight oil exposure, ZEO, was an outlier in performance for both 1-year and 3-months because demand continues to grow and supply remains stuck in neutral. Even oil-producing countries that are free from conflict, such as those in OPEC, are not speeding up production fast enough to match demand.1 In the U.S., where gas prices are cresting $5 a gallon, the situation is so dire that U.S. President Joe Biden had to release a letter urging oil producers and refiners to increase higher production levels.2
Industry sectors
Contrast energy with other sectors of the market. Areas like technology, U.S. banks and consumer discretionary have suffered the most from interest rate hike policies. But it remains to be seen whether monetary policy tightening to reign in the effects of years of quantitative easing (and now stubborn inflation) will result in a recession and ultimately the beginning of a new market cycle.
Capitalizing on opportunities outside of Canadian equities
In all of these scenarios, sector ETFs remain excellent tools to tilt your portfolio without making significant changes to the core, high conviction holdings. Rather than having to radically reform your strategic allocation, ETFs allow for targeted, complementary investments that can be easily added or removed to suit changes in the economic cycle.
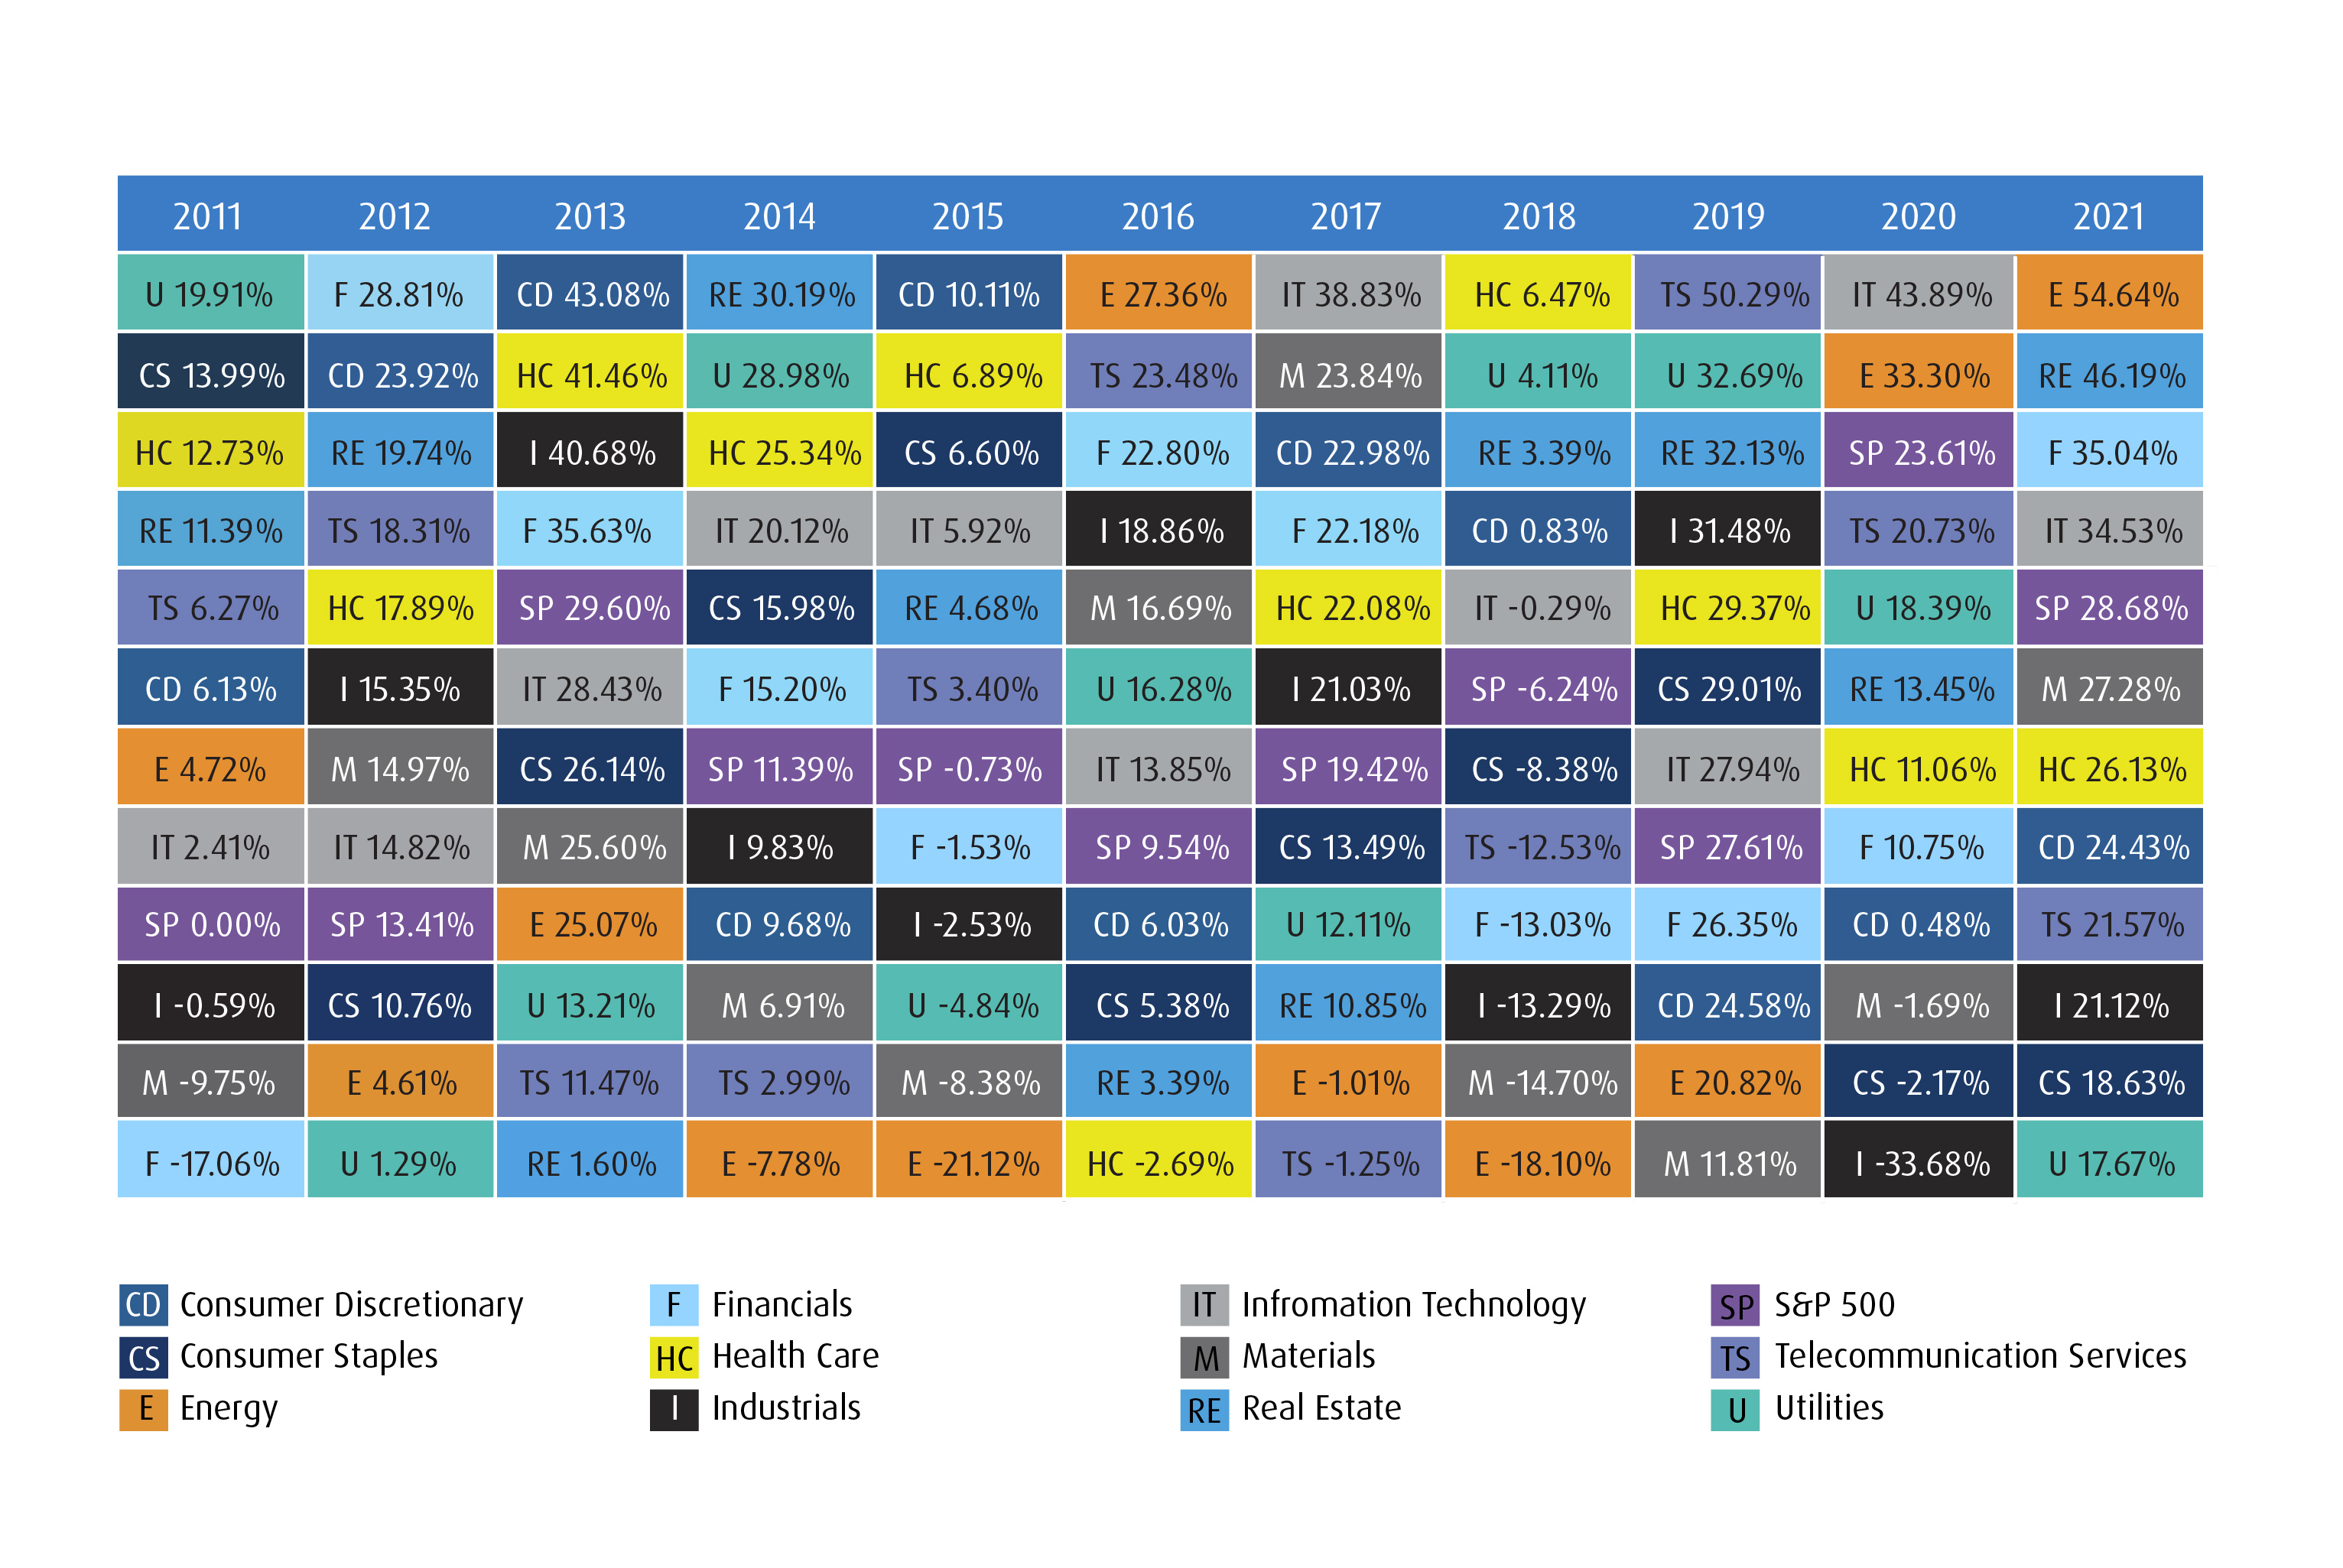
The ease of implementing precise exposures can be an enormous advantage to family offices and investment counsellors who specialize in managing portfolios of Canadian stocks, especially given that relative performance between asset classes tends to differ wildly from year to year. Canadian equities have certainly been a bright spot in this year’s volatile markets so far, but that’s not necessarily predictive of how they will perform going forward. As shown in the chart below, Healthcare went from being the bottom of list in 2016 to the top-performer in 2018, and the only differences were the macroeconomic conditions at play, such as when the Federal Reserve began raising rates.
Sector ETFs that offer global exposures may be a more efficient and practical way to pivot portfolios tactically than researching and buying individual names, which is itself a resource-intensive approach to investing. This way, family offices and investment counsellors do not have to shift away from their core competencies in order to add satellite sector exposures when market conditions warrant a change in position.
Sector returns by year (2011−2021)
The case for equal weighting
Instead of allocating by market cap, which can result in a size tilt in the portfolio, our sector ETFs use equal weighting across a basket of high-quality names. This provides ample diversification while also reducing concentration and tends to enhance performance over time. Meanwhile, regular rebalancing of the strategy ensures that holdings that are doing well can be sold high, and that the proceeds can be reinvested to keep the slit even across the holdings.
For highly concentrated markets and sectors, such as Canada, for example, equal weighting is a powerful index construction methodology both to mitigate individual security concentration and to properly diversify sector exposures. This approach can also help increase dividend yield and total returns over time.
Being able to respond tactically during times when the market is in flux is critical to maximizing the value of your portfolio. That means being able to increase or decrease exposure to a variety of equities based on sector, region, etc., in order to respond to shifting market conditions.
BMO offers a robust tool kit of sector ETFs, ranging from Canadian to US to global, from defensive to cyclical, and from equal weighted to cap weighted — all of which can help portfolio managers to target precise segments and make tactical shifts to efficiently respond to changing market environments.
Please contact your BMO ETF Institutional Specialist to learn more about how our Sector ETF products can help you add alpha for your clients. Our Portfolio Managers are also available to help with trading insights. They can also be reached at 1−877−741−7263.
| Name | Ticker | Inception Date | YTD | 3 MO | 6 MO | 1 YR | 3 YR | 5 YR | Since Inception |
| BMO Equal Weight Oil & Gas ETF | ZEO | 2009-10-20 | 33.3 | 2.2 | 33.3 | 46.5 | 18.3 | 7.0 | 0.0 |
| BMO Global Infrastructure ETF | ZGI | 2010-10-19 | 1.5 | -4.3 | 1.5 | 12.4 | 7.1 | 7.1 | 11.9 |
| BMO Junior Gold ETF | ZJG | 2010-01-19 | 7.6 | 6.6 | 8.2 | 10.4 | 14.2 | 6.0 | -2.0 |
| BMO Equal Weight Utilities ETF | ZUT | 2010-01-19 | 2.9 | -1.7 | 2.9 | 5.5 | 15.5 | 11.4 | 9.1 |
| BMO Global Consumer Staples H CAD ETF | STPL | 2017-04-03 | -3.5 | -1.2 | -3.5 | 4.1 | 6.9 | - | 5.3 |
BMO Global Communications ETF | COMM | 2018-05-02 | -8.3 | -6.3 | -11.8 | -1.5 | 11.4 | - | 10.8 |
| BMO Equal Weight Banks ETF | ZEB | 2009-10-20 | -10.5 | -13.2 | -10.5 | -1.7 | 10.8 | 8.9 | 10.6 |
| BMO Equal REITs ETF | ZRE | 2010-05-19 | -17.0 | -17.8 | -17.0 | -7.9 | 3.7 | 7.4 | 8.8 |
| BMO Equal Weight US Banks ETF | ZBK | 2014-02-10 | -20.6 | -14.2 | -20.6 | -11.3 | 5.1 | 5.2 | 9.7 |
| BMO Equal Weight Industrials ETF | ZIN | 2012-11-14 | -13.9 | -12.7 | -13.9 | -12.7 | 4.1 | 6.8 | 9.7 |
| BMO Equal Weight US Health Care ETF | ZHU | 2019-02-12 | -19.2 | -10.2 | -19.2 | -13.3 | 7.2 | - | 6.6 |
| BMO Eq Weight US Banks Hedged to CAD ETF | ZUB | 2010-05-19 | -22.3 | -17.1 | -22.3 | -15.1 | 3.5 | 3.4 | 7.1 |
| BMO Equal Weight Global Gold ETF | ZGD | 2012-11-14 | -15.1 | -27.5 | -15.1 | -15.4 | 5.3 | 4.3 | -2.3 |
| BMO Eq Wght US HlthCare Hdgd to CAD ETF | ZUH | 2010-05-19 | -21.0 | -13.1 | -21.0 | -17.1 | 6.9 | 7.5 | 13.5 |
| BMO Equal Weight Glbl BM Hdgd to CAD ETF | ZMT | 2009-10-20 | -18.7 | -32.9 | -18.7 | -19.7 | 1.1 | -0.5 | -3.5 |
| BMO Global Consumer Discrt H CAD ETF | DISC | 2017-04-03 | -28.2 | -20.1 | -28.2 | -23.1 | 4.8 | - | 7.3 |
Source: Morningstar Direct, June 30, 2022.
Early recovery
| ETF Name | Ticker | Geography | Portfolio Construction | Beta* | MER |
| BMO Equal Weight US Banks Hedged to CAD Index ETF | ZUB | U.S | Equal Weighted | 1.29 | 0.38% |
| BMO Equal Weight US Banks Index ETF | ZBK | U.S | Equal Weighted | 1.10 | 0.38% |
| BMO Equal Weight Banks Index ETF | ZEB | Canada | Equal Weighted | 0.96 | 0.28%** |
| BMO Covered Call Canadian Banks ETF | ZWB | Canada | Equal Weighted with Options | 0.93 | 0.72% |
| BMO Global Consumer Discretionary Hedged to CAD Index ETF | DISC | Global | UCITS | 1.00 | 0.40% |
| BMO Equal Weight REITS Index ETF | ZRE | Canada | Equal Weighted | 1.06 | 0.61% |
| BMO Covered Call US Banks ETF | ZWK | U.S. | Equal Weighted with Options | 1.07 | 0.71% |
Mid-cycle
| ETF Name | Ticker | Geography | Portfolio Construction | Beta* | MER |
| BMO Equal Weight Industrials Index ETF | ZIN | Canada | Equal Weighted | 1.10 | 0.61% |
| BMO NASDAQ 100 Equity Hedged to CAD Index ETF | ZQQ | U.S. | Market Capitalization Weighted | 0.95 | 0.39% |
| BMO NASDAQ 100 Equity Index ETF | ZNQ | U.S. | Market Capitalization Weighted | 1.00 | 0.38% |
| BMO Equal Weight Oil & Gad Index ETF | ZEO | Canada | Equal Weighted | 1.38 | 0.61% |
Late-cycle
| ETF Name | Ticker | Geography | Portfolio Construction | Beta* | MER |
| BMO Global Communications Index ETF | COMM | Global | UCITS | 0.76 | 0.40% |
| BMO Equal Weight Global Gold Index ETF | ZGD | Global | Equal Weighted | 0.92 | 0.61% |
| BMO Equal Weight Global Base Metals Hedged to CAD Index ETF | ZMT | Global | Equal Weighted | 1.48 | 0.61% |
Recession
| ETF Name | Ticker | Geography | Portfolio Construction | Beta* | MER |
| BMO Covered Call Utilities ETF | ZWU | Canada | Equal Weighted with options | 0.92 | 0.71% |
| BMO Equal Weight Utilities Index ETF | ZUT | Canada | Equal Weighted | 0.95 | 0.61% |
| BMO Global Consumer Staples Hedged to CAD Index ETF | STPL | Global | UCITS | 0.72 | 0.40% |
| BMO Equal Weight US Health Care Hedged to CAD Index ETF | ZUH | U.S. | Equal Weighted | 0.97 | 0.39% |
| BMO Equal Weight US Health Care Index ETF | ZHU | U.S. | Equal Weighted | 0.74 | 0.39% |
MERs as of Dec 31 2021.
BETA is a measure of the volatility - or systemic risk - of a security or portfolio compared to the market as a whole
* 3-year historical beta, as of Feb 28, Bloomberg.
**During the last year the management fee of this ETF was reduced. The adjusted MER is 0.28% and represents an estimate of what the MER would have been had the change been in effect during the full financial
Disclosures:
Any statement that necessarily depends on future events may be a forward-looking statement. Forward-looking statements are not guarantees of performance. They involve risks, uncertainties and assumptions. Although such statements are based on assumptions that are believed to be reasonable, there can be no assurance that actual results will not differ materially from expectations. Investors are cautioned not to rely unduly on any forward-looking statements. In connection with any forward-looking statements, investors should carefully consider the areas of risk described in the most recent simplified prospectus.
The viewpoints expressed by the Portfolio Manager represents their assessment of the markets at the time of publication. Those views are subject to change without notice at any time without any kind of notice. The information provided herein does not constitute a solicitation of an offer to buy, or an offer to sell securities nor should the information be relied upon as investment advice. Past performance is no guarantee of future results. This communication is intended for informational purposes only.
The communication is for information purposes. The information contained herein is not, and should not be construed as, investment, tax or legal advice to any party. Particular investments and/or trading strategies should be evaluated relative to the individual’s investment objectives and professional advice should be obtained with respect to any circumstance.
NASDAQ®, and NASDAQ-100 Index® or NASDAQ-100 Index® Hedged to CAD, are registered trademarks of Nasdaq, Inc. (which with its affiliates is referred to as the“Corporations”) and are licensed for use by the Manager. The ETF(s) have not been passed on by the Corporations as to their legality or suitability. The ETF(s) are not issued, endorsed, sold, or promoted by the Corporations. The Corporations make no warranties and bear no liability with respect to the ETF(s).
Commissions, management fees and expenses all may be associated with investments in BMO ETFs and ETF Series of the BMO Mutual Funds. Please read the ETF facts or prospectus of the relevant BMO ETF or ETF Series before investing. The indicated rates of return are the historical compounded total returns including changes in share or unit value and the reinvestment of all dividends or distributions and do not take into account the sales, redemption, distribution, optional charges or income tax payable by the unitholder that would have reduced returns BMO ETFs and ETF Series are not guaranteed, their values change frequently and past performance may not be repeated.
For a summary of the risks of an investment in the BMO ETFs or ETF Series of the BMO Mutual Funds, please see the specific risks set out in the prospectus. BMO ETFs and ETF Series trade like stocks, fluctuate in market value and may trade at a discount to their net asset value, which may increase the risk of loss. Distributions are not guaranteed and are subject to change and/or elimination.
BMO ETFs are managed by BMO Asset Management Inc., which is an investment fund manager and a portfolio manager, and a separate legal entity from Bank of Montreal. ETF Series of the BMO Mutual Funds are managed by BMO Investments Inc., which is an investment fund manager and a separate legal entity from Bank of Montreal.
BMO Global Asset Management is a brand name that comprises BMO Asset Management Inc. and BMO Investments Inc.
®/ ™ Registered trademarks/trademark of Bank of Montreal, used under licence.