How CRM3 is reshaping Advisors’ core portfolios

Asset Allocation ETFs have been a key area of growth in the Canadian ETF marketplace over the last several years — that growth accelerated meaningfully in 2025 and the trend continues into this year.
Demand was initially driven by DIY investors. Their popularity first started to take off during the pandemic-era boom in online investing. However, the landscape has since evolved. While they remain popular with self-directed investors, many Advisors that we speak with say the appeal is growing more widespread.
This article examines why Advisors are increasingly incorporating these all-in-one products across their books and outlines key questions to consider as part of the Know Your Product (KYP) process.
CRM3 and flows — history in the making
In 2025, ETF net flows in Canada reached $125 billion, a record high. Asset Allocation ETFs also had a banner year at $10.5 billion, accounting for 16% of equity ETF inflows and emerging as one of the major themes across the industry.i
Upcoming regulatory changes for Total Cost Reporting (TCR) have been a meaningful catalyst in the advisor community towards low-cost core investment products. If January’s flows are any indication, that tailwind may only strengthen further this year with CRM3 reforms set to hit client statements in January 2027.
A great many advisors consulted with over the last few months have indicated they are in the process of reviewing the higher-cost funds and ETFs on their books. The asset-weighted industry average expense ratio is 0.86%.ii An all-in one global exposure at approximately one-fifth of that cost represents a material difference — for both clients and Advisors. As a result, many are conducting due diligence to optimize their portfolios with lower-cost solutions that provide similar overall exposures.
How usage has evolved
When BMO first launched its Asset Allocation ETFs in 2020, Advisors were utilizing them as small-account solutions. Think RESPs, TFSAs and starter investments for their clients’ children. Today, usage has expanded. More Advisors are allocating a portion of the core of their models into Asset Allocation (AA) ETFs for the efficiencies they bring:
- Broad index exposure across all major world markets
- Automatic rebalancing
- A CRM3-friendly price tag
Some advisors are replacing portions of their higher-fee actively managed global equity or global balanced funds with AA ETFs. Others are migrating from individual index ETFs for each allocation (eg, Canada, US, International, fixed income) in favour of a single AA ETF. For the latter group, the motivation is often operational efficiency rather than fee saving alone.
The growing case for index-oriented core allocation
The rise in index-oriented investing is driven by two factors:
- The principle that lower investment fees mean keeping more in one’s pocket and compounding that difference over time, and
- Data around how difficult it is for active managers to consistently outperform their respective broad indexes over long-term holding periods. As shown in the SPIVA Scorecard report below,iii the longer the time horizon you look at, the harder it is for a manager to outperform.
To be sure, active management can still play an important complementary role in portfolio construction. Advisors may wish to use it to reduce volatility or access specific areas such as high yield, high-growth stocks or small- and mid-cap stocks. However, SPIVA data reinforces allocating at least a portion of the portfolio core into broad-based index or Asset Allocation ETFs.
Report 1a: Percentage of Funds Underperforming Their Benchmarks (Based on Absolute Return)
| Fund Category | Comparison Index | YTD (%) | 1-Year (%) | 3-Year (%) | 5-Year (%) | 10-Year (%) |
| Canadian Equity | S&P TSX Composite Index | 69.74 | 94.67 | 93.67 | 84.51 | 97.65 |
| Canadian Focused Equity | 50% S&P/TSX Composite Index + 25% S&P 500 (CAD) + 25% S&P EPAC LargeMidCap (CAD) | 94.83 | 98.39 | 93.85 | 78.26 | 99.07 |
| Canadian Dividend & Income Equity | S&P/TSX Canadian Dividend Aristocrats Index | 44.23 | 98.04 | 91.23 | 96.77 | 93.94 |
| Canadian Small/Mid-Cap Equity | S&P/TSX Completion Index | 100.00 | 100.00 | 96.77 | 75.76 | 88.64 |
| U.S. Equity | S&P500 (CAD) | 71.43 | 85.48 | 84.03 | 98.64 | 96.35 |
| International Equity | S&P EPAC LargeMidCap (CAD) | 85.53 | 82.43 | 91.78 | 94.20 | 94.44 |
| Global Equity | S&P World (CAD) | 66.14 | 87.50 | 95.93 | 96.00 | 98.26 |
Source: S&P Dow Jones Indices LLC, Fundata. Data for periods ending June 30, 2025. Outperformance is based on equal-weighted fund counts. Index performance based on total return. Past performance is no guarantee of future results. Table is provided for illustrative purposes.
BMO Asset Allocation ETFs Performance
Trailing Returns
| Ticker | 1 Month | 3 Months | 6 Months | YTD | 1 Year | 2 Years | 3 Years | 5 Years | 10 Years | Since Inception | Inception Date | |
|---|---|---|---|---|---|---|---|---|---|---|---|---|
| BMO All-Equity ETF | ZEQT | 1.98 | 2.42 | 12.97 | 1.98 | 17.42 | 22.75 | 19.02 | — | — | 13.97 | 1/24/2022 |
| BMO Growth ETF | ZGRO | 1.66 | 1.85 | 10.82 | 1.66 | 14.39 | 18.85 | 15.78 | 11.02 | — | 11.13 | 2/12/2019 |
| BMO Balanced ETF | ZBAL | 1.34 | 1.28 | 8.68 | 1.34 | 11.37 | 14.95 | 12.52 | 8.08 | — | 8.70 | 2/12/2019 |
| BMO Conservative ETF | ZCON | 1.02 | 0.71 | 6.56 | 1.02 | 8.40 | 11.13 | 9.29 | 5.18 | — | 6.27 | 2/12/2019 |
As of January 31, 2026
A reminder on the importance of diversification
Another clear trend over the last year and into this year has been flows toward international equities. Part of this reflects backward-looking performance after one of the strongest-ever years on record for international equity returns. There has also been a palpable shift in geopolitical sentiment. U.S. equities, which dominated global equity market returns for the last decade, have now reached rich valuations and high concentration.
History offers perspective here. If we look at the decade prior, it was actually emerging market equities at the top of the leaderboard. Go back further still and you will find U.S. equities experienced their “lost decade.” All of these are good reminders on the importance of having a disciplined approach to diversification in place.
A picture is worth a thousand words
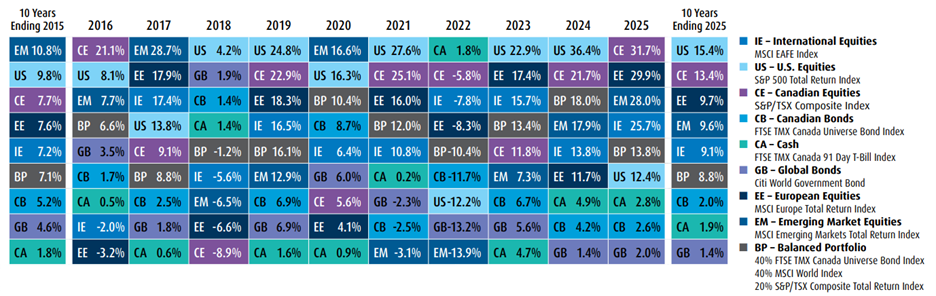
International equities have been the top-selling equity asset class year-to-date and throughout 2025, representing approximately half of all equity ETF flows.
Despite that, many advisors prefer to get their international equity allocation in an all-in-one vehicle, such as BMO All-Equity ETF (ZEQT), BMO Growth ETF (ZGRO) or BMO Balanced ETF (ZBAL) rather than determining ex-North America allocations independently and having to monitor and rebalance that regularly.
Know Your Product: How are BMO’s Asset Allocation ETFs unique?
Lowest fees: Having cut management fees to 0.15% from 0.18% in June 2025 on ZEQT, ZGRO, ZBAL and BMO Conservative ETF (ZCON), BMO now has the lowest cost asset allocation ETFs of the largest ETF providers in Canada. The three other largest providers’ management fees on comparable all-equity ETFs, for illustration, are 0.17%,i 0.17%ii and 0.39%.iii
- Please note: published Management Expense Ratios (MERs) on ETF fact sheets reflect full year 2024, as of February 17, 2026. These are updated once annually upon prospectus renewal. Projected estimated MERs ~0.17%
Tax efficiency: BMO uses discount bond ETFs for its fixed income allocations, which minimizes the amount of interest income and makes the BMO AA suite a more tax-efficient choice for investors looking to purchase in non-registered accounts. To illustrate:
- BMO Discount Bond Index ETF (ZDB), which is held in the AA ETFs average coupon 1.84%, 3.39% YTM. This is a more tax-efficient option than BMO Aggregate Bond Index ETF (ZAG): average coupon is 3.45%, 3.55% YTM
- Investors pay tax on the coupons received which are categorized as interest income
- Both products offer identical duration (~7 years), and government vs corporate bond exposure weights (75% government, 25% corporate), and carry a AA average credit rating.
- BMO US Aggregate Bond Index ETF (Hedged Unit) (ZUAG.F), which is the US fixed income bond exposure, has an average coupon of 2.84% and YTM of 4.39%, which is also at a tax advantage (discount to par position)
6% Target Cash Flow units: BMO is the only provider to offer the .T series ETF purchase option — which offers the same high quality broad index exposures, with regular monthly cash flows of 6%iv—all while keeping costs low.
Buy Canadian: Of the largest ETF providers in Canada, BMO is the only Canadian asset manager. Our tickers start with the letter Z — which we pronounce ‘Zed’, not ‘Zee’ — because we’re proud of our heritage.
Key considerations for Advisors
- Are you currently in the process of reviewing your fund and ETF allocations across your book in preparation for CRM3?
- Are you looking for an in-depth analysis of how the Asset Allocation ETFs from the major Canadian providers compare?
Contact your BMO GAM wholesaler to find out how we can help you do that, leveraging the expertise of our ETF Specialist and Portfolio Consulting teams for an unbiased review.
[i] As per National Bank Capital Markets, as of January 31, 2026.
[ii] Morningstar, Canada Fund Fee Study: A comprehensive look at investment fund fees in Canada, 2025.
[iii] SPIVA Canada Mid-Year 2025 Scorecard
[iv] Vanguard All-Equity ETF Portfolio (VEQT), as of February 17, 2026.
[v] iShares Core Equity ETF Portfolio (XEQT), as of February 17, 2026.
[vi] Fidelity All-in-One Equity ETF (FEQT), as of February 17, 2026.
[vii] The Target Cash Flow Units’ distribution yield rate is not guaranteed and is potentially subject to change. The target distribution yield rate is not an indicator of overall performance and the value of your investment in the BMO ETF may decline over time.
DISCLAIMER
This material is for information purposes. The information contained herein is not, and should not be construed as, investment, tax or legal advice to any party. Investments should be evaluated relative to the individual’s investment objectives and professional advice should be obtained with respect to any circumstance.
Any statement that necessarily depends on future events may be a forward-looking statement. Forward-looking statements are not guarantees of performance. They involve risks, uncertainties and assumptions. Although such statements are based on assumptions that are believed to be reasonable, there can be no assurance that actual results will not differ materially from expectations. Investors are cautioned not to rely unduly on any forward-looking statements. In connection with any forward-looking statements, investors should carefully consider the areas of risk described in the most recent prospectus.
The Target Cash Flow Units are subject to capital depletion risk. Target Cash Flow Units make monthly distributions of a fixed amount which may comprise, in whole or in part, of a return of capital (“ROC”). A ROC reduces the amount of an original investment and may result in the return to investors of the entire amount of an original investment. A ROC that is not reinvested will reduce the NAV of the BMO ETF, which could reduce the BMO ETF’s ability to generate future income. Investors should not draw any conclusions about the BMO ETF’s investment performance from the amount of this distribution. A ROC can only be made by a series of a BMO ETF to the extent that there is a positive balance in the capital account for the relevant series. To the extent that the balance in the capital account becomes, or is at risk of becoming, zero, monthly distributions may be reduced or discontinued without prior notice.
The dollar amount of the monthly distribution that investors will receive is reset at the beginning of each calendar year. The dollar amount is a factor of the annualized distribution rate for the Target Cash Flow Units (which is the rate set out in the individual BMO ETF profiles in the simplified prospectus of the BMO ETFs), the NAVPS as of the end of the previous calendar year, and the number of Target Cash Flow Units of the BMO ETF held at the time of the distribution.
Although not expected, we may also adjust the monthly distribution during the year, if capital market conditions have significantly affected the ability of the BMO ETF to maintain the applicable distribution. If we make any such adjustment to the monthly distribution, we will issue a press release to communicate the change.
The distribution rate applicable to the Target Cash Flow Units may be higher than the rate of return or the portfolio yield of the BMO ETF that offers such Units. As a result, if investors elect to receive some or all of the regular monthly distributions in cash, the value of their investment in the BMO ETF may decline over time.
Distributions from Target Cash Flow Units will include a ROC. A ROC does not necessarily reflect the BMO ETF’s investment performance and should not be confused with “yield” or “income”. Investors should not draw any conclusions about the BMO ETF’s investment performance from the amount of these distributions. A ROC does not create an immediate tax liability, but it reduces investors’ Adjusted Cost Base (ACB) over time; this may affect taxes when the investment is sold. Investors should consult a tax advisor.
For BMO ETFs generally, distribution yields are calculated using the most recent regular distribution, or expected distribution (which may be comprised of income, dividends, return of capital, and option premiums, as applicable), annualized for frequency and divided by current NAV. Distribution yield calculations exclude additional year‑end distributions, special reinvested distributions, and reinvested distributions.
Distributions are not guaranteed, may fluctuate, and may be changed or eliminated at any time without notice due to market conditions, NAV fluctuations, or other factors. If distributions paid by a BMO ETF exceed the performance of the ETF, an investor’s original investment will shrink. Distributions paid as income, dividends, or capital gains realized by a BMO ETF are generally taxable in the year they are paid.
Cash distributions, if any, are expected to be paid primarily from income, dividends, and capital gains earned by the BMO ETF, less expenses, but may also include non‑taxable amounts such as returns of capital, paid at the manager’s discretion. If expenses exceed income in a given period, it is not expected that a distribution will be paid for that period.
Certain BMO ETFs offer accumulating units or have adopted a distribution reinvestment plan (“DRIP”), under which distributions may be automatically reinvested in additional units in accordance with the applicable plan or ETF structure. Non‑resident unitholders may have the number of securities reduced due to withholding taxes. For further information, see the distribution policy in the BMO ETFs’ prospectus.
Commissions, management fees and expenses all may be associated with investments in BMO ETFs and ETF Series units of the BMO Mutual Funds. Please read the ETF facts or prospectus of the relevant BMO ETF or ETF Series of BMO Mutual Fund before investing. The indicated rates of return are the historical compounded total returns including changes in share or unit value and the reinvestment of all dividends or distributions and do not take into account the sales, redemption, distribution, optional charges or income tax payable by the unitholder that would have reduced returns BMO ETFs and ETF Series are not guaranteed, their values change frequently, and past performance may not be repeated.
For a summary of the risks of an investment in the BMO ETFs or ETF Series of the BMO Mutual Funds, please see the specific risks set out in the prospectus. BMO ETFs and ETF Series units of the BMO Mutual Funds trade like stocks, fluctuate in market value and may trade at a discount to their net asset value, which may increase the risk of loss. Distributions are not guaranteed and are subject to change and/or elimination.
BMO ETFs are managed by BMO Asset Management Inc., an investment fund manager, a portfolio manager, and a separate legal entity from Bank of Montreal. ETF Series of the BMO Mutual Funds are managed by BMO Investments Inc., an investment fund manager and a separate legal entity from Bank of Montreal.
BMO Global Asset Management is a brand name under which BMO Asset Management Inc. and BMO Investments Inc. operate.
“BMO (M-bar roundel symbol)” is a registered trademark of Bank of Montreal, used under licence.