Inflation Toolkit: Five Ways to Help Protect Your Portfolio
As inflation risks rise, a resilient allocation strategy could require more than stocks and bonds. Here are five ways to help hedge portfolios and diversify risk.


The risk of persistently higher inflation is forcing investors to rethink traditional portfolio construction. The classic 60/40 framework relies on one key assumption: bonds act as a ballast when equities sell off. However, history shows that relationship becomes less reliable in stagflationary environments.
U.S. Bond & Equity Correlation (24-Month Rolling)
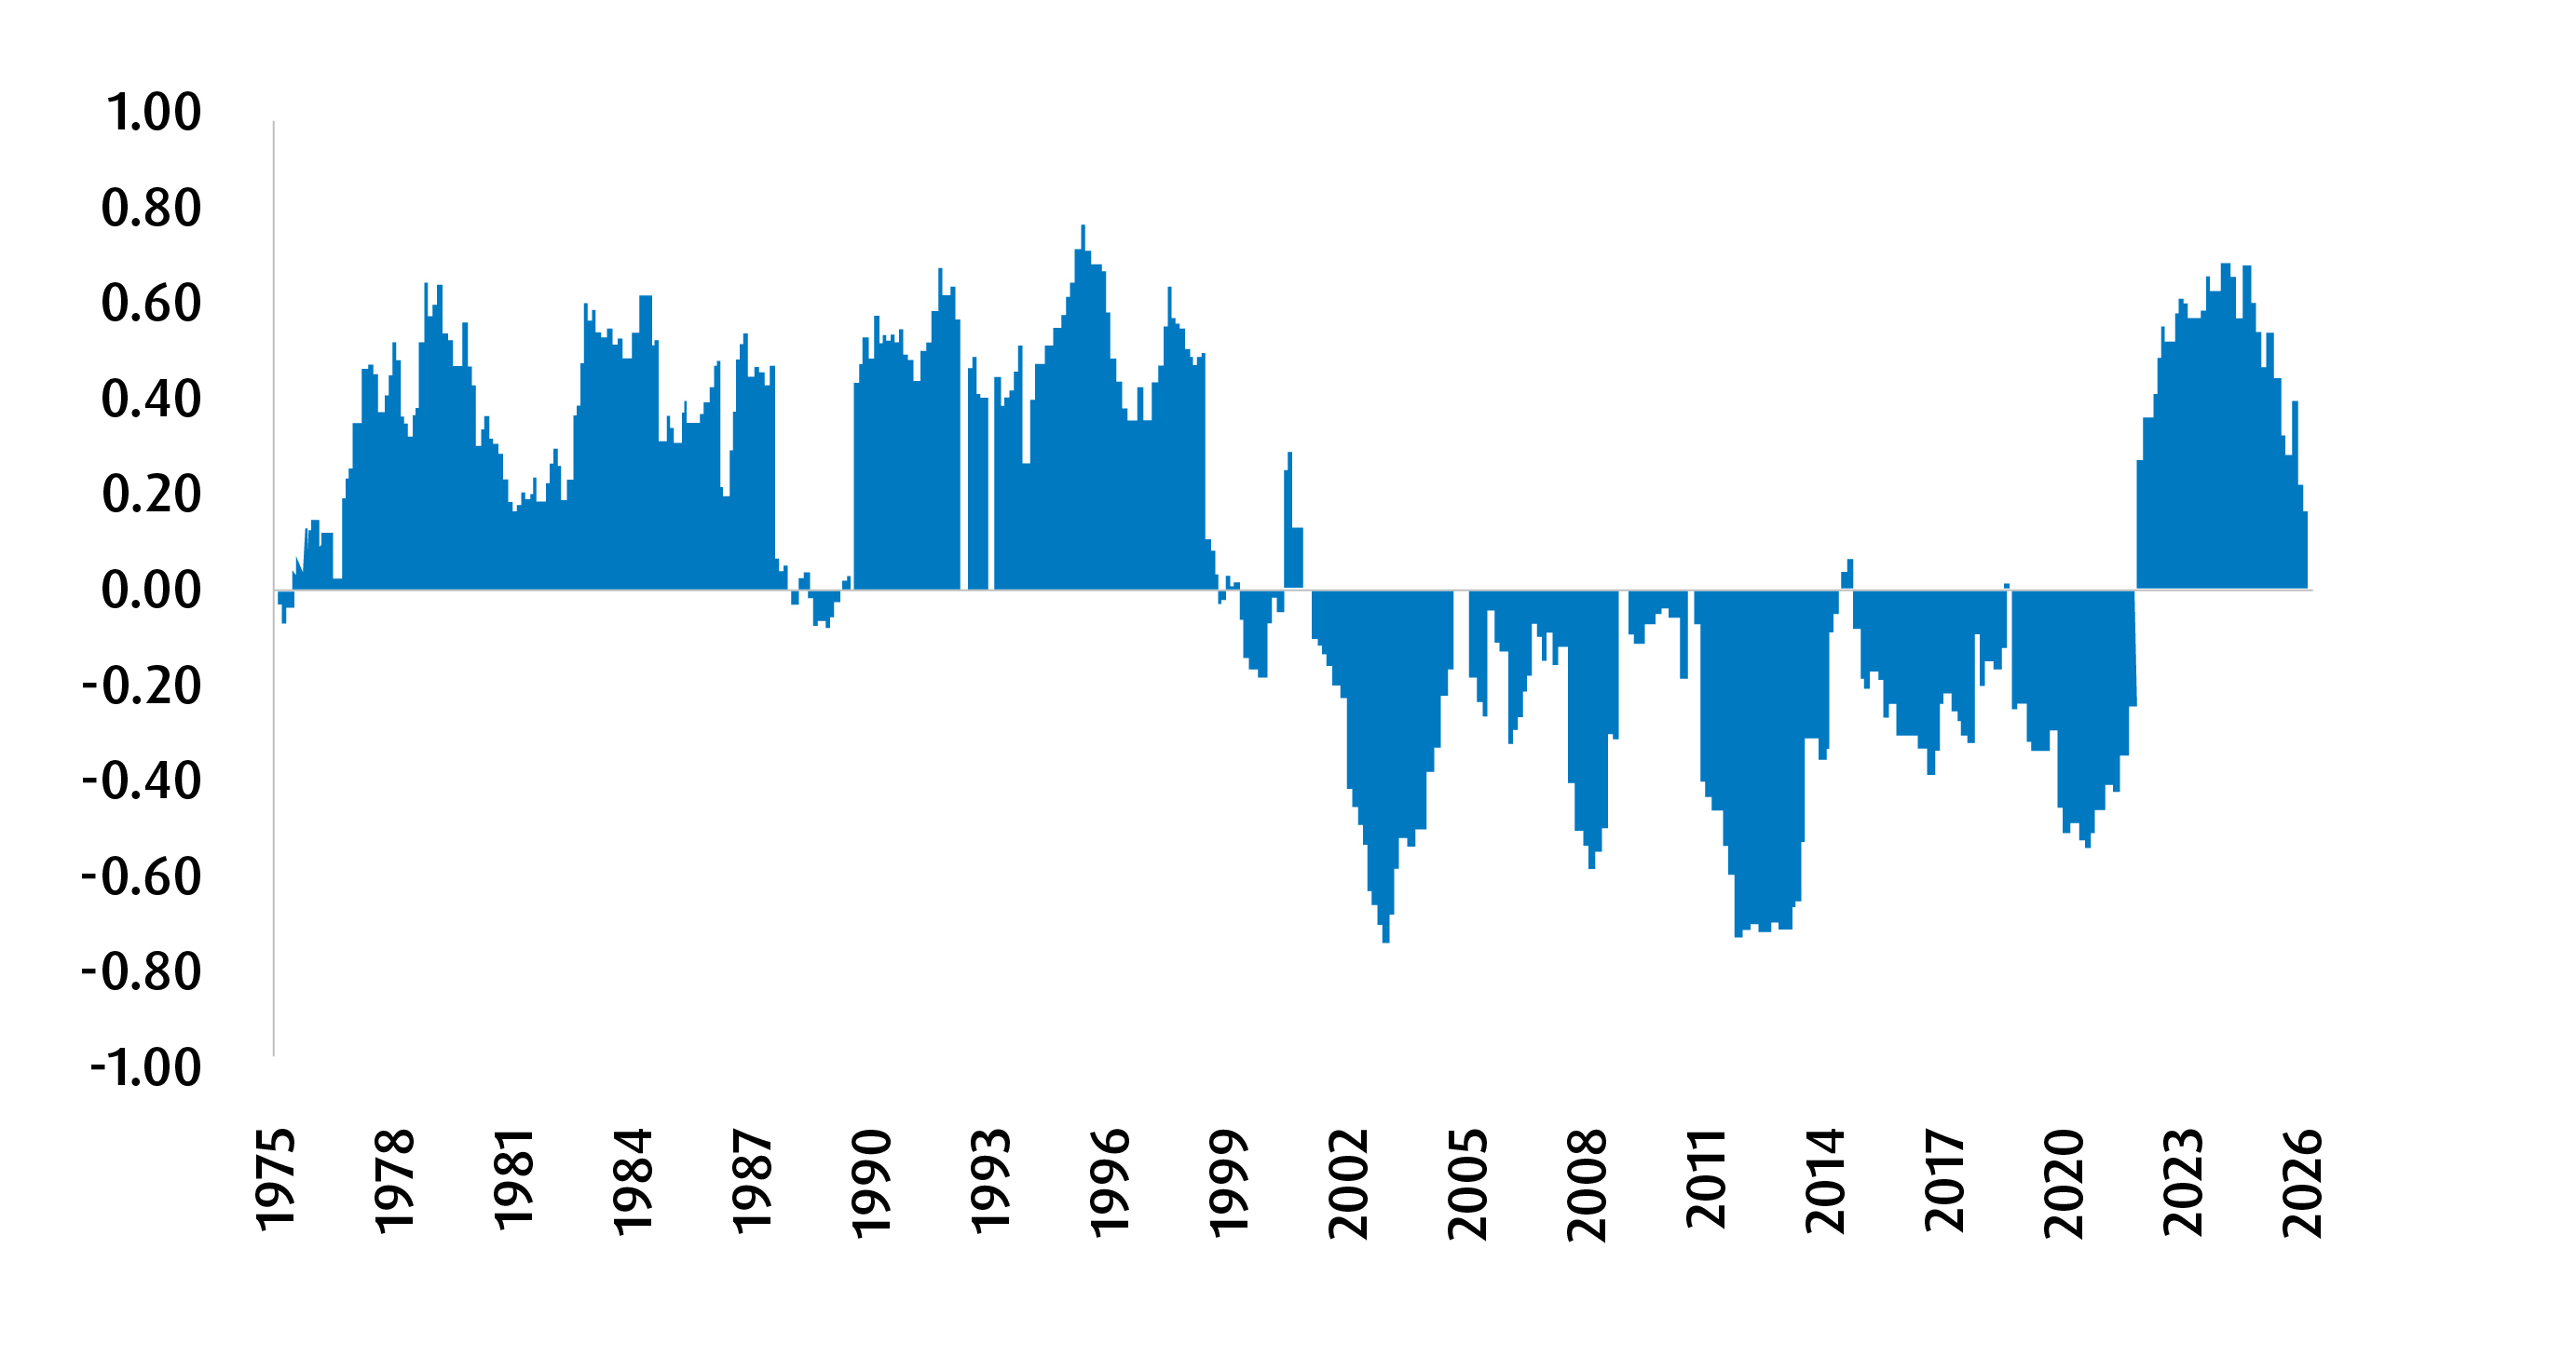
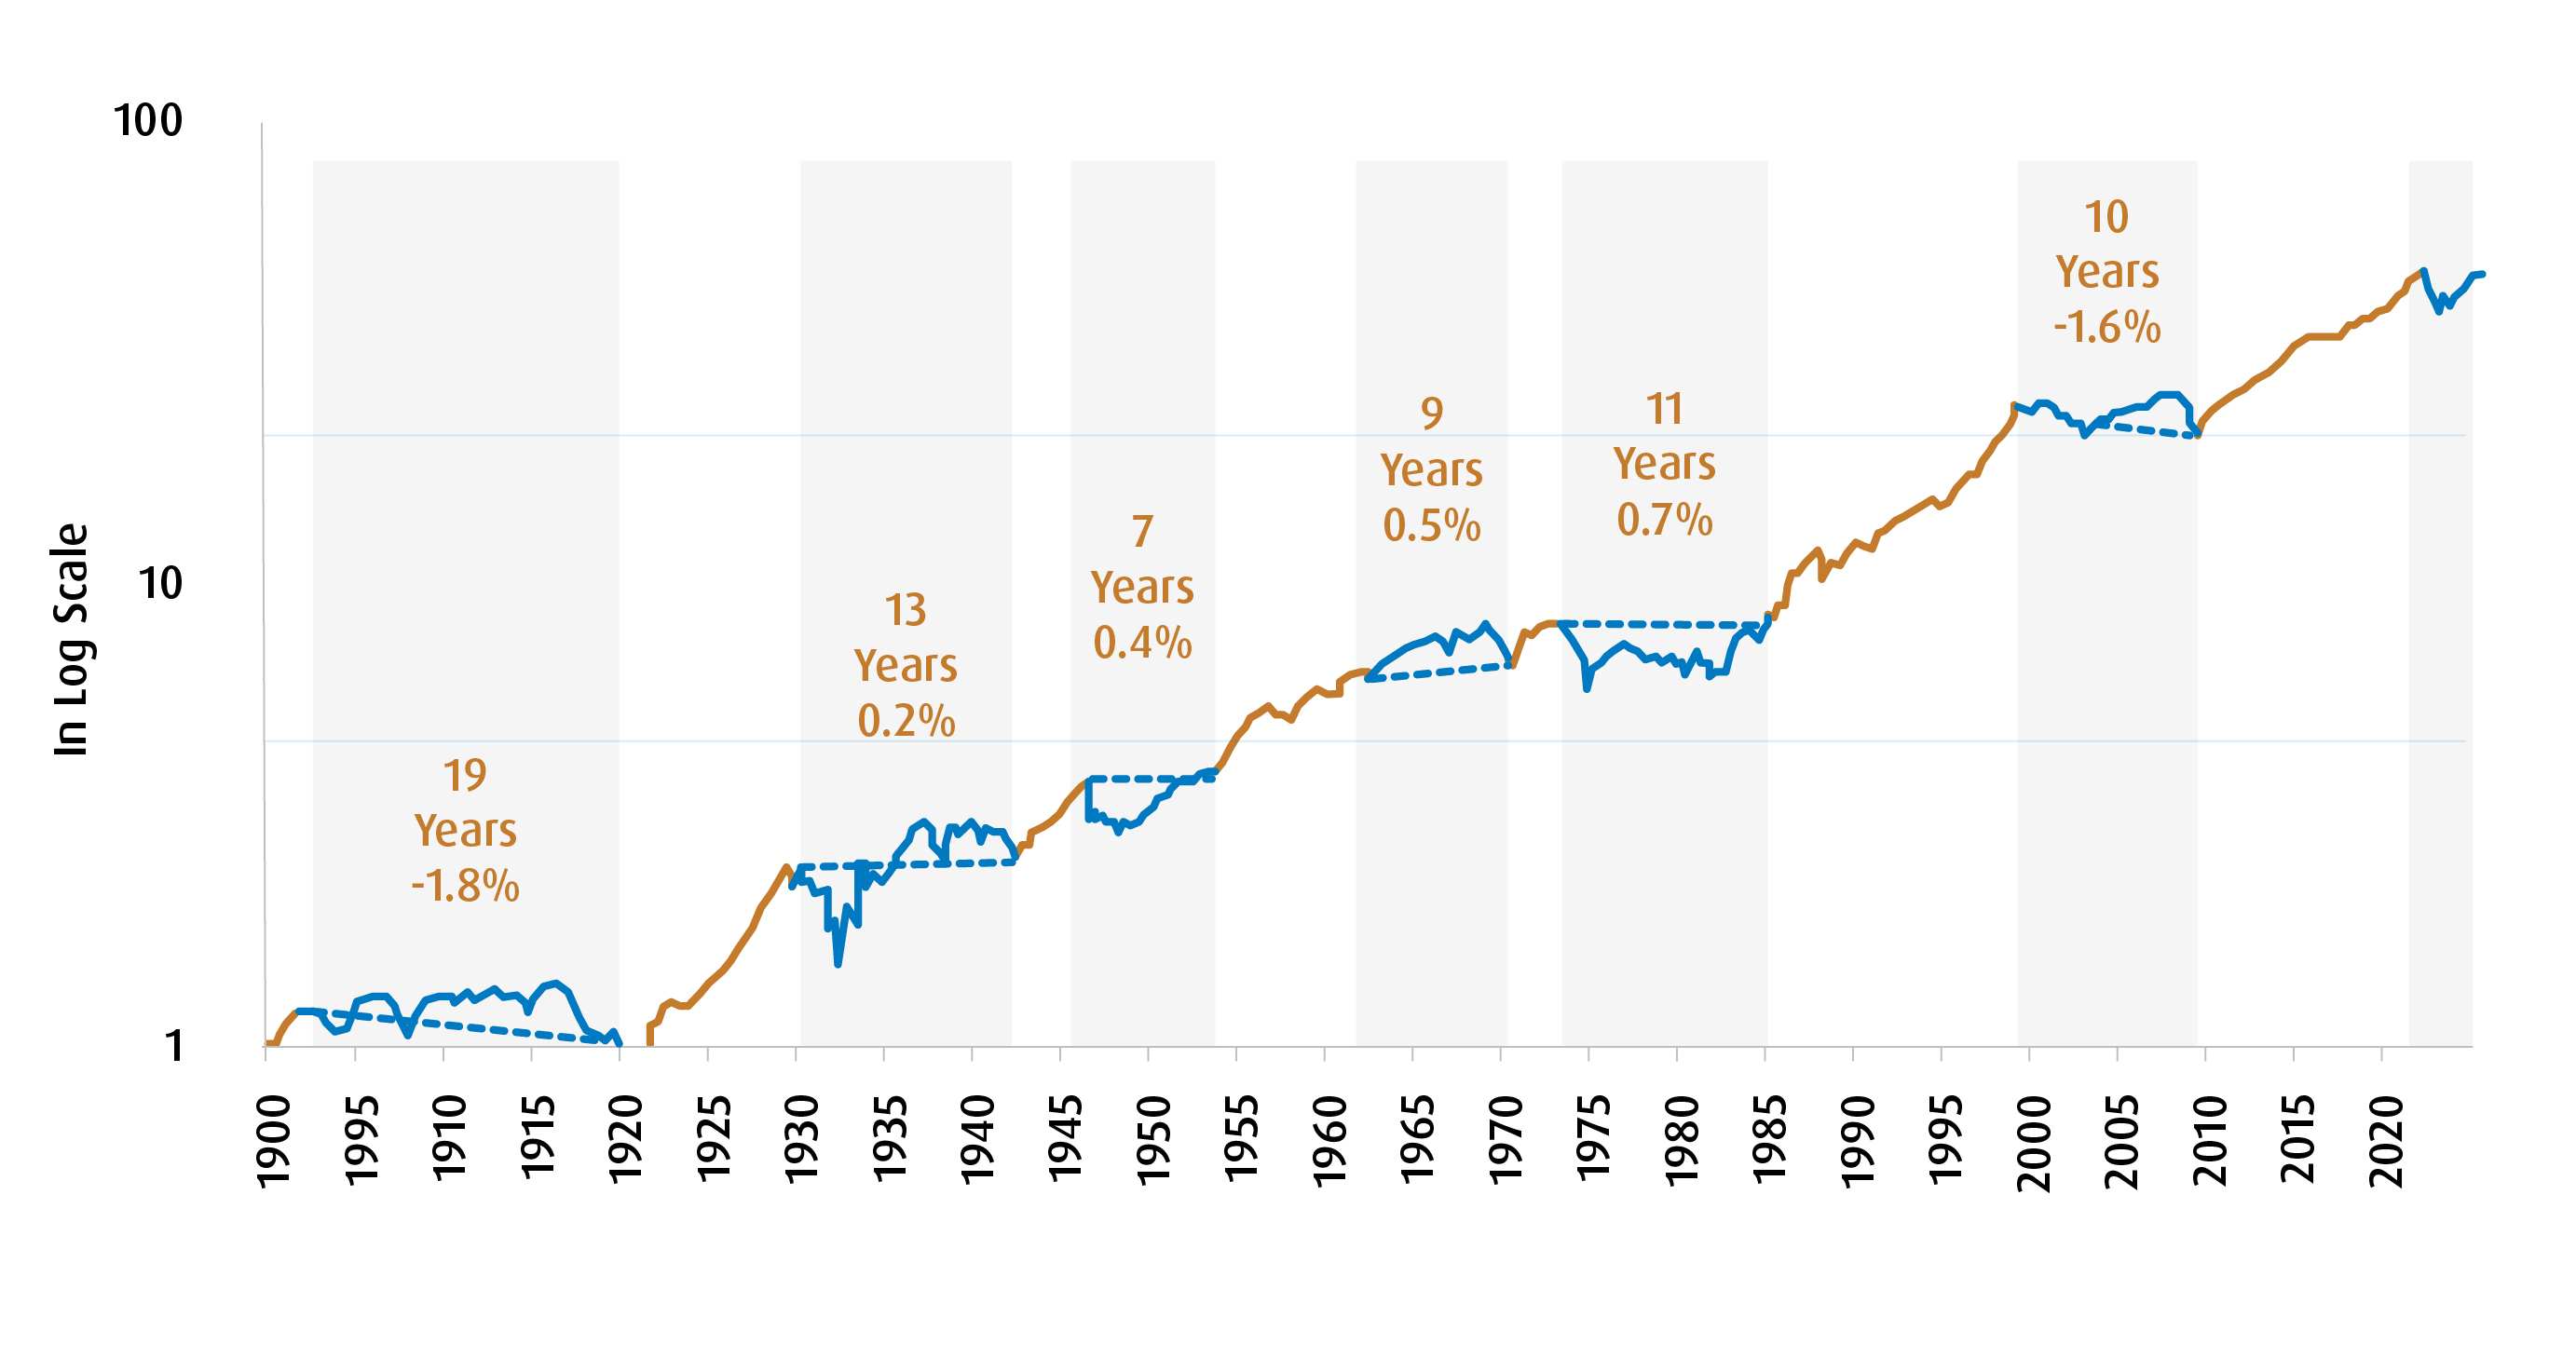
As Bipan Rai, Managing Director, Head of ETF and Alternatives Strategy, BMO Global Asset Management, highlights in Commodities, Reconsidered: From Tactical Trade to Structural Allocation, we’re moving toward a macro environment defined by greater trade fragmentation, geopolitical tension, and supply constraints — conditions that can simultaneously pressure growth and elevate inflation. A traditional 60/40 portfolio can struggle on a real basis during these times, as shown in the 1970s and 80s, early 2000s, and so far in the current decade.
Please see and bookmark Bipan Rai’s Basis Points for more timely market commentary
The implication: investors need a more robust inflation toolkit — one that incorporates commodities and real assets for alternative sources of portfolio diversification.
Growth of a Dollar in Real Terms of a 60/40 Portfolio
Why Commodities Diversify Portfolios During Inflationary Periods
It comes down to what drives returns for different assets. For equities, it’s earnings growth, dividends and changes in multiples. For bonds it’s starting yields, duration effects and spread changes.
By contrast, commodity returns in the futures markets are driven by spot price changes and roll yield. Both of those are impacted by supply and demand imbalances – which make them fundamentally different than typical financial securities like stocks and bonds – and less exposed to inflationary pressures.
This distinction matters in inflationary environments. When inflation is driven by higher input costs (energy, metals, food), commodities themselves are often the source of the inflation shock, rather than being negatively impacted by it.
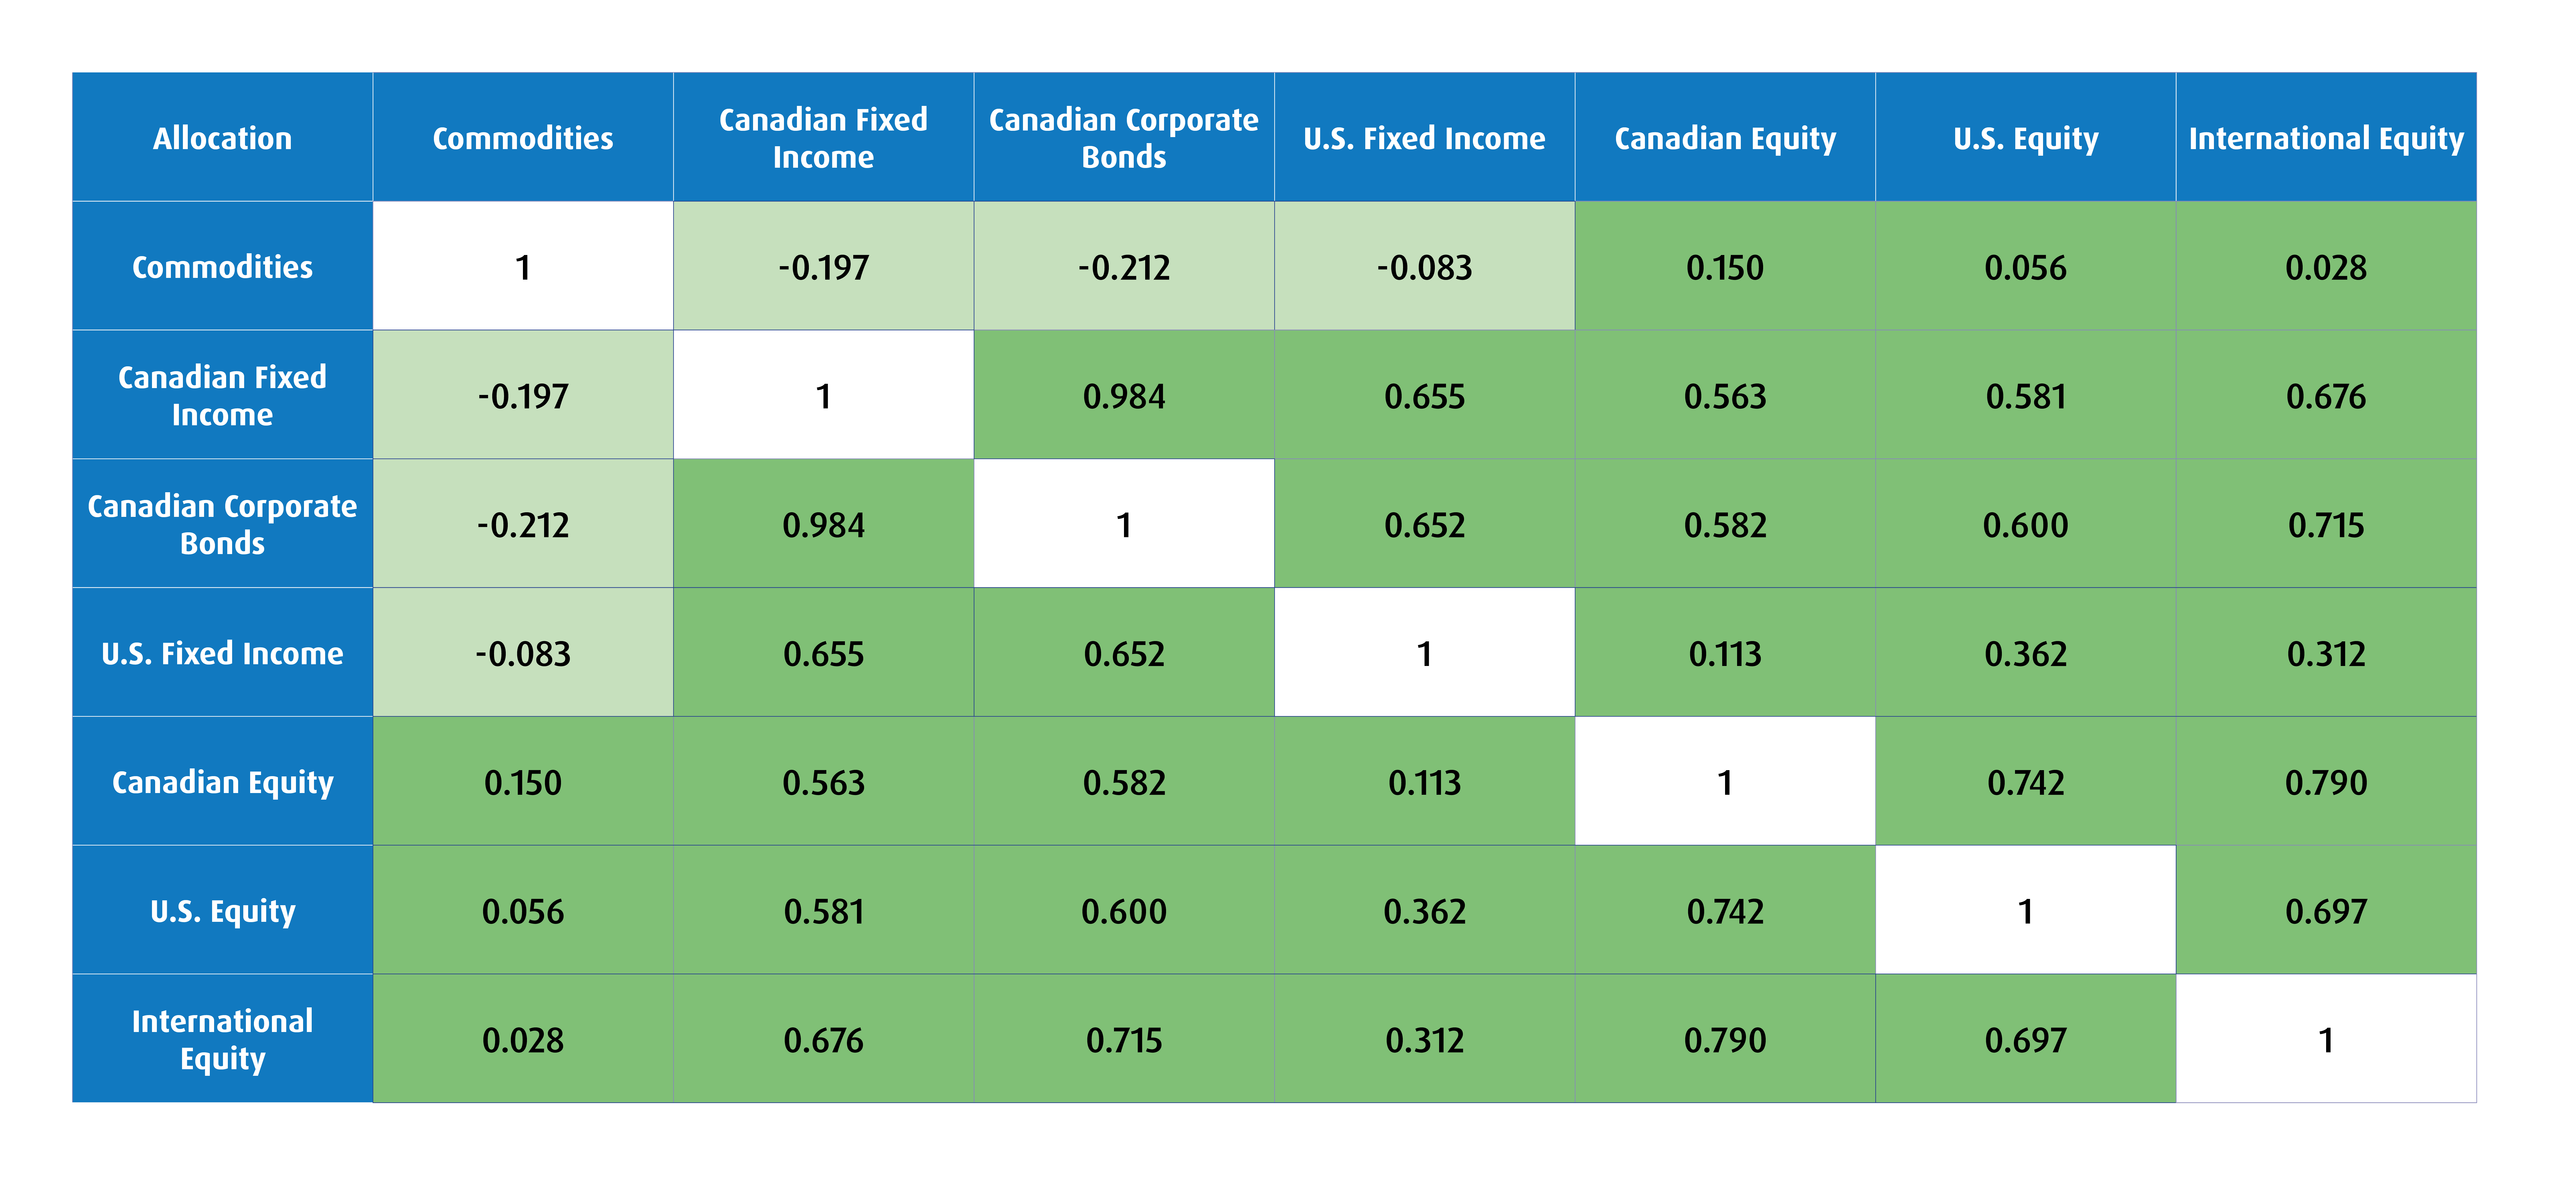
As a result, commodities can rise while both stocks and bonds struggle — creating true portfolio diversification.
Incorporating Inflation Resilience with ETFs
For investors looking to address this potential portfolio gap, BMO offers the following ETFs that provide both diversified and targeted inflation hedge exposures.
1. Broad Commodities – Core Inflation Hedge
BMO Broad Commodity ETF (ZCOM / ZCOM.F)
For a structural allocation, broad exposure is important to reduce concentration risk as different commodity sectors respond to different drivers. ZCOM tracks the Bloomberg Commodity Index Total Return, providing low-cost diversified exposure across energy, metals, and agriculture — key inputs into the global economy.
2. Energy – Cyclical Inflation Beta
BMO Equal Weight Oil & Gas Index ETF (ZEO) / BMO Covered Call Energy ETF (ZWEN)
Energy is often a primary driver of inflation spikes. Energy equity exposure adds leverage to commodity price moves, while the covered call variant can enhance income and dampen volatility.
3. Gold – Defensive Real Asset
BMO Gold Bullion ETF (ZGLD / ZGLD.U / ZGLH) / BMO Covered Call Spread Gold Bullion ETF (ZWGD)
Gold has historically acted as a store of value and safe haven during periods of monetary instability or geopolitical stress. The call spread version produces income from an asset that does not, while managing upside participation to maintain gold’s diversification benefits.
4. Inflation-Linked Bonds – Direct Protection Against CPI
BMO Short-Term US TIPS Index ETF (ZTIP / ZTIP.U / ZTIP.F)
While commodities and real assets provide indirect inflation protection through rising input prices, U.S. Treasury Inflation-Protected Securities (TIPS) offer a more direct hedge. TIPS are designed to adjust their principal value based on changes in inflation (as measured by CPI), helping preserve real purchasing power. Focusing on short-term TIPS reduces vulnerability to rising interest rates, providing a more targeted exposure to realized inflation, rather than interest rate expectations.
5. Equities with Inflation Sensitivity
BMO S&P/TSX Capped Composite Index ETF (ZCN)
BMO MSCI Emerging Markets Index ETF (ZEM)
Overweighting broad equity exposure with embedded inflation linkage can also be utilized. Canadian equities have a natural exposure to commodities (heavy weighting to energy and materials), while emerging markets may benefit from rising commodity export revenues and nominal growth.
Putting It All Together
In a world where inflation is more volatile — and traditional diversification less reliable — the case for real assets has strengthened. As BMO ETFs’ head strategist Bipan Rai emphasizes, this is not to be viewed as an “inflation trade,” but a structural shift toward assets that behave differently when traditional financial assets struggle.
Even modest allocations can improve portfolio resilience — helping investors navigate environments where both inflation and uncertainty remain elevated.
Performance
Ticker |
Year-to-Date |
1-Month |
3-Month |
6-Month |
1-Year |
3-Year |
5-Year |
10-Year |
Since Inception |
Inception Date |
ZCN |
7.89% |
3.79% |
6.98% |
13.50% |
39.98% |
21.44% |
15.43% |
12.57% |
9.91% |
2009-05-29 |
ZEM |
14.52% |
10.60% |
6.18% |
12.29% |
46.22% |
20.40% |
7.84% |
9.93% |
6.66% |
2009-10-20 |
ZGLD |
4.41% |
-2.31% |
-7.71% |
11.21% |
37.27% |
— |
— |
— |
45.39% |
2024-03-04 |
ZEO |
34.10% |
1.79% |
24.23% |
38.50% |
59.52% |
25.00% |
28.02% |
10.81% |
5.85% |
2009-10-20 |
ZTIP.F |
1.35% |
0.77% |
0.94% |
1.27% |
2.08% |
3.55% |
2.58% |
— |
2.72% |
2021-01-20 |
ZGLH |
4.75% |
-0.09% |
-7.97% |
13.54% |
36.68% |
— |
— |
— |
41.55% |
2024-03-05 |
ZWEN |
29.28% |
-2.06% |
19.04% |
30.12% |
48.11% |
16.93% |
— |
— |
14.43% |
2023-01-23 |
ZWGD |
3.12% |
-2.25% |
-7.95% |
9.14% |
— |
— |
— |
— |
30.86% |
2025-05-22 |
ZGLD.U |
5.50% |
0.05% |
-7.49% |
14.83% |
39.32% |
— |
— |
— |
45.19% |
2024-03-04 |
ZTIP |
0.88% |
-1.43% |
1.14% |
-1.06% |
2.41% |
4.96% |
5.53% |
— |
4.96% |
2021-01-20 |
ZTIP.U |
1.93% |
0.95% |
1.39% |
2.16% |
3.93% |
4.87% |
3.44% |
— |
3.54% |
2021-01-20 |
ZCOM |
Returns are not available as there is less than one year’s performance data. |
2025-10-21 |
||||||||
ZCOM.F |
2026-04-28 |
|||||||||
Source: Bloomberg, as of April 30, 2026. Past performance is not indicative of future results.
Disclaimers
Advisor Use Only.
This article is for information purposes. The information contained herein is not, and should not be construed as, investment, tax or legal advice to any party. Particular investments and/or trading strategies should be evaluated relative to the individual’s investment objectives and professional advice should be obtained with respect to any circumstance.
The viewpoints expressed represent an assessment of the markets at the time of publication. Those views are subject to change without notice at any time. The information provided herein does not constitute a solicitation of an offer to buy, or an offer to sell securities nor should the information be relied upon as investment advice. Past performance is no guarantee of future results. This communication is intended for informational purposes only.
Cash distributions, if any, on units of a BMO ETF (other than accumulating units or units subject to a distribution reinvestment plan) are expected to be paid primarily out of dividends or distributions, and other income or gains, received by the BMO ETF less the expenses of the BMO ETF, but may also consist of non-taxable amounts including returns of capital, which may be paid in the manager’s sole discretion. To the extent that the expenses of a BMO ETF exceed the income generated by such BMO ETF in any given month, quarter, or year, as the case may be, it is not expected that a monthly, quarterly, or annual distribution will be paid. Distributions, if any, in respect of the accumulating units of BMO Short Corporate Bond Index ETF, BMO Short Federal Bond Index ETF, BMO Short Provincial Bond Index ETF, BMO Ultra Short-Term Bond ETF and BMO Ultra Short-Term US Bond ETF will be automatically reinvested in additional accumulating units of the applicable BMO ETF. Following each distribution, the number of accumulating units of the applicable BMO ETF will be immediately consolidated so that the number of outstanding accumulating units of the applicable BMO ETF will be the same as the number of outstanding accumulating units before the distribution. Non-resident unitholders may have the number of securities reduced due to withholding tax. Certain BMO ETFs have adopted a distribution reinvestment plan, which provides that a unitholder may elect to automatically reinvest all cash distributions paid on units held by that unitholder in additional units of the applicable BMO ETF in accordance with the terms of the distribution reinvestment plan. For further information, see the distribution policy in the BMO ETFs’ prospectus.
Distribution yields are calculated by using the most recent regular distribution, or expected distribution, (which may be based on income, dividends, return of capital, and option premiums, as applicable) and excluding additional year end distributions, and special reinvested distributions annualized for frequency, divided by current net asset value (NAV). The yield calculation does not include reinvested distributions.
Distributions are not guaranteed, may fluctuate and are subject to change and/or elimination. Distribution rates may change without notice (up or down) depending on market conditions and NAV fluctuations. The payment of distributions should not be confused with the BMO ETF’s performance, rate of return or yield. If distributions paid by a BMO ETF are greater than the performance of the investment fund, your original investment will shrink. Distributions paid as a result of capital gains realized by a BMO ETF, and income and dividends earned by a BMO ETF, are taxable in your hands in the year they are paid. Your adjusted cost base will be reduced by the amount of any returns of capital. If your adjusted cost base goes below zero, you will have to pay capital gains tax on the amount below zero.
Commissions, management fees and expenses all may be associated with investments in exchange-traded funds. Please read the ETF Facts or prospectus of the BMO ETFs before investing. The indicated rates of return are the historical annual compounded total returns including changes in unit value and reinvestment of all dividends or distributions and do not take into account sales, redemption, distribution or optional charges or income taxes payable by any unitholder that would have reduced returns. Exchange-traded funds are not guaranteed, their values change frequently and past performance may not be repeated.
For a summary of the risks of an investment in the BMO ETFs, please see the specific risks set out in the BMO ETF’s prospectus. BMO ETFs trade like stocks, fluctuate in market value and may trade at a discount to their net asset value, which may increase the risk of loss. Distributions are not guaranteed and are subject to change and/or elimination.
This article may contain links to other sites that BMO Global Asset Management (BMO GAM) does not own or operate. Any content from or links to a third-party website are not reviewed or endorsed by BMO GAM. Investors use any external websites or third-party content at their own risk. Accordingly, BMO GAM disclaims any responsibility for them.
BMO ETFs are managed by BMO Asset Management Inc., an investment fund manager, a portfolio manager, and a separate legal entity from Bank of Montreal.
BMO Global Asset Management is a brand name under which BMO Asset Management Inc. and BMO Investments Inc. operate.
“BMO (M-bar roundel symbol)” is a registered trademark of Bank of Montreal, used under licence.