Less Chips, More Copper: The Missing Piece in Today’s Emerging Market Allocations
Red-hot growth in Asian AI-equipment companies is skewing the broader EM landscape. Latin America offers a way to rebalance, broaden sector exposures and participate more deliberately in the underlying commodity cycle.


Key takeaways
- Trimming U.S. equities to add EM can leave a portfolio still overexposed to familiar AI themes.
- A dedicated Latin American equity allocation can complement a broad EM holding through exposure to commodity producers and the businesses that service them and transport their output.
- Weighting Latin American markets by GDP gives smaller regional names a larger role compared to market-cap weighting, diversifying growth potential.
Recent client conversations have revealed a willingness to trim some of the U.S. overweight that has built up in portfolios. Investors want to retain exposure to businesses that have served them well while putting more capital to work internationally. It’s a secret to few, that Emerging Markets (EM) have been a big part of that discussion through the current cycle.
But EM has been undergoing significant change, as well. Technology and semiconductors have become prominent exposures, meaning an allocator who is trying to moving beyond U.S. equities may still be adding to familiar investment themes. We strongly suggest looking through the regional labels to see which businesses and countries are driving the EM allocation.
A different mix within emerging markets
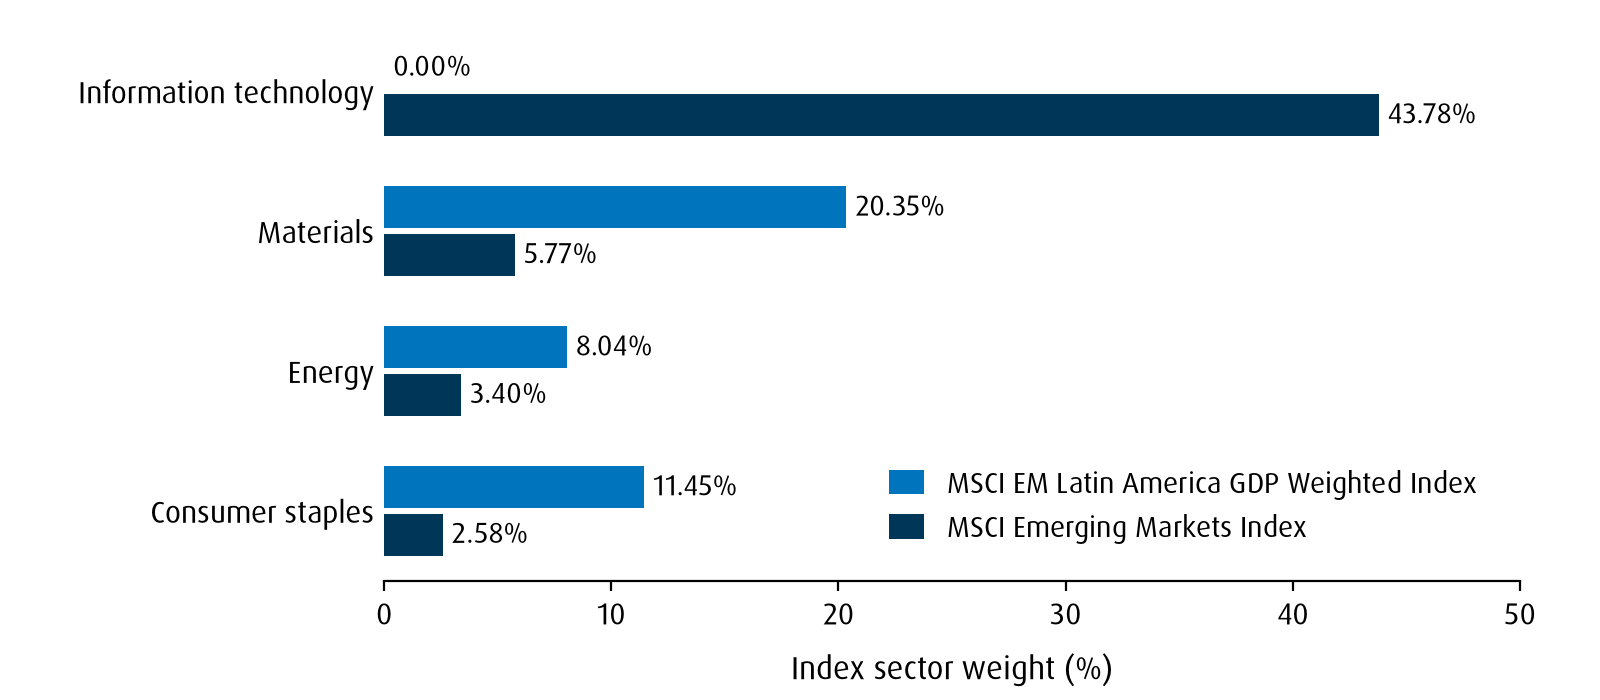
The composition is revealing. Taiwan and South Korea together accounted for 50.3% of the BMO MSCI Emerging Markets Index ETF’s geographic exposure.1 At a sector level, the broad MSCI Emerging Markets Index has Information technology (IT) representing 43.78%.2
Latin America (LatAm) offers a vastly different equity profile. Materials and energy together represented 28.4% of the MSCI Emerging Markets Latin America GDP Weighted Index (as of same date range), compared with 9.2% for broad EM. In the same benchmark, LatAm’s IT weight is zero (see Figure 1).
For investment counsellors and family offices examining overlapping technology exposures, that difference is material and provides useful context when discussing rebalancing and diversification requirements.
Figure 1 - Different sector exposures
Allocating through the commodities cycle
The case for deliberate Latin American allocations starts with the commodity story. If an investor expects sustained demand for resources, the region provides access to companies producing the energy, minerals and agricultural products global activity will require in increasing amounts. We also see a strong connection to electrification and digital infrastructure through the materials needed to build them.
The benefits can extend through the local economy. Stronger commodity activity can support companies that service producers or transport their output. That gives investors a broader set of businesses to consider alongside the producers themselves.
Canadian investors will reasonably ask how much of this commodity-linked exposure they already own, given domestic energy and materials holdings. Our view is that LatAm can potentially providing more “torque” to the theme. To be sure, that also means accepting the possibility of a sharper setback when the cycle turns. A tactical allocator should be including their Canadian resource allocation in regular portfolio assessments.
There is also scope, in our view, for some LatAm economies to grow faster than developed markets as investment expands. We see improving fiscal positions and strengthening geopolitical stability in parts of the region as encouraging for investability. Those improvements will remain uneven, however, and we would assess country and policy direction individually. Faster economic growth alone cannot establish the case for an equity allocation.
Weighting the country exposure
In evaluating an allocation in the region, construction deserves careful attention. Market-cap weighting directs more capital toward the larger listed equity markets. That approach, while reasonable, takes meaningful participation away from emerging opportunities in countries such as Colombia, Peru and Chile.
Instead, we look to GDP weighting, which sets country allocations by economic size. By viewing a LatAm exposure through the economic lens, a wider opportunity set opens up across the region while retaining diversified exposure to LatAm’s leading listed companies. An economy size-based weighting would still see Brazil and Mexico account for about three-quarters of the index,3 so investors should be clear about the concentration that remains. But the diversification contributes to an EM allocation that rotates back towards resource and commodities exposure, and away from AI-related themes.
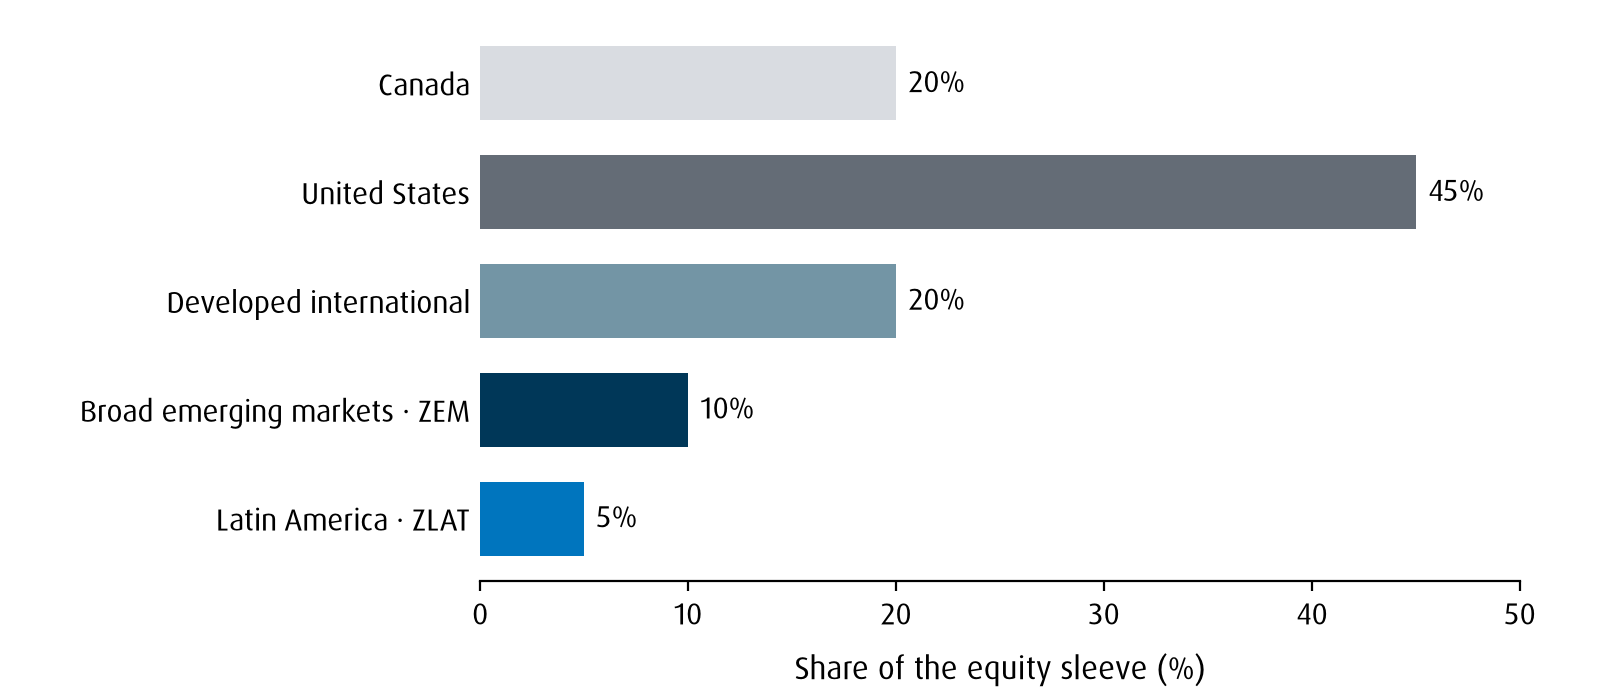
Figure 2 - Country exposure under GDP weighting
Making the allocation deliberate
Valuations provide another consideration. MSCI’s Latin America GDP-weighted index trades at about 10 times forward earnings, compared with 16.3 times for MSCI ACWI.4 If an allocator who already holds broad EM and is of the view that both near-term growth and long-term trends (electrification, precious metals, infrastructure spend) are bullish, a dedicated Latin American position offers a way to cleanly express it.
The BMO MSCI Emerging Markets Index ETF (ZEM) and BMO MSCI Latin America GDP Weighted Index ETF (ZLAT) illustrate how the view can be implemented through two complementary exposures. The ZLAT regional allocation increases the LatAm position that is already marginally present within broad EM, but diminishing as AI valuations continue to grow; the combined holdings represent a more robust, diversified aggregate EM allocation.
Moreover, the twinned exposure can be useful for investment counsellors with established North American stock-selection capabilities who want efficient access to a less familiar region. A single regional vehicle makes the exposure easier to implement, while leaving the counsellor responsible for how it fits the client’s mandate.
We would tie the size of a LatAm position to the strength of the commodity view and to exposures held elsewhere. A family office with substantial resource-related business interests may already carry more of that risk than its listed portfolio suggests, for example. Funding the allocation by trimming an appreciated U.S. position will also produce a different overall balance from funding it within the existing EM allocation.
Currency and politics need to be part of the decision. Hedged versus unhedged access hold return implications, with exchange-rate changes adding or subtracting from Canadian-dollar returns.
To be sure, broad EM may already provide the exposure an investor wants. But for those seeking a more meaningful participation in the commodities complex, LatAm offers the opportunity to reset and diversify. We have seen how much the composition of EM can change as a theme gathers momentum. By separating out Latin America as a standalone piece, it offers another lever for investors who want their international holdings to reflect a wider range of economic activity.
Sources
1 As of September 30, 2026
2 As of September 30, 2026
3 Benchmark weights for the MSCI Latin America GDP-weighted index, as of September 30, 2026.
4 As of September 30, 2026
Disclosures
For institutional and advisor use only.
This material is for information purposes only. The viewpoints expressed by the Portfolio Manager represent their assessment of the markets at the time of publication. Those views are subject to change without notice at any time. The information contained herein is not, and should not be construed as investment, tax or legal advice to any party. Particular investments and/or trading strategies should be evaluated and professional advice should be obtained with respect to any circumstance.
Any statement that necessarily depends on future events may be a forward-looking statement. Forward-looking statements are not guarantees of performance. They involve risks, uncertainties and assumptions. Although such statements are based on assumptions that are believed to be reasonable, there can be no assurance that actual results will not differ materially from expectations. Investors are cautioned not to rely unduly on any forward-looking statements. In connection with any forward-looking statements, investors should carefully consider the areas of risk described in the most recent prospectus.
Index returns do not reflect transactions costs or the deduction of other fees and expenses and it is not possible to invest directly in an Index. Past performance is not indicative of future results.
The BMO ETFs referred to herein are not sponsored, endorsed, or promoted by MSCI Inc. (MSCI) and MSCI bears no liability with respect to the relevant BMO ETF or any index on which such BMO ETF is based. The relevant BMO ETF’s prospectus contains a more detailed description of the limited relationship MSCI has with BMO Asset Management Inc. and any related BMO ETFs.
Commissions, management fees and expenses all may be associated with investments in exchange-traded funds. Please read the ETF Facts or prospectus of the BMO ETF before investing. Exchange-traded funds are not guaranteed, their values change frequently and past performance may not be repeated.
For a summary of the risks of an investment in the BMO ETFs, please see the specific risks set out in the ETF facts or prospectus. BMO ETFs trade like stocks, fluctuate in market value and may trade at a discount to their net asset value, which may increase the risk of loss. Distributions are not guaranteed and are subject to change and/or elimination.
BMO ETFs are managed by BMO Asset Management Inc., an investment fund manager, a portfolio manager, and a separate legal entity from Bank of Montreal.BMO Global Asset Management is a brand name under which BMO Asset Management Inc. and BMO Investments Inc. operate.
“BMO (M-bar roundel symbol)” is a registered trademark of Bank of Montreal, used under licence.
Publication Date: November 2026.