Quantitative deep dive: Tailor beta exposures with an alpha-focused approach
A look into the methodology that drives BMO Global Asset Management’s quantitative team mandates — a disciplined core process working in lockstep with strategy-specific constraints to produced a set of robust, proven strategies.


In a market environment increasingly defined by dispersion, regime shift, and heightened risk scrutiny, family offices and investment counsellors are asking harder questions about how returns are generated, in addition to where they come from. Product proliferation has made access easier than ever, but it has also made it difficult to distinguish between surface-level differentiation and genuinely distinct investment processes.
At BMO Global Asset Management (BMO GAM), the Quantitative Investment team approaches the challenge of creating durable investment processes through a rigorous model that is applied across mandates — a single, systematic investment engine, refined and tested since 2010 — that is deliberately adapted through individual portfolio constraints to deliver a wide range of investment outcomes.
The result is a set of strategies that are uniquely differentiated (Table 1), yet all draw from the same disciplined core.
Table 1. One methodology, many strategies
Strategy |
Core |
Long short |
Smart alpha |
Dividend |
|||
Region |
Canada |
U.S. |
EAFE |
Canada |
U.S. |
Canada |
Canada/U.S./EAFE |
Objective |
Consistent amounts of value added with moderate tracking error |
Consistent amounts of value added with low tracking error |
Consistent amounts of value added with low tracking error |
Long-term capital appreciation with attractive risk-adjusted rate of return |
Long-term capital appreciation with attractive risk-adjusted rate of return |
Minimize downside risk while adding value |
Stable income and long-term capital appreciation |
Asset class |
Broad Canadian equity |
Broad U.S. equity |
Broad international equity |
Long/short Canadian equity |
Long/short U.S. equity |
Low volatility Canadian equity |
Broad Equity |
Risk objective |
Benchmark relative risk |
Benchmark relative risk |
Benchmark relative risk |
Similar to 50/50 equity/cash |
Similar to 50/50 equity/cash |
Total risk |
Total Risk |
Inception |
Jun-12 |
Jul-17 |
Jan-24 |
Sep-23 |
Sep-23 |
Jun-11 |
Oct-11 |
Benchmark/universe |
S&P/TSX |
S&P 500 Total Return Index / MSCI USA Large Cap Universe |
MSCI EAFE Index |
50% S&P/TSX Composite Index + 50% CAD cash |
50% S&P 500 Total Return Index + 50% USD cash |
S&P/TSX |
S&P/TSX/MSCI EAFE |
Expected beta |
0.9 - 1.1 |
1 |
0.9 - 1.1 |
0.4 - 0.6 |
0.4 - 0.6 |
0.6 - 0.8 |
0.8−0.9 |
Source: BMO Global AM Inc., as of December 31, 2025.
A philosophy built for consistency
The foundation of BMO GAM’s quantitative platform rests on a simple belief: markets are inefficient, not random. Investor behaviour — anchoring, overreaction, crowding — creates patterns that can persist through time. Exploiting those inefficiencies requires a repeatable framework that can systematically separate signal from noise.
That is why the team combines fundamental insights with quantitative implementation. Company quality, valuation, and earnings sustainability matter — and are expressed through disciplined modelling. This has allowed the process to remain consistent across geographies, market cycles, and investment formats for more than 15 years.
For allocators such as family offices, this consistency is vital, reducing “key-person” risk, improving transparency and allowing capital to be deployed across mandates without having to relearn a new process each time.
Fundamental Perspective |
Quantitative implementation |
|
|
+ |
|
|
|
The alpha engine: core stock selection
Every strategy begins with a clearly defined universe of liquid, investable securities. Depending on the mandate, the starting point may be the S&P/TSX Composite, the S&P 500, or the MSCI EAFE Index.
This is not a trivial step. Universe definition sets the boundaries for capacity, liquidity, and risk control. From there, only securities that meet liquidity and investability thresholds are included. It is discipline that translates into scalability and alpha generation.
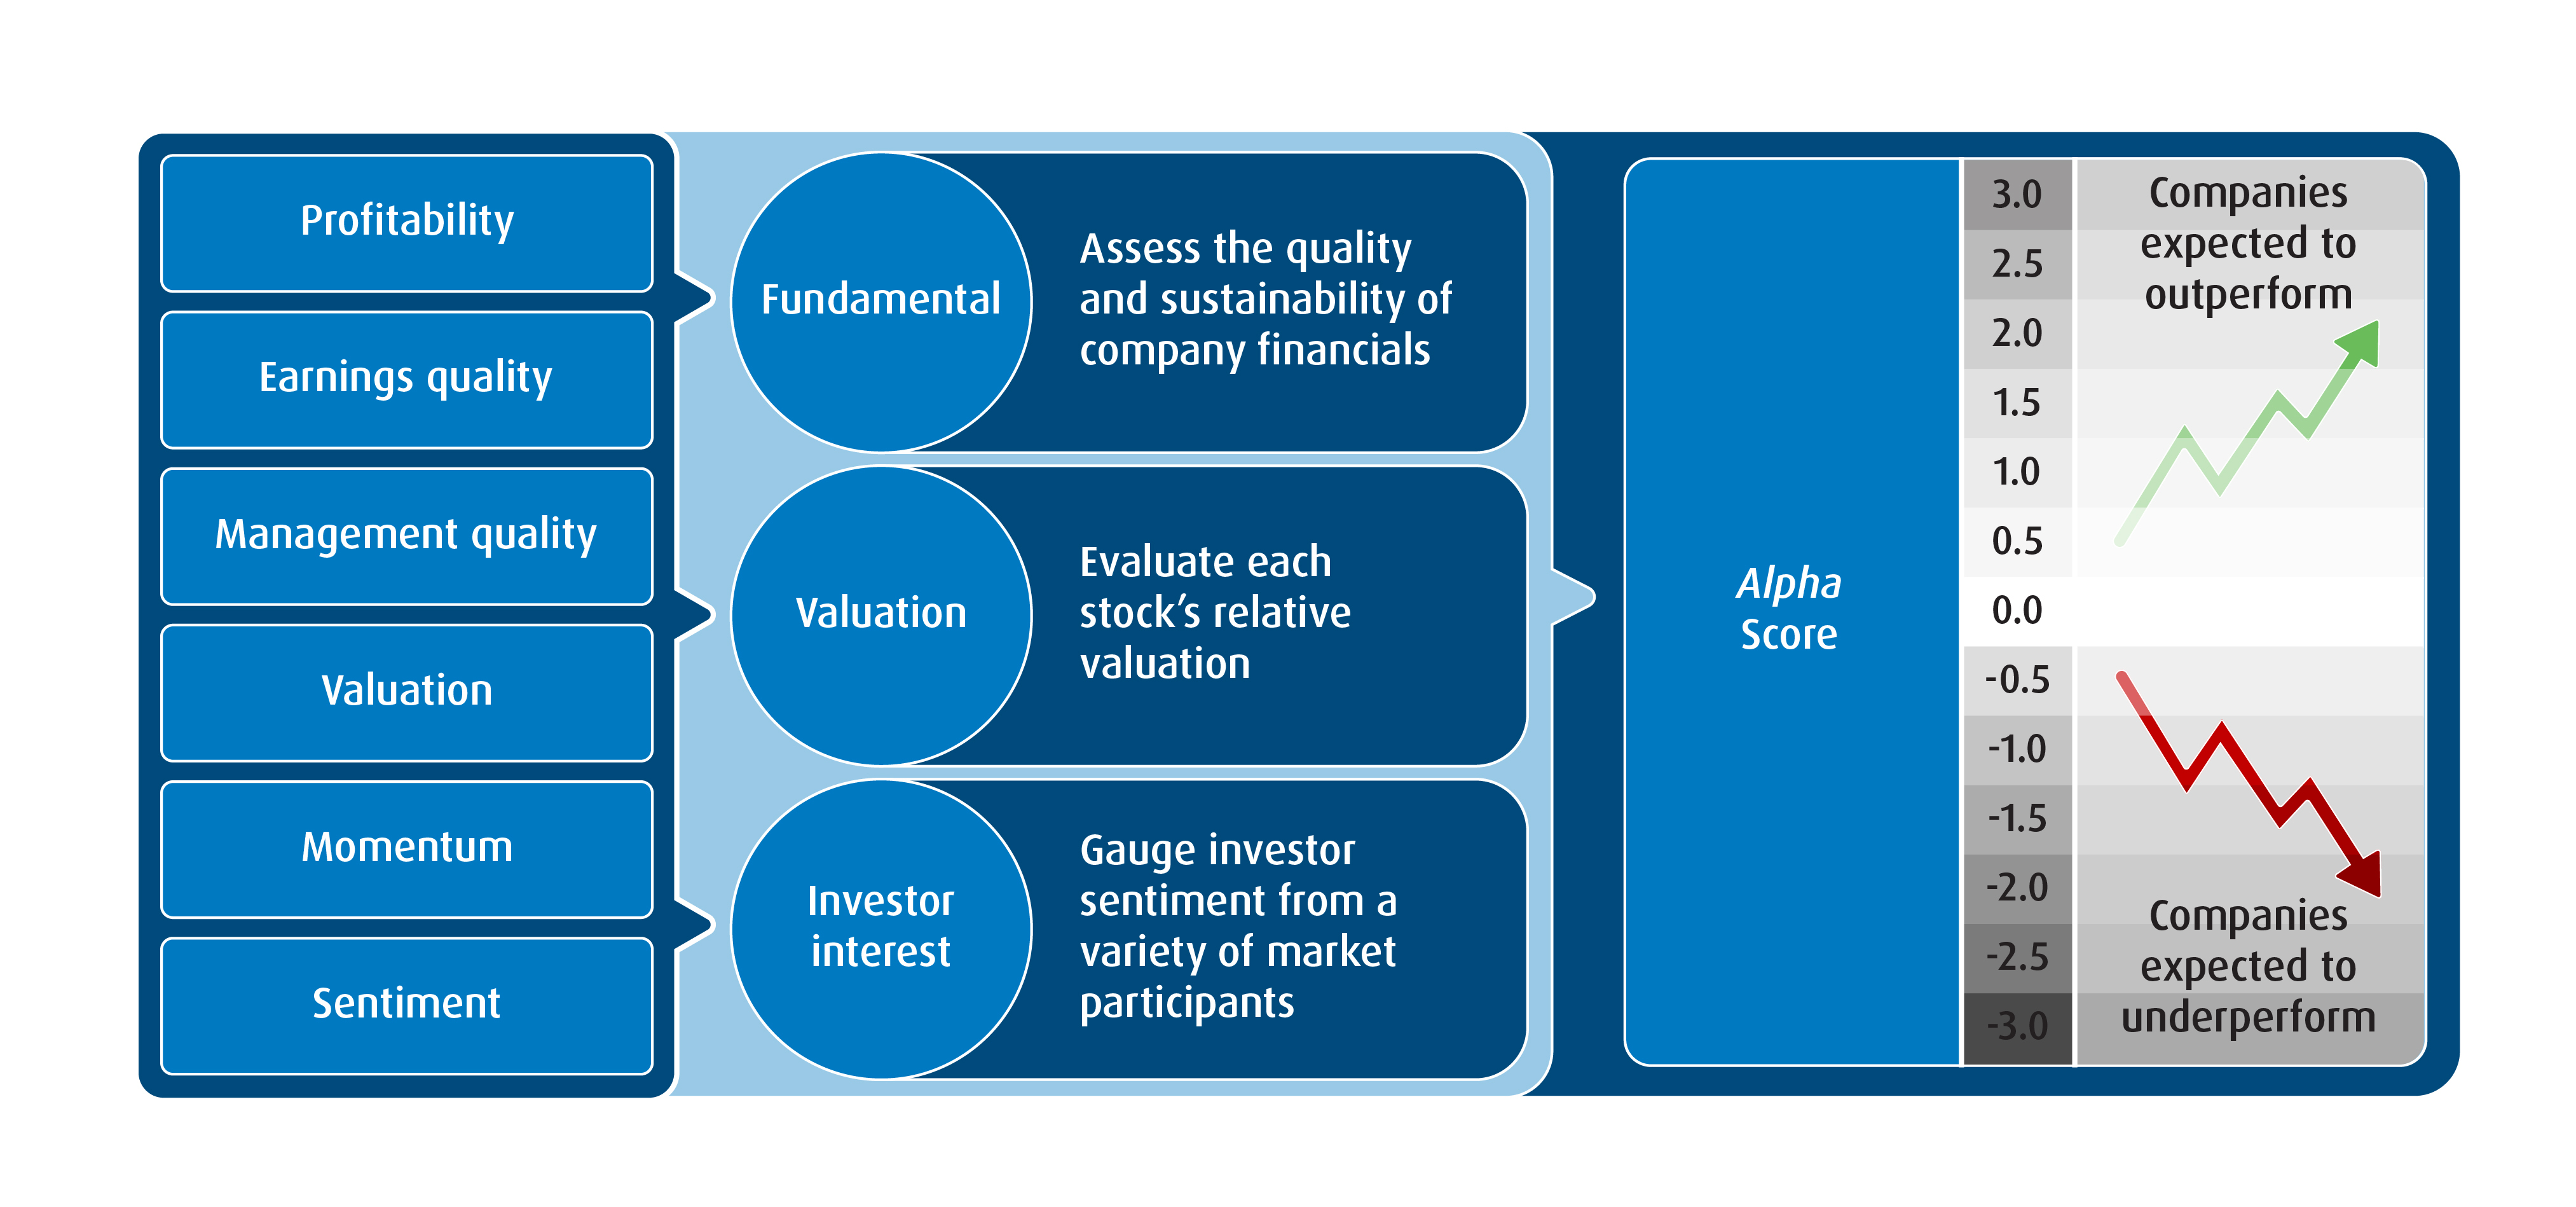
Each security in the investable universe is evaluated across a diversified set of factors that our research has shown to be associated with long-term outperformance. These include profitability, earnings quality, management quality, valuation, momentum, and investor sentiment. The result is a composite alpha score that ranks companies from most to least attractive.
The Dividend ETF methodology, for example, provides a clear illustration of this in action (Diagram 1). Its multi-faceted alpha screen evaluates companies on fundamental strength and valuation before any income-specific filters are applied. Stocks with the strongest scores emerge as candidates for portfolio inclusion, while those with weaker characteristics are systematically deprioritized.
Diagram 1. Initial screening process, BMO Dividend ETFs
This same alpha ranking drives selection in other quantitative strategies, including long-short, except in those portfolios, negative signals are monetized rather than ignored. Stocks expected to underperform are sold short, allowing the model to extract value from across the spectrum of market inefficiencies.
Once stocks are ranked, the process shifts from selection to risk assessment. Risk controls are applied after alpha scores are generated, and evaluated across multiple dimensions, including factor exposure, macro sensitivity, and company-specific fundamentals. The goal is not to eliminate risk, but to ensure that it is intentional and consistent with each mandate’s objectives.
In dividend strategies, for example, risk controls include sector weight limits, security concentration thresholds, and ongoing monitoring of dividend sustainability. These constraints help prevent unintended tilts while preserving the integrity of the alpha signal.
Portfolio construction: unified methodology, many strategies
Using optimization techniques, the model seeks to maximize expected risk-adjusted returns1 while controlling tracking error, turnover, and transaction costs. From there, strategy-specific constraints are applied to shape final outcomes:
Core equity strategies target market-like exposures with modest tracking error. Dividend strategies introduce income-focused constraints. Low volatility (low vol) portfolios emphasize beta reduction. Long/short strategies explicitly cap market exposure at approximately 50%. Diagram 2 below illustrates how this approach is applied to low-vol portfolio construction:
Diagram 2. Low volatility portfolio construction
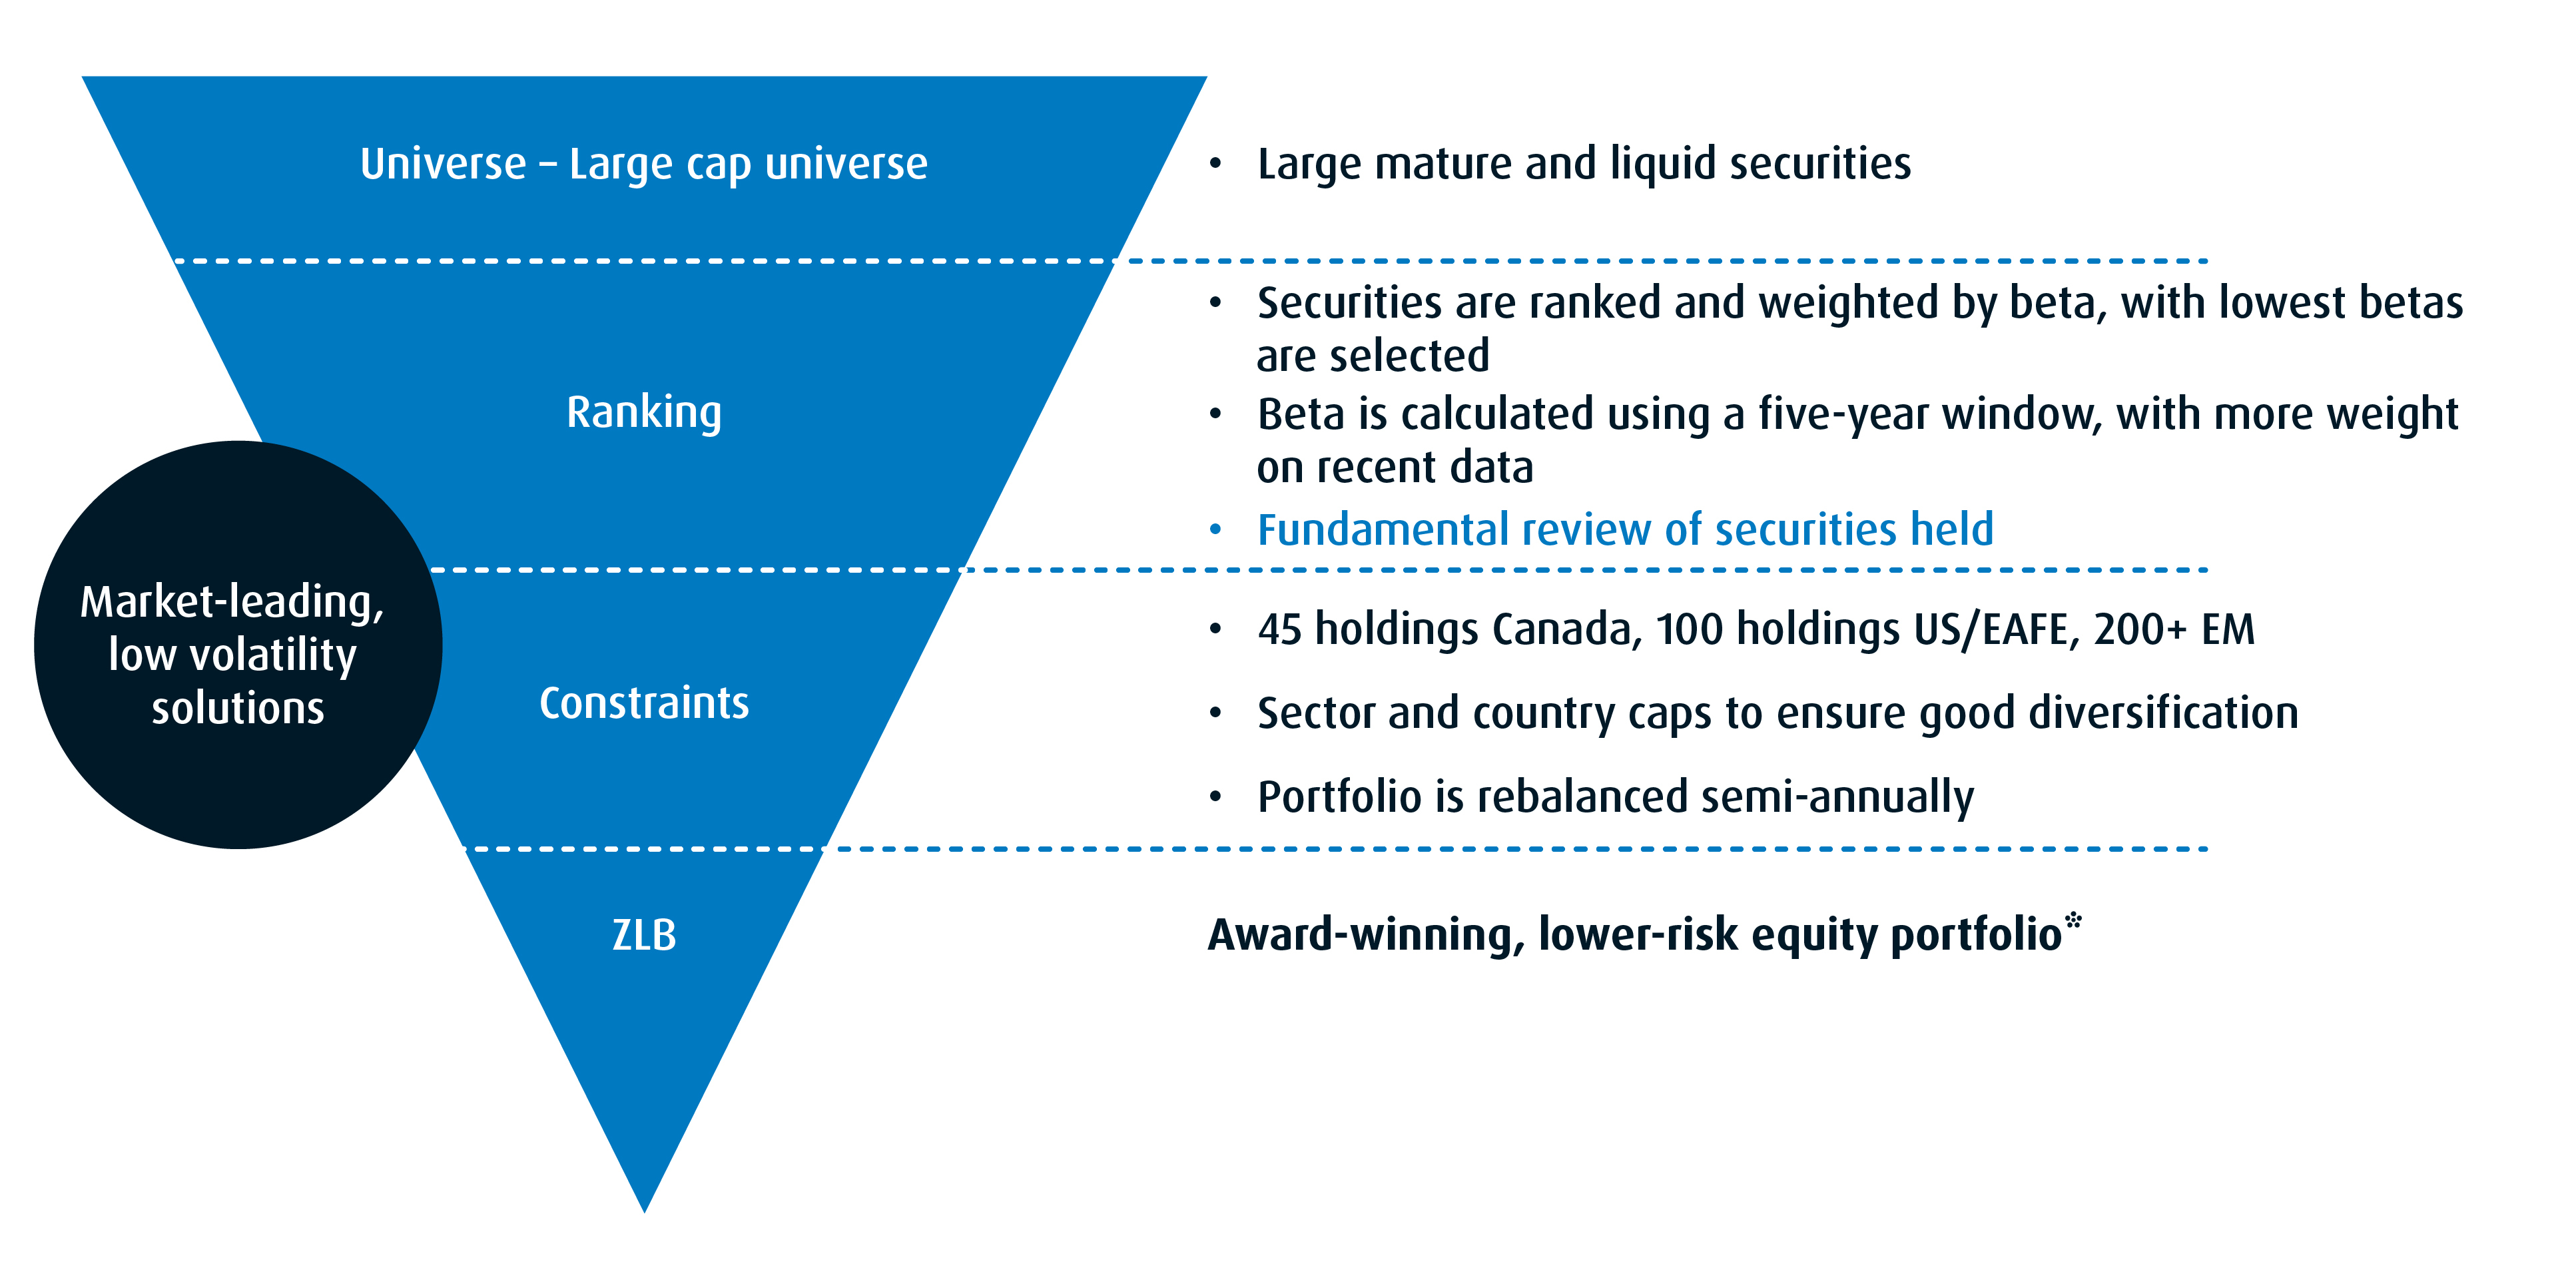
The key point is that stock selection remains consistent. What changes are the constraints. For allocators, this means different risk profiles can be combined without introducing competing investment philosophies.
For family offices and investment counsellors, the appeal of this framework lies in its clarity. Alpha is centralized while outcomes are engineered through strategy-specific constraints. This makes it easier to construct portfolios across client objectives — growth, income, defense — without introducing conflicting philosophies. It also enhances due diligence, as each strategy can be evaluated through the same methodological lens.
Since 2010, the Quantitative Investment team has developed and implemented a platform capable of delivering multiple outcomes without compromising discipline, which may be the most compelling feature of all: when markets change — as they always do — strength of process often determines success.
Please contact your BMO institutional sales partner for additional market insights.
1 Return (risk-adjusted): A measure of investment performance taking into consideration how much risk/volatility was assumed to generate it. Consider two investments, both of which return 10% over a given time period. The investment with the greater risk-adjusted return would be the one that experienced less price fluctuation. Two of the most commonly used measures of risk adjusted returns are Sharpe and Sortino ratios.
2 About the Fundata FundGrade A + Rating FundGrade A+® is used with permission from Fundata Canada Inc., all rights reserved. The annual FundGrade A+® Awards are presented by Fundata Canada Inc. to recognize the “best of the best” among Canadian investment funds. The FundGrade A+® calculation is supplemental to the monthly FundGrade ratings and is calculated at the end of each calendar year. The FundGrade rating system evaluates funds based on their risk-adjusted performance, measured by Sharpe Ratio, Sortino Ratio, and Information Ratio. The score for each ratio is calculated individually, covering all time periods from 2 to 10 years. The scores are then weighted equally in calculating a monthly FundGrade. The top 10% of funds earn an A Grade; the next 20% of funds earn a B Grade; the next 40% of funds earn a C Grade; the next 20% of funds receive a D Grade; and the lowest 10% of funds receive an E Grade. To be eligible, a fund must have received a FundGrade rating every month in the previous year. The FundGrade A+® uses a GPA-style calculation, where each monthly FundGrade from “A” to “E” receives a score from 4 to 0, respectively. A fund’s average score for the year determines its GPA. Any fund with a GPA of 3.5 or greater is awarded a FundGrade A+® Award. For more information, see http://www.fundgradeawards.com. Although Fundata makes every effort to ensure the accuracy and reliability of the data contained herein, the accuracy is not guaranteed by Fundata. The FundGrade A+ Awards and the FundGrade Ratings being referenced are calculated based on comparisons of performance of investment funds within a specified category established by the CIFSC.
ETF performance (%)
Ticker |
Year-to-date |
1-month |
3-month |
6-month |
1-year |
3-year |
5-year |
10-year |
Since inception |
Inception date |
ZLB |
25.26% |
0.09% |
5.37% |
10.08% |
25.26% |
16.48% |
14.11% |
11.33% |
12.78% |
2011-10-21 |
ZLU |
6.63% |
-3.21% |
-2.02% |
5.82% |
6.63% |
7.79% |
10.28% |
9.23% |
13.20% |
2013-03-19 |
ZDV |
28.70% |
1.56% |
6.39% |
17.41% |
28.70% |
17.62% |
15.54% |
11.29% |
9.03% |
2011-10-21 |
ZDI |
25.56% |
1.78% |
4.97% |
12.75% |
25.56% |
17.39% |
12.88% |
8.35% |
8.05% |
2014-11-05 |
ZDY |
10.14% |
-1.68% |
1.17% |
10.01% |
10.14% |
13.22% |
12.80% |
10.44% |
13.03% |
2013-03-19 |
ZLI |
13.52% |
-1.27% |
-0.89% |
-0.76% |
13.52% |
11.76% |
5.89% |
5.32% |
6.16% |
2015-09-02 |
ZLSC |
20.64% |
0.53% |
4.99% |
9.21% |
20.64% |
— |
— |
— |
20.64% |
2023-09-27 |
ZLSU |
4.99% |
-3.36% |
-3.05% |
1.94% |
4.99% |
— |
— |
— |
18.63% |
2023-09-27 |
Source: BMO Global Asset Management, as of December 31, 2025. Past performance is not indicative of future results.
Fund performance (%)
Fund name |
Year-to-date |
1-month |
3-month |
6-month |
1-year |
3-year |
5-year |
10-year |
Since inception |
Inception date |
BMO Canadian Equity Fund BMO 95135 Series F CAD |
28.46 |
0.93 |
4.89 |
16.06 |
28.46 |
20.52 |
15.38 |
11.07 |
9.64 |
2008-11-03 |
BMO Canadian Smart Alpha Equity Fund BMO 88155 Series F CAD |
22.36 |
0.97 |
3.3 |
9.48 |
22.36 |
16.76 |
13.6 |
10.36 |
9.35 |
2003-07-15 |
BMO International Equity Fund BMO 95239 Series F CAD |
27.8 |
0.79 |
3.43 |
10.28 |
27.8 |
20.36 |
11.42 |
— |
7.29 |
2017-08-17 |
Source: BMO Global Asset Management (F Series), as of December 31, 2025. Past performance is not indicative of future results.
Disclaimers
For Advisor and institutional use.
This article is for information purposes only. The information contained herein is not, and should not be construed as investment, tax or legal advice to any party. Particular investments and/or trading strategies should be evaluated relative to the individual’s investment objectives and professional advice should be obtained with respect to any circumstance.
The viewpoints expressed by the author represent their assessment of the markets at the time of publication. Those views are subject to change without notice at any time. The information provided herein does not constitute a solicitation of an offer to buy, or an offer to sell securities nor should the information be relied upon as investment advice. Past performance is no guarantee of future results. This communication is intended for informational purposes only.
Any statement that necessarily depends on future events may be a forward-looking statement. Forward-looking statements are not guarantees of performance. They involve risks, uncertainties and assumptions. Although such statements are based on assumptions that are believed to be reasonable, there can be no assurance that actual results will not differ materially from expectations. Investors are cautioned not to rely unduly on any forward-looking statements. In connection with any forward-looking statements, investors should carefully consider the areas of risk described in the most recent prospectus.
Commissions, management fees and expenses all may be associated with investments in exchange-traded funds. Please read the ETF Facts or prospectus of the BMO ETFs before investing. The indicated rates of return are the historical annual compounded total returns including changes in unit value and reinvestment of all dividends or distributions and do not take into account sales, redemption, distribution or optional charges or income taxes payable by any unitholder that would have reduced returns. Exchange-traded funds are not guaranteed, their values change frequently and past performance may not be repeated.
Distribution yields are calculated by using the most recent regular distribution, or expected distribution, (which may be based on income, dividends, return of capital, and option premiums, as applicable) and excluding additional year end distributions, and special reinvested distributions annualized for frequency, divided by current net asset value (NAV). The yield calculation does not include reinvested distributions.
Distributions are not guaranteed, may fluctuate and are subject to change and/or elimination. Distribution rates may change without notice (up or down) depending on market conditions and NAV fluctuations.
The payment of distributions should not be confused with the BMO ETF’s performance, rate of return or yield. If distributions paid by a BMO ETF are greater than the performance of the investment fund, your original investment will shrink. Distributions paid as a result of capital gains realized by a BMO ETF, and income and dividends earned by a BMO ETF, are taxable in your hands in the year they are paid.
Your adjusted cost base will be reduced by the amount of any returns of capital. If your adjusted cost base goes below zero, you will have to pay capital gains tax on the amount below zero.
Cash distributions, if any, on units of a BMO ETF (other than accumulating units or units subject to a distribution reinvestment plan) are expected to be paid primarily out of dividends or distributions, and other income or gains, received by the BMO ETF less the expenses of the BMO ETF, but may also consist of non-taxable amounts including returns of capital, which may be paid in the manager’s sole discretion. To the extent that the expenses of a BMO ETF exceed the income generated by such BMO ETF in any given month, quarter, or year, as the case may be, it is not expected that a monthly, quarterly, or annual distribution will be paid. Distributions, if any, in respect of the accumulating units of BMO Short Corporate Bond Index ETF, BMO Short Federal Bond Index ETF, BMO Short Provincial Bond Index ETF, BMO Ultra Short-Term Bond ETF and BMO Ultra Short-Term US Bond ETF will be automatically reinvested in additional accumulating units of the applicable BMO ETF. Following each distribution, the number of accumulating units of the applicable BMO ETF will be immediately consolidated so that the number of outstanding accumulating units of the applicable BMO ETF will be the same as the number of outstanding accumulating units before the distribution. Non-resident unitholders may have the number of securities reduced due to withholding tax. Certain BMO ETFs have adopted a distribution reinvestment plan, which provides that a unitholder may elect to automatically reinvest all cash distributions paid on units held by that unitholder in additional units of the applicable BMO ETF in accordance with the terms of the distribution reinvestment plan. For further information, see the distribution policy in the BMO ETFs’ prospectus.
For a summary of the risks of an investment in the BMO ETFs, please see the specific risks set out in the BMO ETF’s prospectus. BMO ETFs trade like stocks, fluctuate in market value and may trade at a discount to their net asset value, which may increase the risk of loss. Distributions are not guaranteed and are subject to change and/or elimination.
The Index is a product of S&P Dow Jones Indices LLC or its affiliates (“SPDJI”), and has been licensed for use by the Manager. S&P®, S&P 500®, US 500, The 500, iBoxx®, iTraxx® and CDX® are trademarks of S&P Global, Inc. or its affiliates (“S&P”) and Dow Jones® is a registered trademark of Dow Jones Trademark Holdings LLC (“Dow Jones”), and these trademarks have been licensed for use by SPDJI and sublicensed for certain purposes by the Manager. The ETF is not sponsored, endorsed, sold or promoted by SPDJI, Dow Jones, S&P, their respective affiliates, and none of such parties make any representation regarding the advisability of investing in such product(s) nor do they have any liability for any errors, omissions, or interruptions of the Index.
BMO ETFs are managed by BMO Asset Management Inc., an investment fund manager, a portfolio manager, and a separate legal entity from Bank of Montreal.
BMO Global Asset Management is a brand name under which BMO Asset Management Inc. and BMO Investments Inc. operate.
“BMO (M-bar roundel symbol)” is a registered trademark of Bank of Montreal, used under licence.