Quarterly Fixed Income Strategy – Q1 2024
In this report, we highlight our fixed income positioning strategies for the first quarter beginning January 1, 2024 (calendar year).


Duration:
- Bond yields were volatile, particularly further out the curve last year, as central banks moved from tightening monetary policy to using forward guidance to rein in inflation. We anticipate some of this yield curve volatility to continue at least for the first several months, as both the U.S. Federal Reserve (Fed) and the Bank of Canada (BoC) are still operating under the guise of being data-dependent.
- The Fed’s recent release of its “dot plots” in December, which shows the Federal Open Market Committee’s (FOMC) members’ expectations for the overnight rate in the future, was surprisingly dovish. This could be a mistake, as managing the market’s inflation expectations is part of its tool kit. Expectations for lower rates and larger purchases of interest rate-sensitive assets, such as homes, could potentially accelerate, which would be counter to its fight against inflation.
- Overall, we expect disinflationary forces to continue. However, with Overnight Index Swaps (OIS) currently pricing in at least five rate cuts by the Fed next year, which could be dovish in a “soft-landing” scenario. we believe it is overly dovish. Given the current economic backdrop, particularly in the U.S., five rate cuts seem too aggressive but also not enough for a hard recession scenario were it to hit. As our Portfolio Strategy Report mentioned, the runway for rate cuts may not be as long as investors think this year. Central banks likely want to see the consumer price index (CPI) move to the low 2.0% range for a sustained period before being comfortable moving rates. They may opt to pause on activity as we head into the U.S. Presidential Elections.
- We project yields will move lower at the start of 2024; however, this could revert as we progress through the year, as the market will likely price out a few rate cuts by the Fed. In Canada, similar to how the BoC was ahead of the Fed in raising rates, we believe it will be first in eventually cutting rates. While the last CPI reading in Canada was unchanged at 3.1%,1 it is the shelter component keeping the number buoyant. Shelter costs are a function of interest rates, so it should not be surprising that higher rates come with higher mortgage payments.
- Regarding duration exposure, we continue to like our barbell approach, combining short-term credit with long-term government exposure. We expect the yield curve will look to normalize this year, especially as we start seeing early signs of “green shoots” in economic recovery.
Credit:
- Wider credit spreads were a function of interest rates in 2023, as higher rates meant issuers had a more difficult time refinancing or carrying their debt loads. Refinancing becomes more economical as interest rates ease and yields have already fallen on the longer end. In the fourth quarter of last year, after the “Fed Pivot,” high-yield bond spreads tightened significantly, as measured through credit default swaps (CDX).
- From a credit perspective, we favour U.S. investment grade credit. Exposure to the U.S. economy and its diversification in sectors and mega-cap issuers benefits Canadian investors, who tend to have a heavy home bias. Lower interest rates will also take significant pressure off of certain sectors, such as U.S. banks — particularly the regional banks — which have duration-sensitive investments in their held-to-maturity (HTM) portfolios.
- Lower interest rates will benefit Canadian issuers, such as the big banks. Normalization of the yield curve will also help lending activity, as it signifies a strengthening economy. But an upward-sloping yield curve, in theory, means better profit margins for lenders. The short end of the investment grade corporate space in Canada is heavily exposed to banks, so we are becoming much more favourable to Canadian short-term corporate bond exposure.
Currency:
- After nearing a high of $1.39 Canadian dollar/$1 U.S. dollar,2 the USD began to retreat. This was partially due to technical selling, as it was nearing the high of its historical range. The Fed Pivot and the Treasury Quarterly Refunding meeting were the catalysts for lowering the USD, as it set a dovish tone. However, as the year progresses, we believe the market will anticipate fewer rate cuts from the Fed in 2024, which should provide a lift in the greenback later in the second quarter.
Model Portfolio*
ETF Name |
Ticker |
Weight (%) |
Duration |
Weighted Average |
Mgmt. Fee |
Exposure |
Positioning |
BMO Aggregate Bond Index ETF |
58.0% |
7.26 |
4.20% |
0.08% |
Canada |
Core |
|
BMO Short-Term US IG Corporate Bond Hedged to CAD Index ETF |
23.0% |
2.53 |
5.51% |
0.25% |
United States |
Core |
|
BMO Long-Term US Treasury Bond Index ETF |
6.0% |
16.93 |
4.43% |
0.20% |
United States |
Core |
|
BMO Short-Term US TIPS Index ETF (Hedged Units) |
5.0% |
2.37 |
4.94% |
0.15% |
United States |
Non-Traditional |
|
BMO Laddered Preferred Share Index ETF |
5.0% |
3.12 |
6.08% |
0.45% |
Canada |
Non-Traditional |
|
BMO Canadian Bank Income Index ETF |
3.0% |
2.18 |
6.07% |
0.25% |
Canada |
Non-Traditional |
Source: Bloomberg, BMO Asset Management Inc., as of December 18, 2023.
Fund Performance (%) |
1 Mo |
3 Mo |
1 Yr |
2 Yr |
3 Yr |
5 Yr |
SI |
Inception Date |
3.36 |
8.21 |
6.57 |
-5.99 |
-8.47 |
6.10 |
45.94 |
January 19, 2010 |
|
2.29 |
1.52 |
3.58 |
-2.91 |
-3.44 |
6.75 |
12.77 |
February 10, 2014 |
|
7.67 |
-3.86 |
-7.13 |
-32.53 |
-36.25 |
-10.87 |
-12.52 |
February 28, 2017 |
|
1.00 |
1.06 |
2.54 |
-0.08 |
- |
- |
4.31 |
January 20, 2021 |
|
10.15 |
9.11 |
4.48 |
-11.17 |
12.13 |
14.37 |
5.14 |
November 14, 2012 |
|
1.80 |
4.40 |
6.72 |
- |
- |
- |
-1.00 |
January 24, 2022 |
BMO Global Asset Management, as of November 30, 2023.
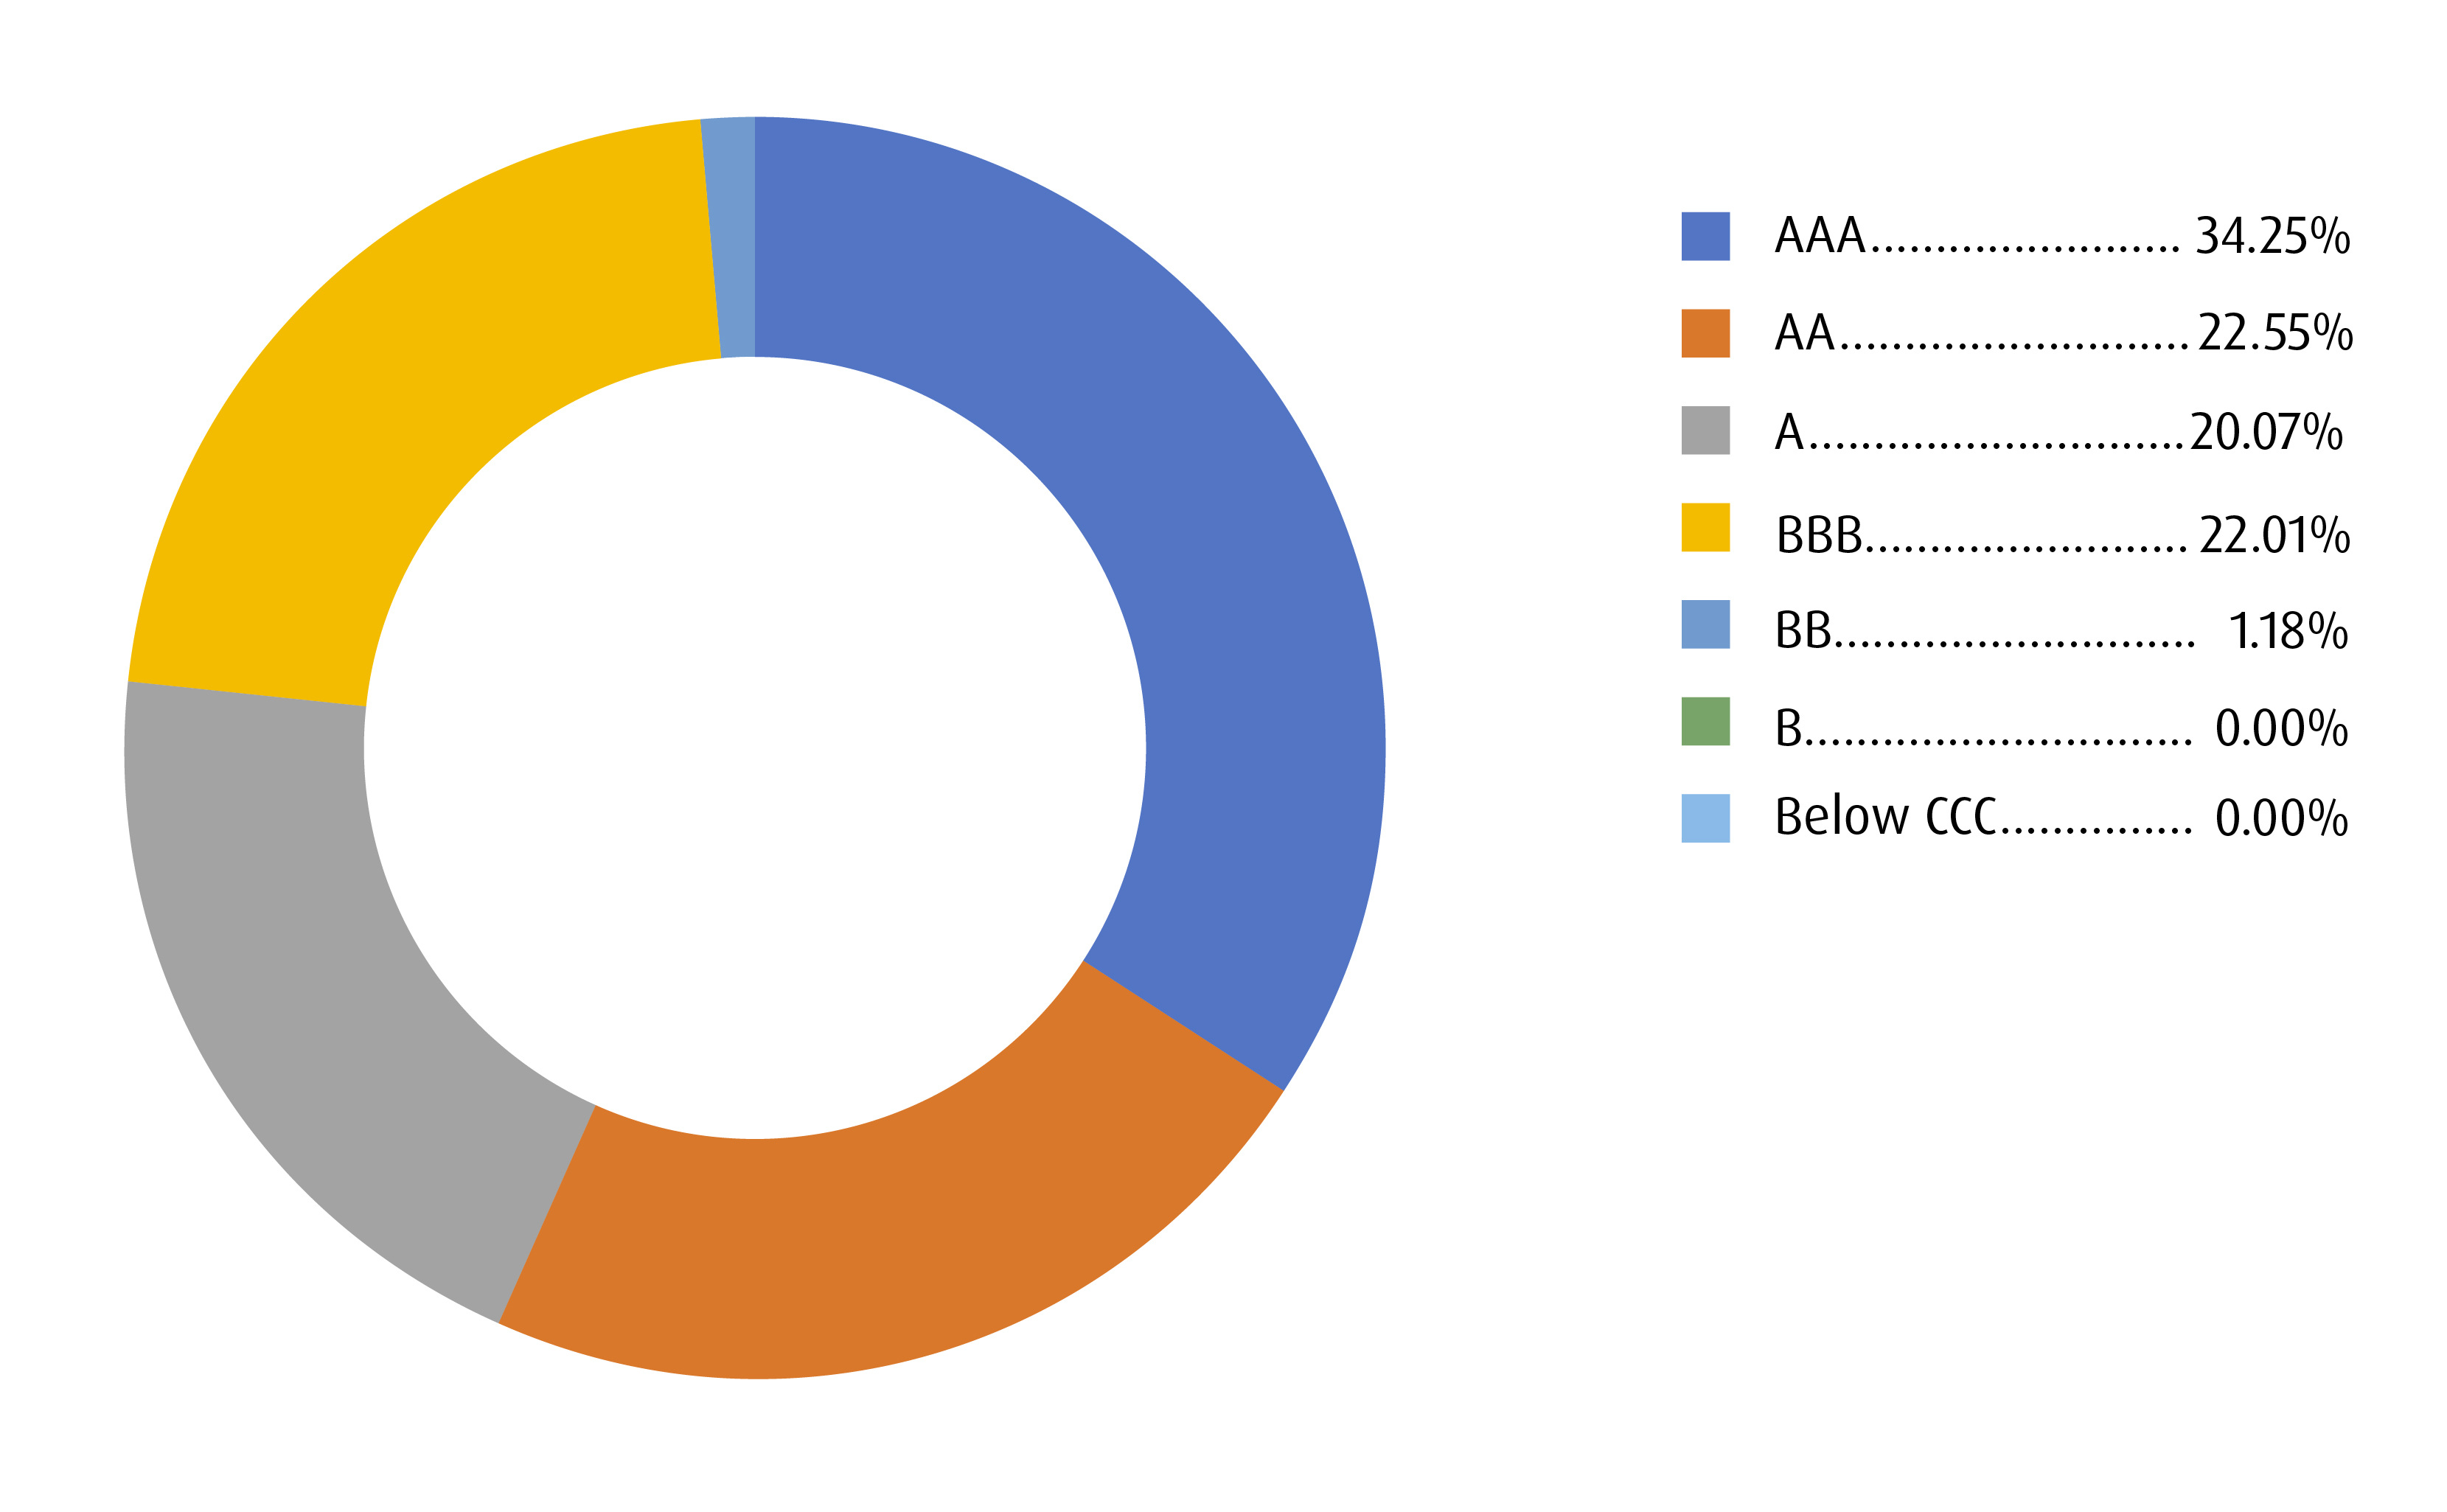
Credit Summary*
Term Summary*
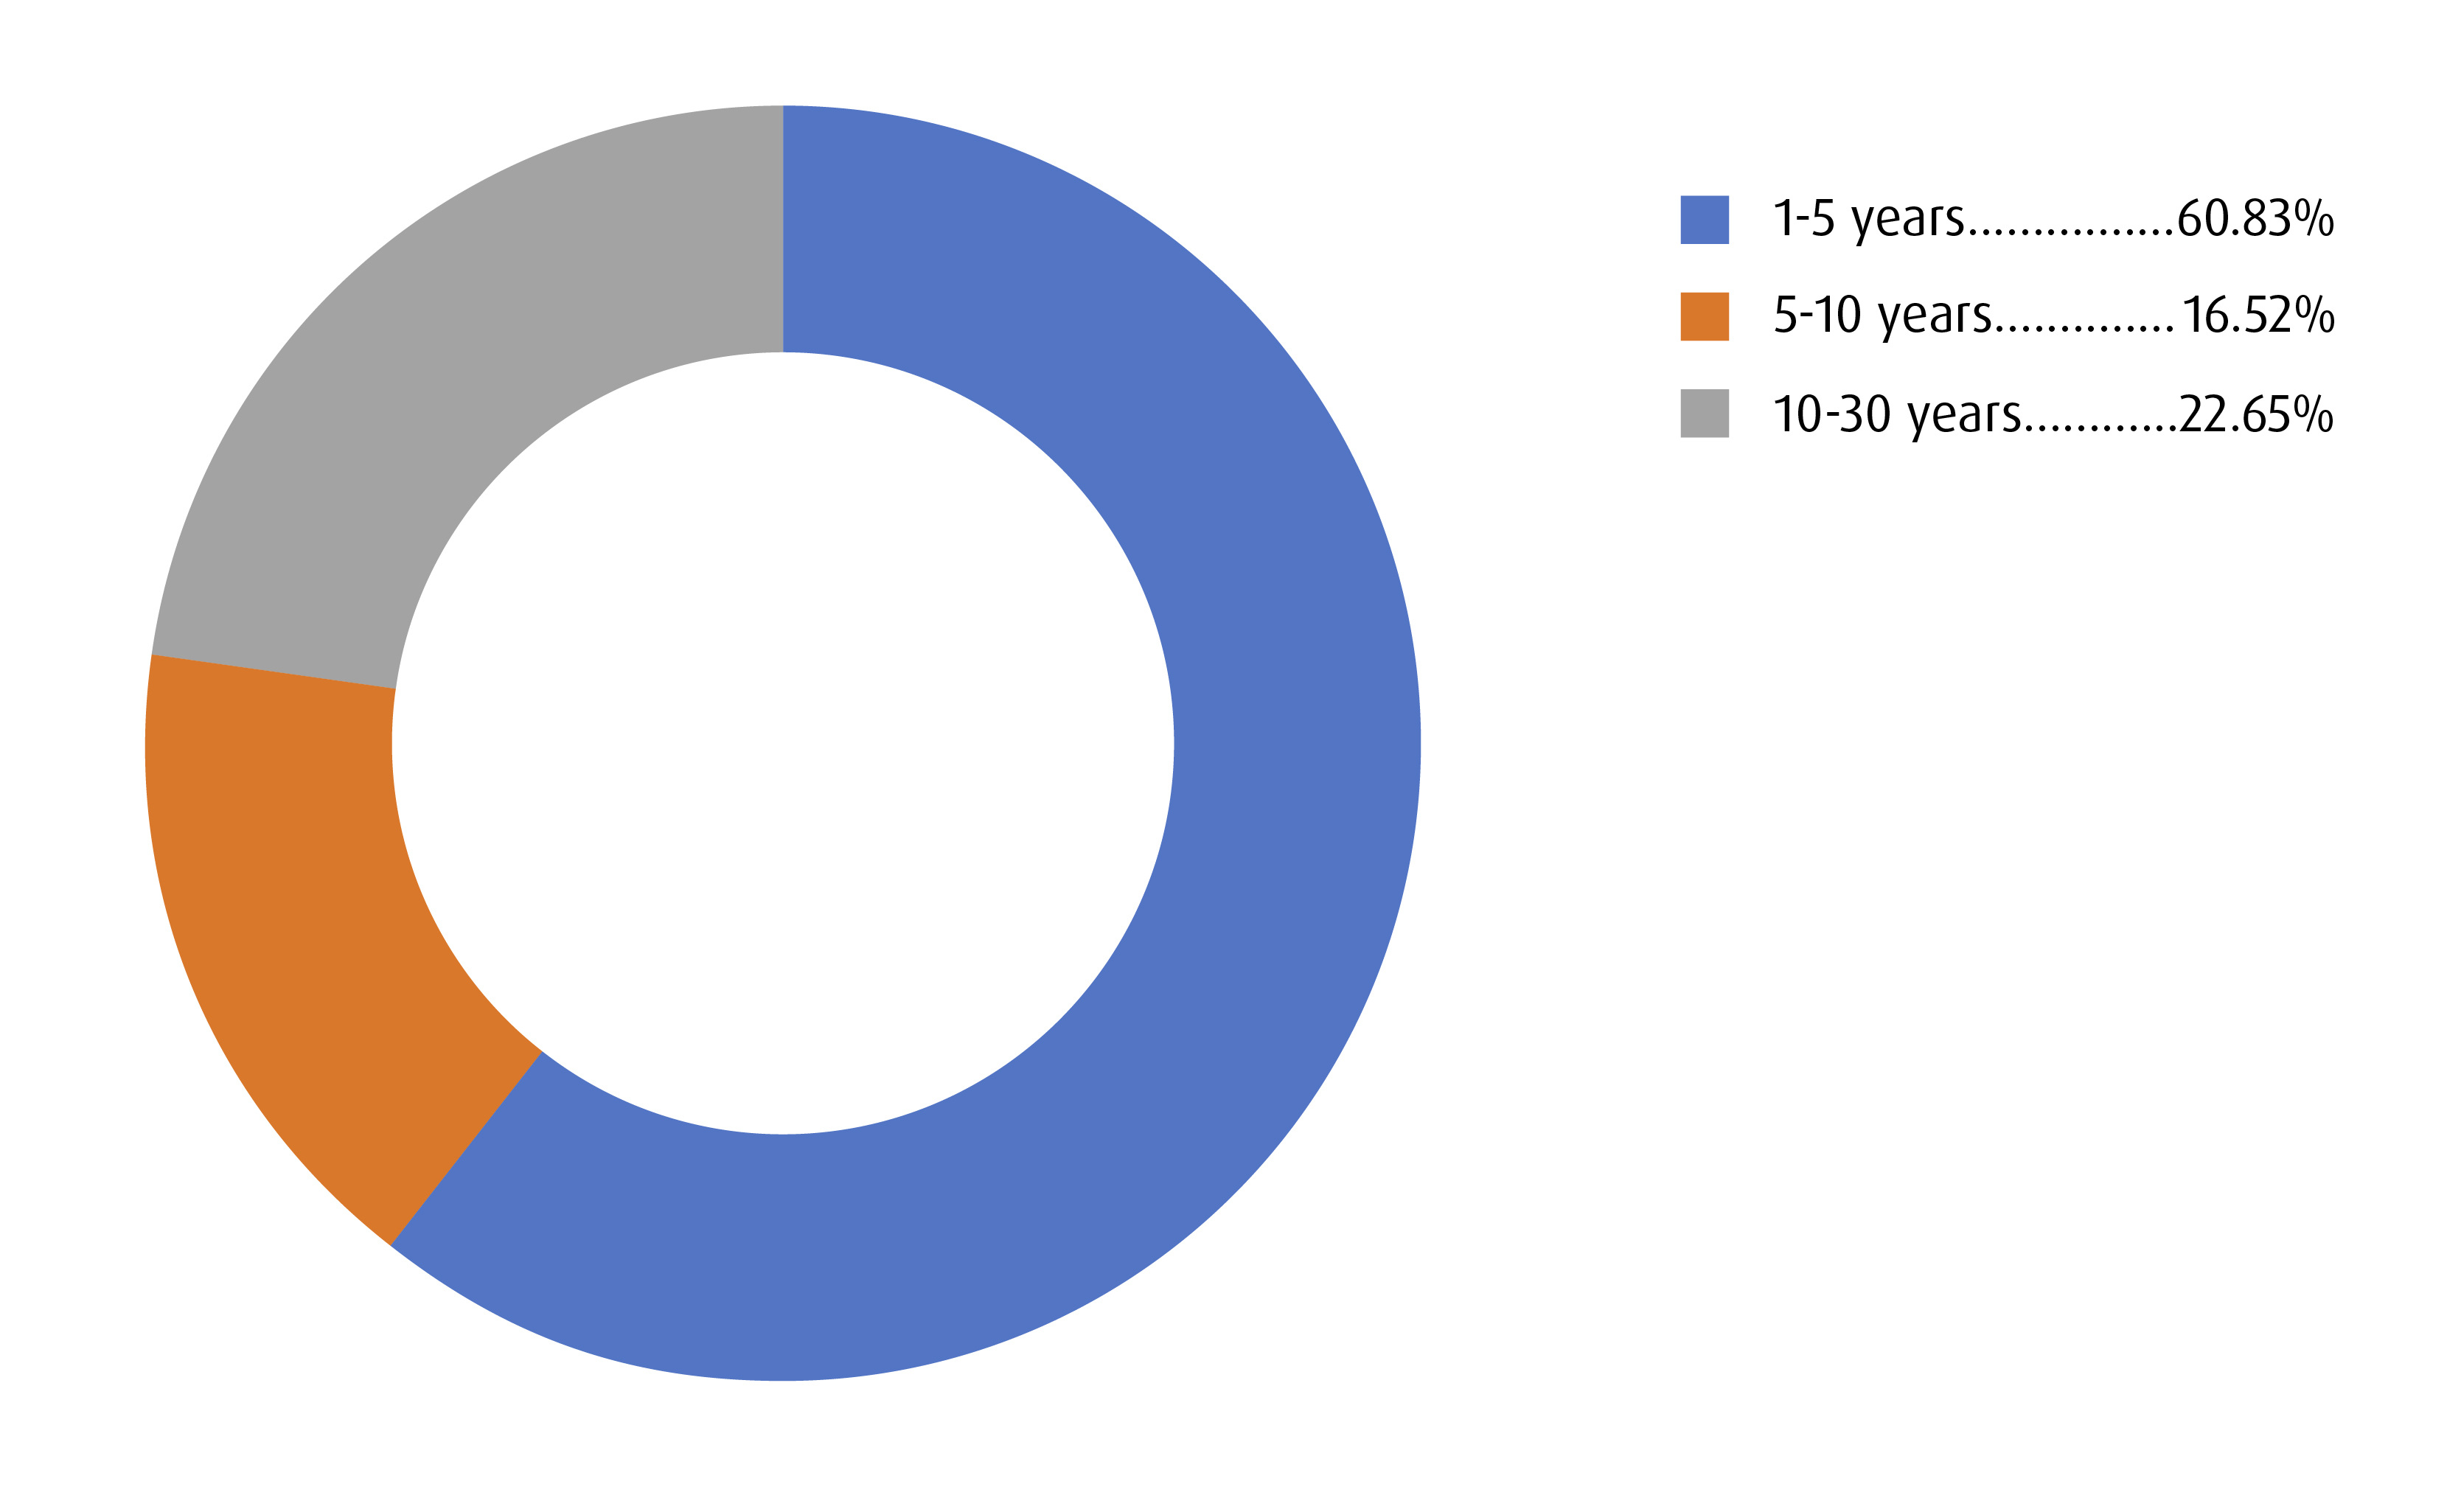
*As of July 17, 2023. Please note yields will change from month to month based on market conditions.
The portfolio holdings are subject to change without notice. They are not recommendations to buy or sell any particular security.
Weighted Average Yield to Maturity: The market value weighted average yield to maturity includes the coupon payments and any capital gain or loss that the investor will realize by holding the bonds to maturity.
Definitions:
Duration: A measure of the sensitivity of the price of a fixed income investment to a change in interest rates. Duration is expressed as number of years. The price of a bond with a longer duration would be expected to rise (fall) more than the price of a bond with lower duration when interest rates fall (rise).
Yield Curve: A line that plots the interest rates of bonds having equal credit quality but differing maturity dates. A normal or steep yield curve indicates that long-term interest rates are higher than short-term interest rates. A flat yield curve indicates that short-term rates are in line with long-term rates, whereas an inverted yield curve indicates that short-term rates are higher than long-term rates.
Credit Risk: An assessment of the creditworthiness of a borrower in general terms or with respect to a particular debt or financial obligation. Credit risk is the risk of default on a debt that may arise from a borrower failing to make required payment.
Q1 2024 BMO ETF Portfolio Strategy Report >
Visit bmo.com/etfs or contact Client Services at 1−800−361−1392.
1 Consumer Price Index. Statistics Canada, December 19, 2023.
2 Bloomberg, October 31, 2023.
Disclosures
Any statement that necessarily depends on future events may be a forward-looking statement. Forward-looking statements are not guarantees of performance. They involve risks, uncertainties and assumptions. Although such statements are based on assumptions that are believed to be reasonable, there can be no assurance that actual results will not differ materially from expectations. Investors are cautioned not to rely unduly on any forward-looking statements. In connection with any forward-looking statements, investors should carefully consider the areas of risk described in the most recent simplified prospectus.
This communication is intended for informational purposes only and is not, and should not be construed as, investment and/or tax advice to any individual. Particular investments and/or trading strategies should be evaluated relative to each individual’s circumstances. Individuals should seek the advice of professionals, as appropriate, regarding any particular investment. Investors cannot invest directly in an index.
The viewpoints expressed by the Portfolio Manager represents their assessment of the markets at the time of publication. Those views are subject to change without notice at any time without any kind of notice. The information provided herein does not constitute a solicitation of an offer to buy, or an offer to sell securities nor should the information be relied upon as investment advice. Past performance is no guarantee of future results. This communication is intended for informational purposes only.
Commissions, management fees and expenses all may be associated with investments in exchange traded funds. Please read the ETF Facts or prospectus of the BMO ETFs before investing. The indicated rates of return are the historical annual compounded total returns including changes in unit value and reinvestment of all dividends or distributions and do not take into account sales, redemption, distribution or optional charges or income taxes payable by any unitholder that would have reduced returns. Exchange traded funds are not guaranteed, their values change frequently and past performance may not be repeated.
For a summary of the risks of an investment in the BMO ETFs, please see the specific risks set out in the BMO ETF’s prospectus. BMO ETFs trade like stocks, fluctuate in market value and may trade at a discount to their net asset value, which may increase the risk of loss. Distributions are not guaranteed and are subject to change and/or elimination.
BMO ETFs are managed by BMO Asset Management Inc., which is an investment fund manager and a portfolio manager, and a separate legal entity from Bank of Montreal.
BMO Global Asset Management is a brand name under which BMO Asset Management Inc. and BMO Investments Inc. operate.
®/™Registered trademarks/trademark of Bank of Montreal, used under licence.