Reap the Rewards of Swapping Standalone Bonds for ETF Efficiencies


BMO ETFs has introduced a process to convert individual Canadian bonds into shares in corresponding ETFs, allowing Investment Counsellors and managers to shrink costs and boost performance, among other benefits. Erika Toth, Director, Institutional & Advisory Sales & Services, Eastern Canada, explains.
After a year and a half of historic interest rate increases, the bond yield revival is in full swing, with many investors allocating ever-greater percentages of their portfolios to bonds, GICs, money markets and high-interest savings accounts (HISAs).
No less than seven of BMO Global Asset Management’s 10 best-selling ETFs this year are bond ETFs, directly reflecting this shift.
While our money market ETF and ultra short-term bond solutions have been popular, our two best sellers are, in fact, the BMO Long Federal Bond Index ETF (ticker: ZFL) and BMO Mid Federal Bond Index ETF (ticker: ZFM), as Investment Counsellors and managers look to lengthen duration as a hedge for peaking rates as well as any pullback in markets.
Not only are current rates more compelling than they have been compared to any other point over the previous 15 to 20 years, but as rates have ratcheted up, big swaths of the bond market are trading at a discount — opening up opportunities to take advantage of capital gains as bonds mature and converge to par value.
While many portfolio managers are relying on standalone bond exposures, the tactic is not without some drawbacks. High trading costs, wider spreads, and a lack of liquidity must be factored in when analyzing their suitability. And as more positions are accumulated, there is also the potential for line-item fatigue.
Relative to individual bonds, ETFs provide significant benefits to investors, not least the ability to achieve instant diversification through a single trade as well as provide ample liquidity benefits for investors who are looking to manage a specific allocation or model across several client accounts.
Spread differentials also tend to favour ETFs over individual bonds. ETFs (at worst) will trade at bid-offer spreads that are equal to the underlying fixed income bonds, but generally trade at significantly tighter spreads, due to the secondary liquidity that is available on the exchange. More on this below.
Generally, ETFs provide investors with a cost-efficient, diversified, and scalable solution for fixed income, providing overall better tactical flexibility, and the ability to precisely target duration and exposure to meet client investment objectives.
Convert individual bonds
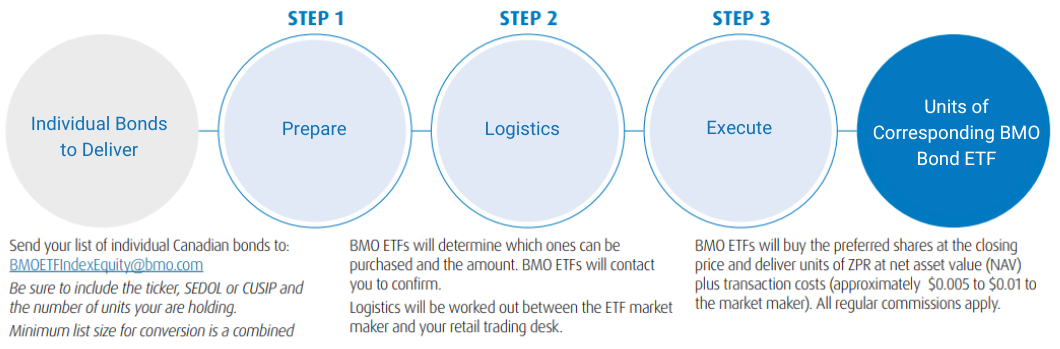
For those reasons, BMO has introduced a process in which an investor can convert their individual Canadian bonds (or rate reset preferred shares) for shares in a corresponding ETF. For example, Canadian corporate bonds with a duration of five years or less can easily be converted directly into shares of BMO Short Corporate Bond Index ETF (ticker: ZCS). This process enables an investor to take full advantage of the benefits of ETFs, while providing standardization, transparency, and diversification across client accounts.
That is, of course, far from the only option available. BMO ETFs is the largest provider of fixed income ETFs in Canada, by AUM and by number of exposures offered.1
Conversion process
ETFs’ spread costs, while a factor when considering an allocation, can often be lower than spreads on individual bonds for Investment Counsellors and Family Offices, particularly with corporate bonds, which are sometimes more challenging to trade. As the examples below illustrate, the spreads that both the retail and institutional channels are subjected to are higher, in some cases substantially. The cost savings can be significant, boosting performance over the long term.
| Ticker | Maturity | Credit | Institutional Spread | ETF Spread |
| Bid/Ask Spread of Underlying Units | ||||
| ZAG – BMO Aggregate Bond Index ETF | Aggregate | Aggregate | 0.30% | 0.07% |
| ZDB -BMO Discount Bond Index ETF | Aggregate | Federal, Provincial, Corporate | 0.25% | 0.06% |
| ZFS – BMO Short Federal Bond Index ETF | Short | Federal | 0.03% | 0.07% |
| ZFM – BMO Mid Federal Bond Index ETF | Mid | Federal | 0.08% | 0.07% |
| ZFL – BMO Long Federal Bond Index ETF | Long | Federal | 0.24% | 0.14% |
| ZPS – BMO Short Provincial Bond Index ETF | Short | Provincial | 0.04% | 0.07% |
| ZMP – BMO Mid Provincial Bond Index ETF | Mid | Provincial | 0.08% | 0.07% |
| ZPL – BMO Long Provincial Bond Index ETF | Long | Provincial | 0.18% | 0.15% |
| ZST – BMO Ultra Short-Term Bond ETF | Short | Federal, Provincial, Corporate | 0.02% | 0.02% |
| ZCS – BMO Short Corporate Bond Index ETF | Short | Corporate | 0.13% | 0.08% |
| ZCM – BMO Mid Corporate Bond Index ETF | Mid | Corporate | 0.30% | 0.20% |
| ZLC – BMO Long Corporate Bond Index ETF | Long | Corporate | 0.62% | 0.20% |
Source: FTSE Russell Index (FTSE), BMO Global Asset Management, as of March 16, 2023.
Recent trends
Reflecting the shift in asset allocation toward fixed income this year, seven of BMO’s top 10 ETFs are in fixed income, as mentioned above. While the BMO Money Market Fund ETF Series (ticker: ZMMK) and BMO Ultra Short-Term Bond ETF (ticker: ZST) remain popular choices), our two best sellers are, in fact, the BMO Long Federal Bond Index ETF (ticker: ZFL) and BMO Mid Federal Bond Index ETF (ticker: ZFM) – reflecting a desire among managers to lengthen duration, and hedge for peaking rates and any pullback in markets.2
Bonds dominate top selling ETFs2
Fund |
Ticker |
AUM [$M] |
Flows |
ZFL |
2635.17 |
1195.2 |
|
ZEB |
3784.27 |
1069.7 |
|
ZFM |
978.43 |
728.4 |
|
ZEA |
6664.53 |
717.7 |
|
ZMU |
2875.57 |
634.7 |
|
ZMMK |
794.57 |
616.1 |
|
ZIC |
3033.89 |
576.7 |
|
ZGB |
1045.02 |
482.4 |
|
ZWB |
2807.85 |
378.7 |
|
ZUAG.F |
335.6 |
343.6 |
A word on tax efficiency
As interest rates have risen to levels not seen in years, bond yields (and yield to maturity) have also increased significantly. Investors can now purchase bonds that are deeply discounted relative to their maturity value.
As a result, the fixed income market may actually offer a more attractive return opportunity than GICs and high-interest savings accounts for taxable investors. The after-tax difference can be significant for high-net worth clients — creating an opportunity for portfolio managers, Investment Counsellors and Family Offices to add value.
Again, there is an ETF efficiency. The advantage of buying an ETF that has a basket of bonds trading at a discount is that a portion of the future return will come from price appreciation (the difference between the discounted price and the maturity value back to par), which is treated as a capital gain for tax purposes.
Using a capital gains inclusion rate of 50%, means that half the capital gain is tax-free, while the other 50% is added to taxable income, with the coupon (interest) income. This compares to GICs and HISAs where 100% of the return comes from interest income and as such, is fully subjected to taxation.
Let’s review two examples comparing the BMO Ultra Short-Term Bond ETF (ticker: ZST) to a GIC in the first instance, and the BMO Short-Term Discount Bond ETF (ticker: ZSDB) in the second.
In the first scenario, using a one-year time horizon with an investment of $100 in (and assuming no changes to interest rates or credit spreads for simplicity), the pre-tax total return will equal 5.45% and, for taxable investors, will be a combination of income and capital gains, resulting in after-tax return of 3.23%, or 67 basis points above the comparable GIC that is fully taxed as interest income.
BMO Ultra Short-Term Bond ETF (ticker: ZST) vs. 1-year non-redeemable GIC
| Before Tax Return | After Tax Return | ||||||||
| Coupon | YTM | Interest Income ($) | Capital Gain ($) | Interest Income ($) | Capital Gain ($) | After Tax Return ($) | After Tax Return (%) | Difference | |
ZST | 2.86 | 5.45 | $2.86 | $2.59 | $1.33 | $1.90 | $3.23 | 3.23% | 0.67% |
| GIC | 5.50 | 5.50 | $5.50 | $0.00 | $2.56 | $0.00 | $2.56 | 2.56% | -0.67% |
Source: BMO Global Asset Management, as of July 20, 2023. YTM is calculated gross of fees.
A similar scenario can be seen comparing ZSDB to a GIC, where the after-tax return of the former tops the latter’s by approximately 29%.
BMO Short-Term Discount Bond ETF (ticker: ZSDB) vs. 1-year non-redeemable GIC vs. iShares Core Canadian Short Term Bond Index ETF (ticker: XSB), or similar ETFs such as the BMO Short-Term Bond Index ETF (ticker: ZSB) and the Vanguard Canadian Short-Term Bond Index ETF (ticker: VSB)
| Before Tax Return | After Tax Return | ||||||||
| Coupon | YTM | Interest Income ($) | Capital Gain ($) | Interest Income ($) | Capital Gain ($) | After Tax Return ($) | After Tax Return (%) | Difference | |
ZSDB | 1.32 | 5.00 | $1.32 | $3.68 | $0.61 | $2.70 | $3.31 | 3.31% | |
| GIC | 5.50 | 5.50 | $5.50 | $0.00 | $2.56 | $0.00 | $2.56 | 2.56% | -0.75% |
| XSB | 2.68 | 4.91 | $2.68 | $2.23 | $1.25 | $1.63 | $2.88 | 2.88% | -0.43% |
Source: BMO Global Asset Management, as of July 20, 2023. YTM is calculated gross of fees.
BMO’s discount bond ETF lineup can further amplify this tax benefit. The bonds in the basket are all purchased at a discount. Thus, the coupon, which is again taxed as interest, is lower, and more of the total return comes from convergence of bond prices to par value as they mature — read: capital gains.
| Fund Name | Ticker | Max Management Fee | MER | Annualized Distribution Yield | Yield to Maturity |
| BMO Discount Bond Index ETF | ZDB | 0.09% | 0.10% | 2.53% | 4.54% |
| BMO Short-Term Discount Bond ETF | ZSDB | 0.09% | 0.10% | 1.82% | 4.99% |
| BMO Corporate Discount Bond ETF | ZCDB | 0.15% | 0.17% | 2.43% | 5.49% |
Source: BMO ETFs. Yields are as of August 31, 2023.
To reiterate, ETFs provide Investment Counsellors and managers with a cost-efficient, diversified, and scalable solution for their bond allocations, giving investors better tactical flexibility, and the ability to precisely target duration and exposure to meet client objectives.
In short, they can shrink costs while boosting performance and through BMO’s process for converting individual notes into corresponding ETFs, can streamline the overall allocation, and allow it to benefit from those efficiencies.
Please contact your BMO ETF Specialist for more information about converting standalone bonds into one of our ETFs. Our Portfolio Managers are also available to help with trading insights. They can also be reached at 1−877−741−7263.
1 National Bank of Canada Financial Markets, NBCFM Research – ETF Handbook, September 5, 2023.
Disclosures:
Any statement that necessarily depends on future events may be a forward-looking statement. Forward-looking statements are not guarantees of performance. They involve risks, uncertainties and assumptions. Although such statements are based on assumptions that are believed to be reasonable, there can be no assurance that actual results will not differ materially from expectations. Investors are cautioned not to rely unduly on any forward-looking statements. In connection with any forward-looking statements, investors should carefully consider the areas of risk described in the most recent simplified prospectus.
The viewpoints expressed by the authors represents their assessment of the markets at the time of publication. Those views are subject to change without notice at any time without any kind of notice. The information provided herein does not constitute a solicitation of an offer to buy, or an offer to sell securities nor should the information be relied upon as investment advice. Past performance is no guarantee of future results. The statistics in this update are based on information believed to be reliable but not guaranteed.
This article is for information purposes. The information contained herein is not, and should not be construed as, investment, tax or legal advice to any party. Investments should be evaluated relative to the individual’s investment objectives and professional advice should be obtained with respect to any circumstance.
The payment of distributions is not guaranteed and may fluctuate. The payment of distributions should not be confused with an Exchange Traded Fund’s performance, rate of return or yield. If distributions paid by the Exchange Traded Fund are greater than the performance of the Exchange Traded Fund, your original investment will shrink. Distributions paid as a result of capital gains realized by an Exchange Traded Fund, and income and dividends earned by an Exchange Traded Fund are taxable in your hands in the year they are paid. Your adjusted cost base will be reduced by the amount of any returns of capital. If your adjusted cost base goes below zero, you will have to pay capital gains tax on the amount below zero. Please refer to the Exchange Traded Funds, distribution policy in the prospectus.
Commissions, management fees and expenses all may be associated with investments in exchange traded funds. Please read the ETF Facts or prospectus before investing. The indicated rates of return are the historical annual compounded total returns including changes in unit value and reinvestment of all dividends or distributions and do not take into account sales, redemption, distribution or optional charges or income taxes payable by any unitholder that would have reduced returns. Exchange traded funds are not guaranteed, their values change frequently and past performance may not be repeated.
For a summary of the risks of an investment in the BMO ETFs, please see the specific risks set out in the prospectus. BMO ETFs trade like stocks, fluctuate in market value and may trade at a discount to their net asset value, which may increase the risk of loss. Distributions are not guaranteed and are subject to change and/or elimination.
BMO ETFs are managed by BMO Asset Management Inc., which is an investment fund manager and a portfolio manager, and a separate legal entity from Bank of Montreal.
BMO Global Asset Management is a brand name under which BMO Asset Management Inc. and BMO Investments Inc. operate.
®/™Registered trademarks/trademark of Bank of Montreal, used under licence.