Staying allocated while safeguarding gains: Three approaches
Strong markets may have pushed portfolio returns ahead of schedule. Long-short, low-beta, and options-based strategies offer ways to protect gains, reduce risk, and remain allocated — without sacrificing long-term objectives.
Jan 26, 2026
Investing is an interesting process. A financial plan defines an investor’s required rate of return to meet objectives but, in a mass media age, near-run market returns are a constant distraction.
Markets move quickly and unexpectedly, often defying our efforts to guide outcomes. Infamous Black Swans — named so because they cannot be predicted — force-feed humility to all investors. Ultimately, cost, risk and income are the only things investors can control to any degree.
Recently, some Canadian consulting firms reported their institutional clients’ increasing concern about rising concentration risk in U.S. markets, but also their reservations about the large commodity exposure in Canada and its incumbent risks.1 This well-reasoned prudence can be a good reminder for other investors, too: risk management and attention to rebalancing should be constant components in portfolio management.
Investors have benefitted from robust markets over the past few years, potentially placing many ahead of the anticipated trajectory of their investment goals. If this is the case, it may be prudent to consider lowering their portfolio risk to insulate and protect gains.
This can be accomplished without changing asset mix. Selecting investments with lower volatility would maintain their current asset allocation, aligned to their Investment Policy Statements, but lower their overall portfolio beta to manage risk.
As the diagram below shows, there are several BMO Global Asset Management strategies that help recalibrate client portfolios, maintaining equity exposure while simultaneously dampening volatility.
Diagram 1. Managing the beta ladder
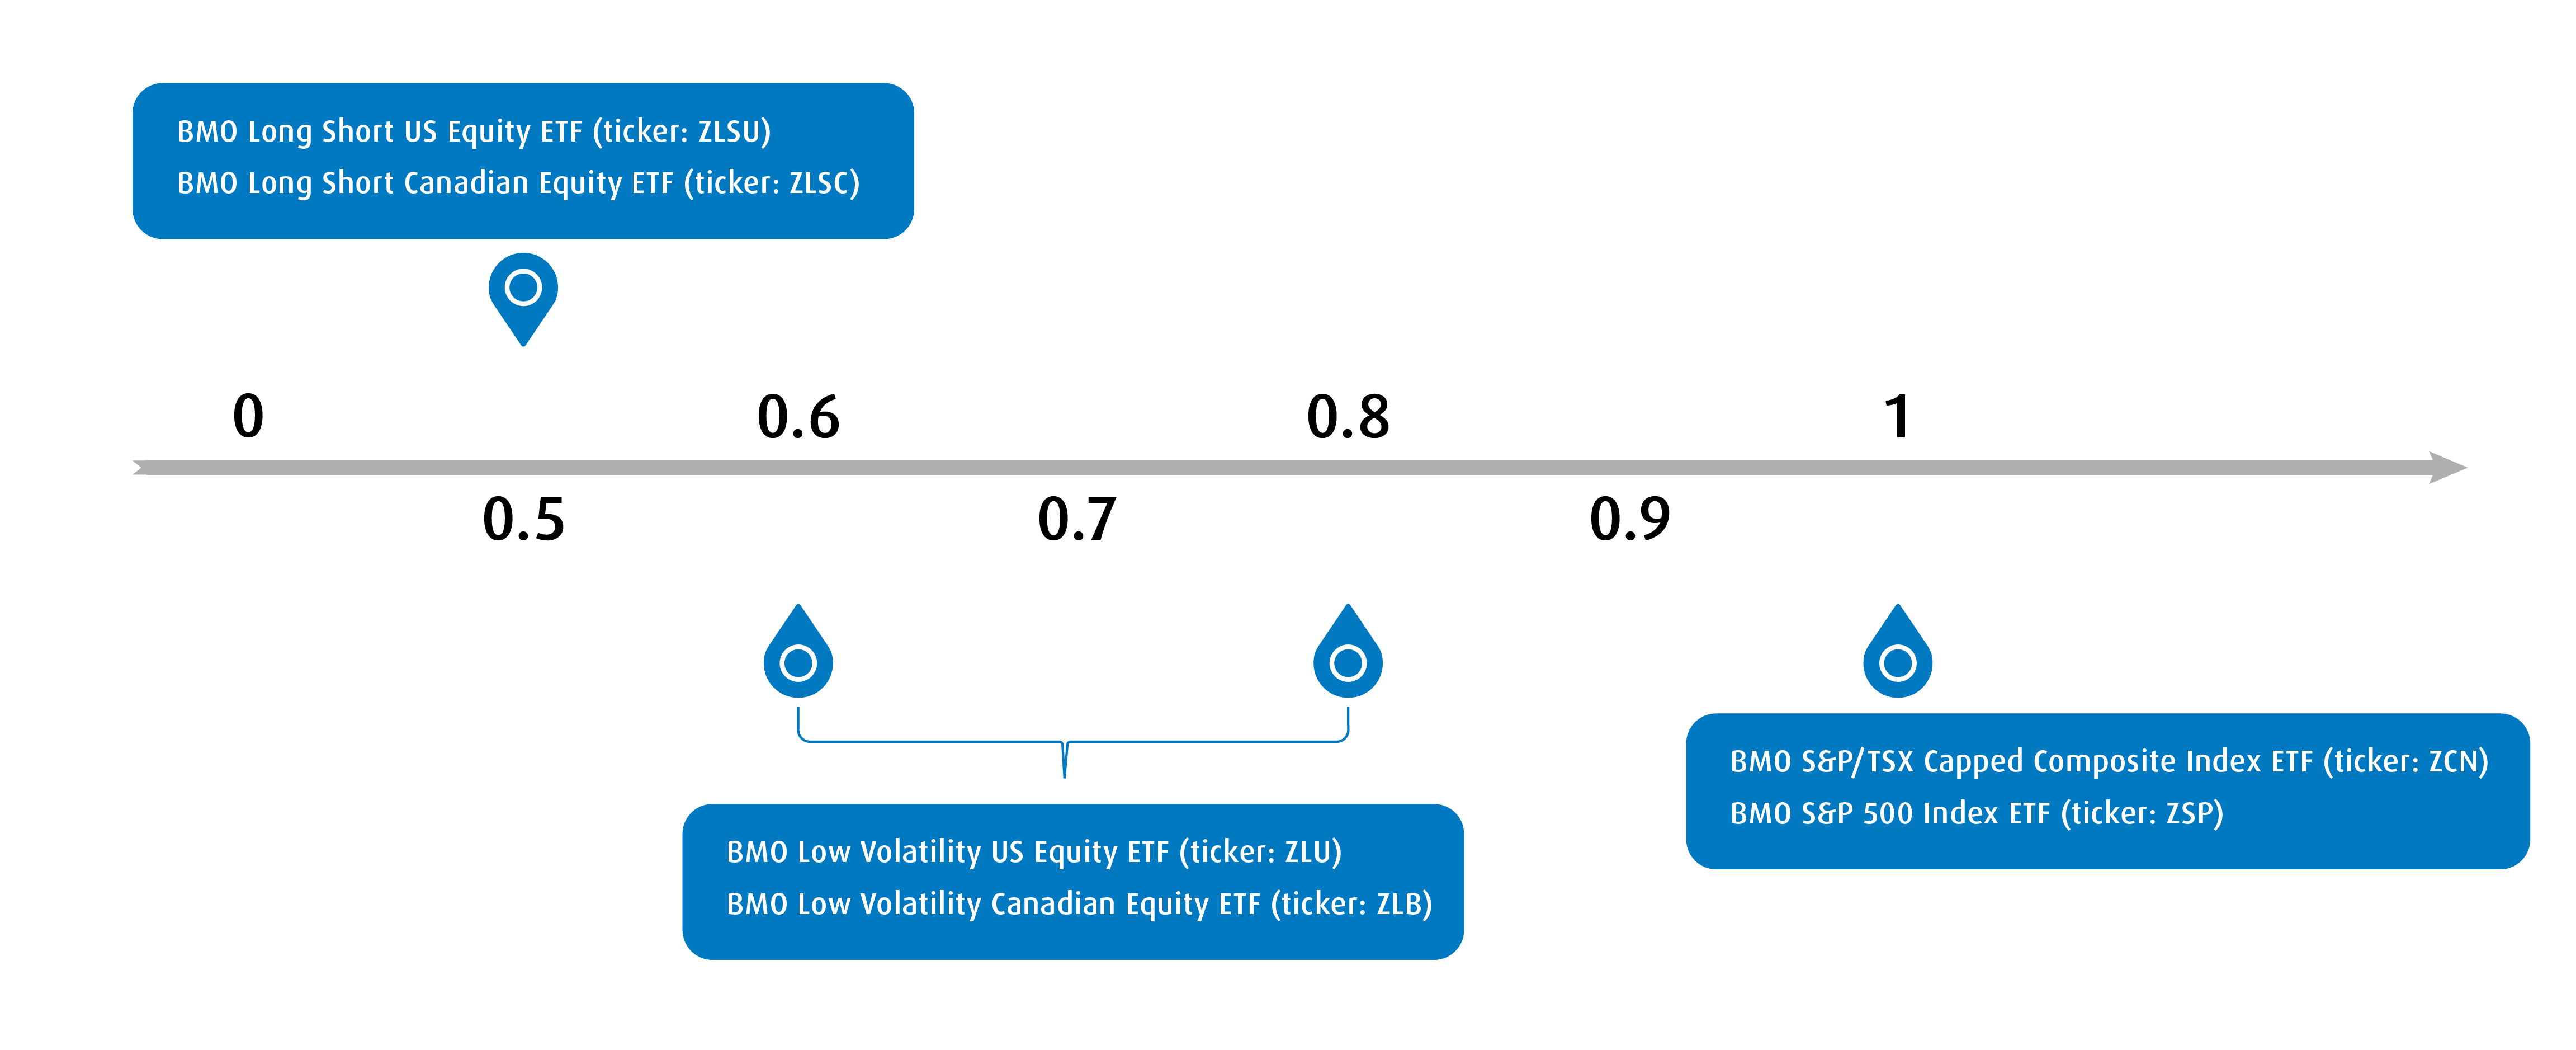
Low volatility factor
BMO’s Quantitative Investment team has developed a proprietary Low Volatility methodology that uses beta as its risk measure, a distinct advantage over Standard Deviation or Variance. beta is systematic measure whereas Standard deviation or Variance measure idiosyncratic risk. Systemic risk, measured through beta, is clearly a larger peril to investors than is idiosyncratic company risk, so it makes sense to use it as the foundation in evaluating companies.
Identifying the best risk measure, however, is only part of the risk management challenge. It is equally important to employ strong portfolio construction rules to avoid unintended risks. Unconstrained mandates may appeal intuitively, but they can produce portfolios with unintended concentration risks. This can result in concentration in sectors highly sensitive to rate changes, unwittingly introducing a risk which could otherwise be contained.
Conversely, highly constrained portfolio construction rules may produce portfolios closely resembling the parent index from which they are constructed. In Canada, for instance, adhering to sector weights produces a portfolio with large exposure to primary industries where management cannot control commodity prices.
BMO Global Asset Management deliberately addresses both extremes by implementing both sector and, if required, company limits to force diversification, thereby measuring risk at both the company and portfolio levels.
Alternative strategies
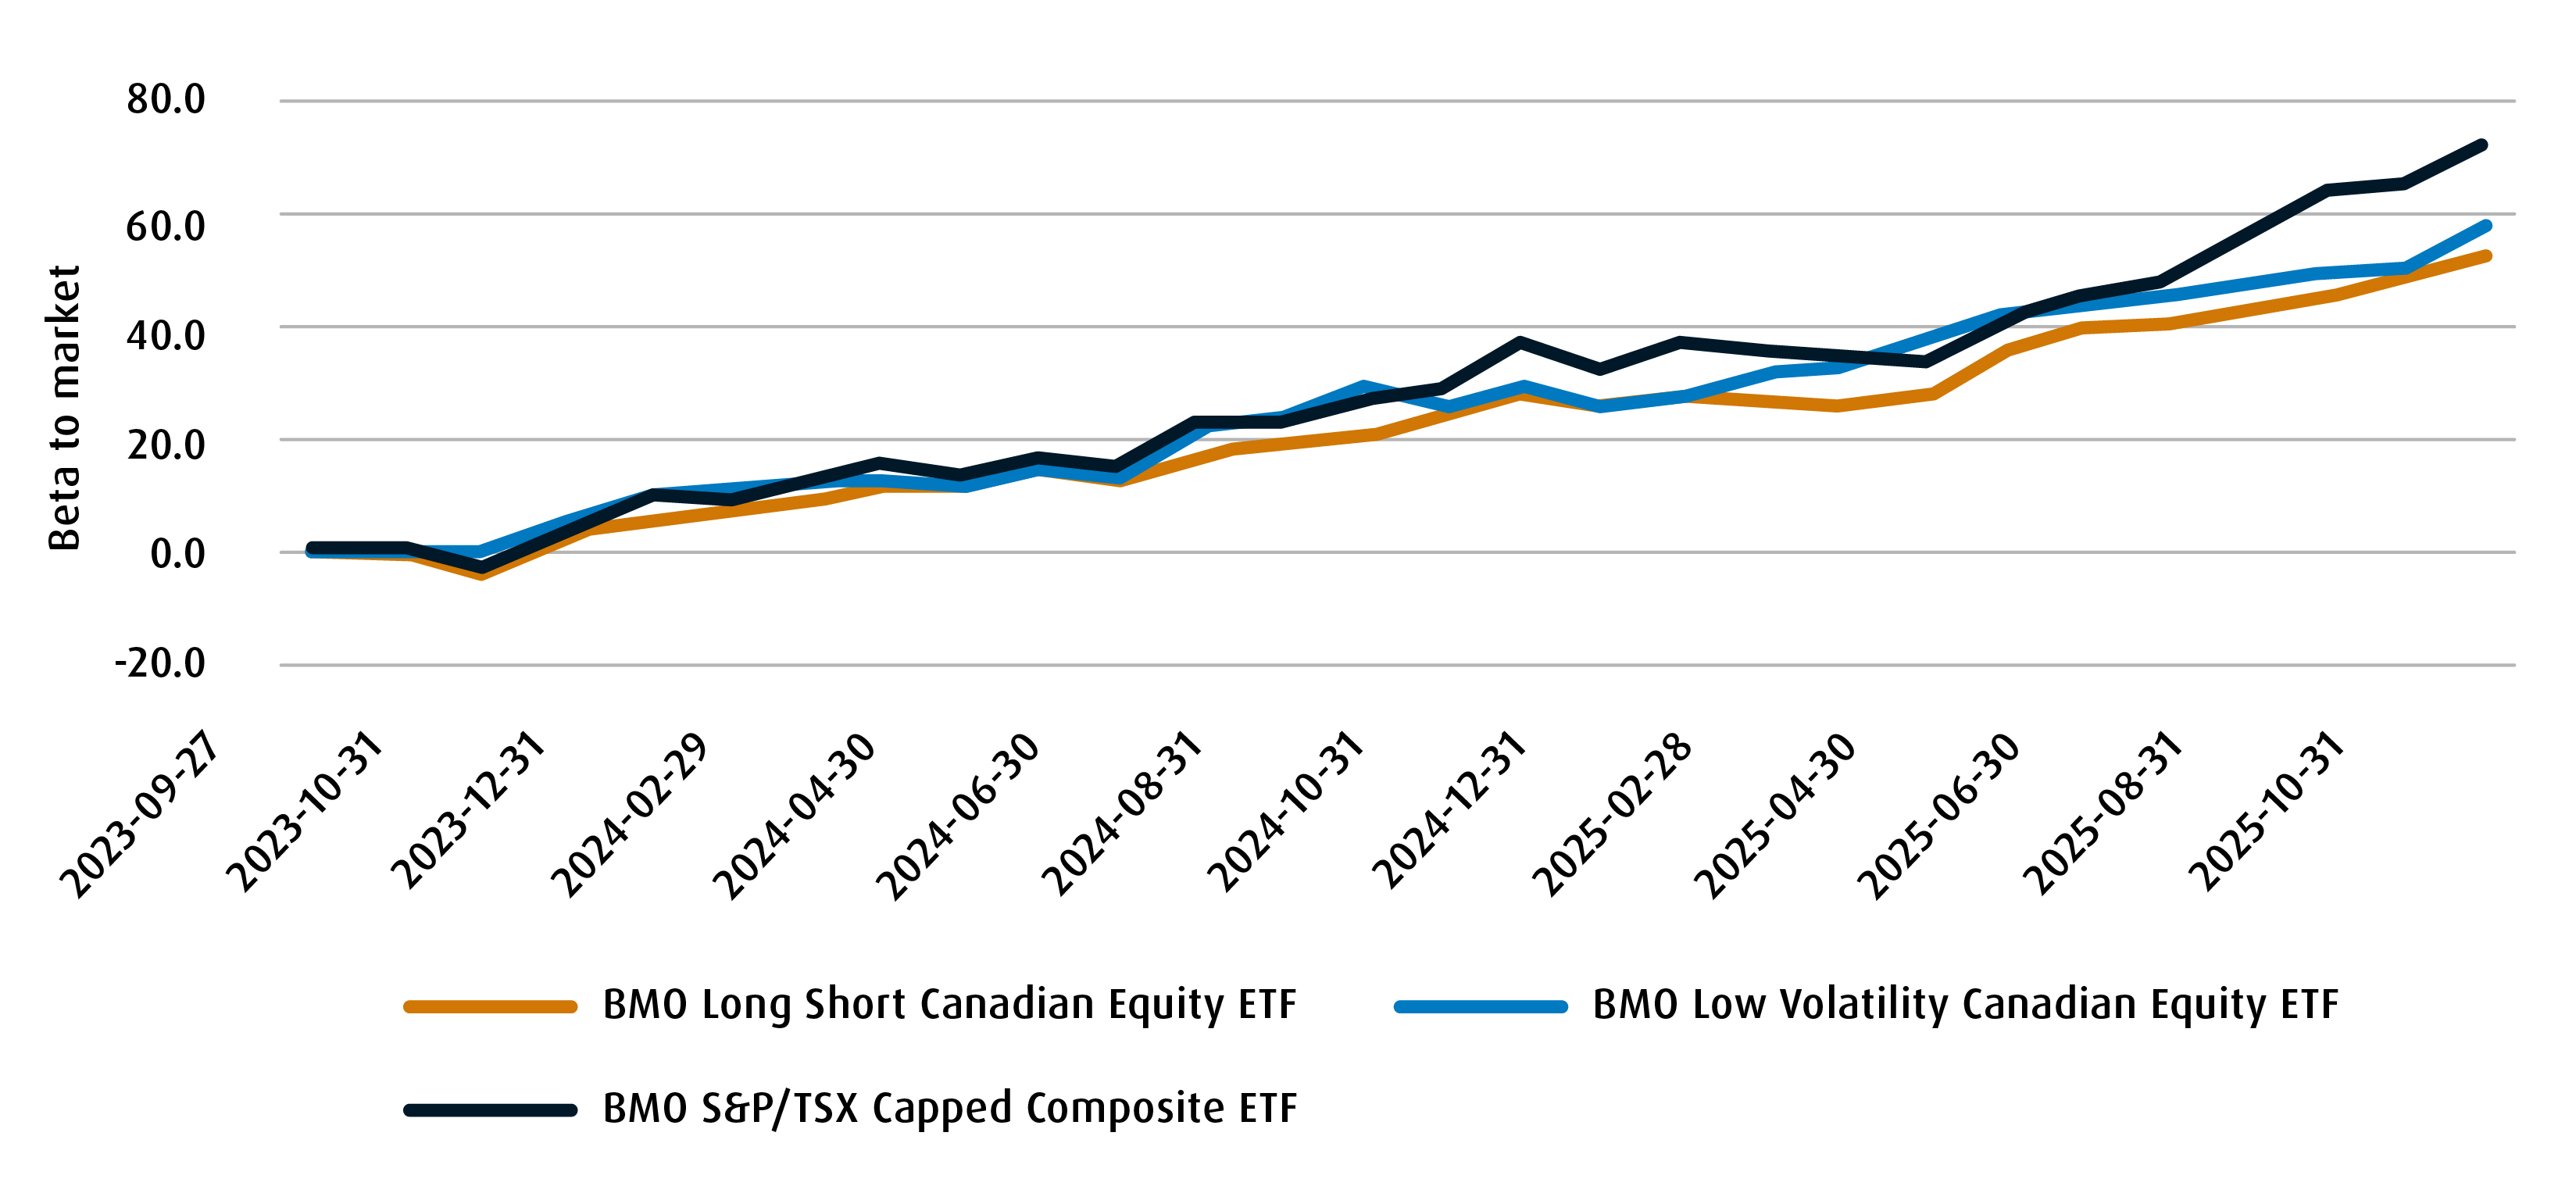
Alternative investments like Long-Short strategies can also be used to temper portfolio risk. As discussed in a previous article,2 short positions have displayed excellent diversification benefits in the past, lowering correlations more effectively than can be achieved by increasing fixed income exposure.
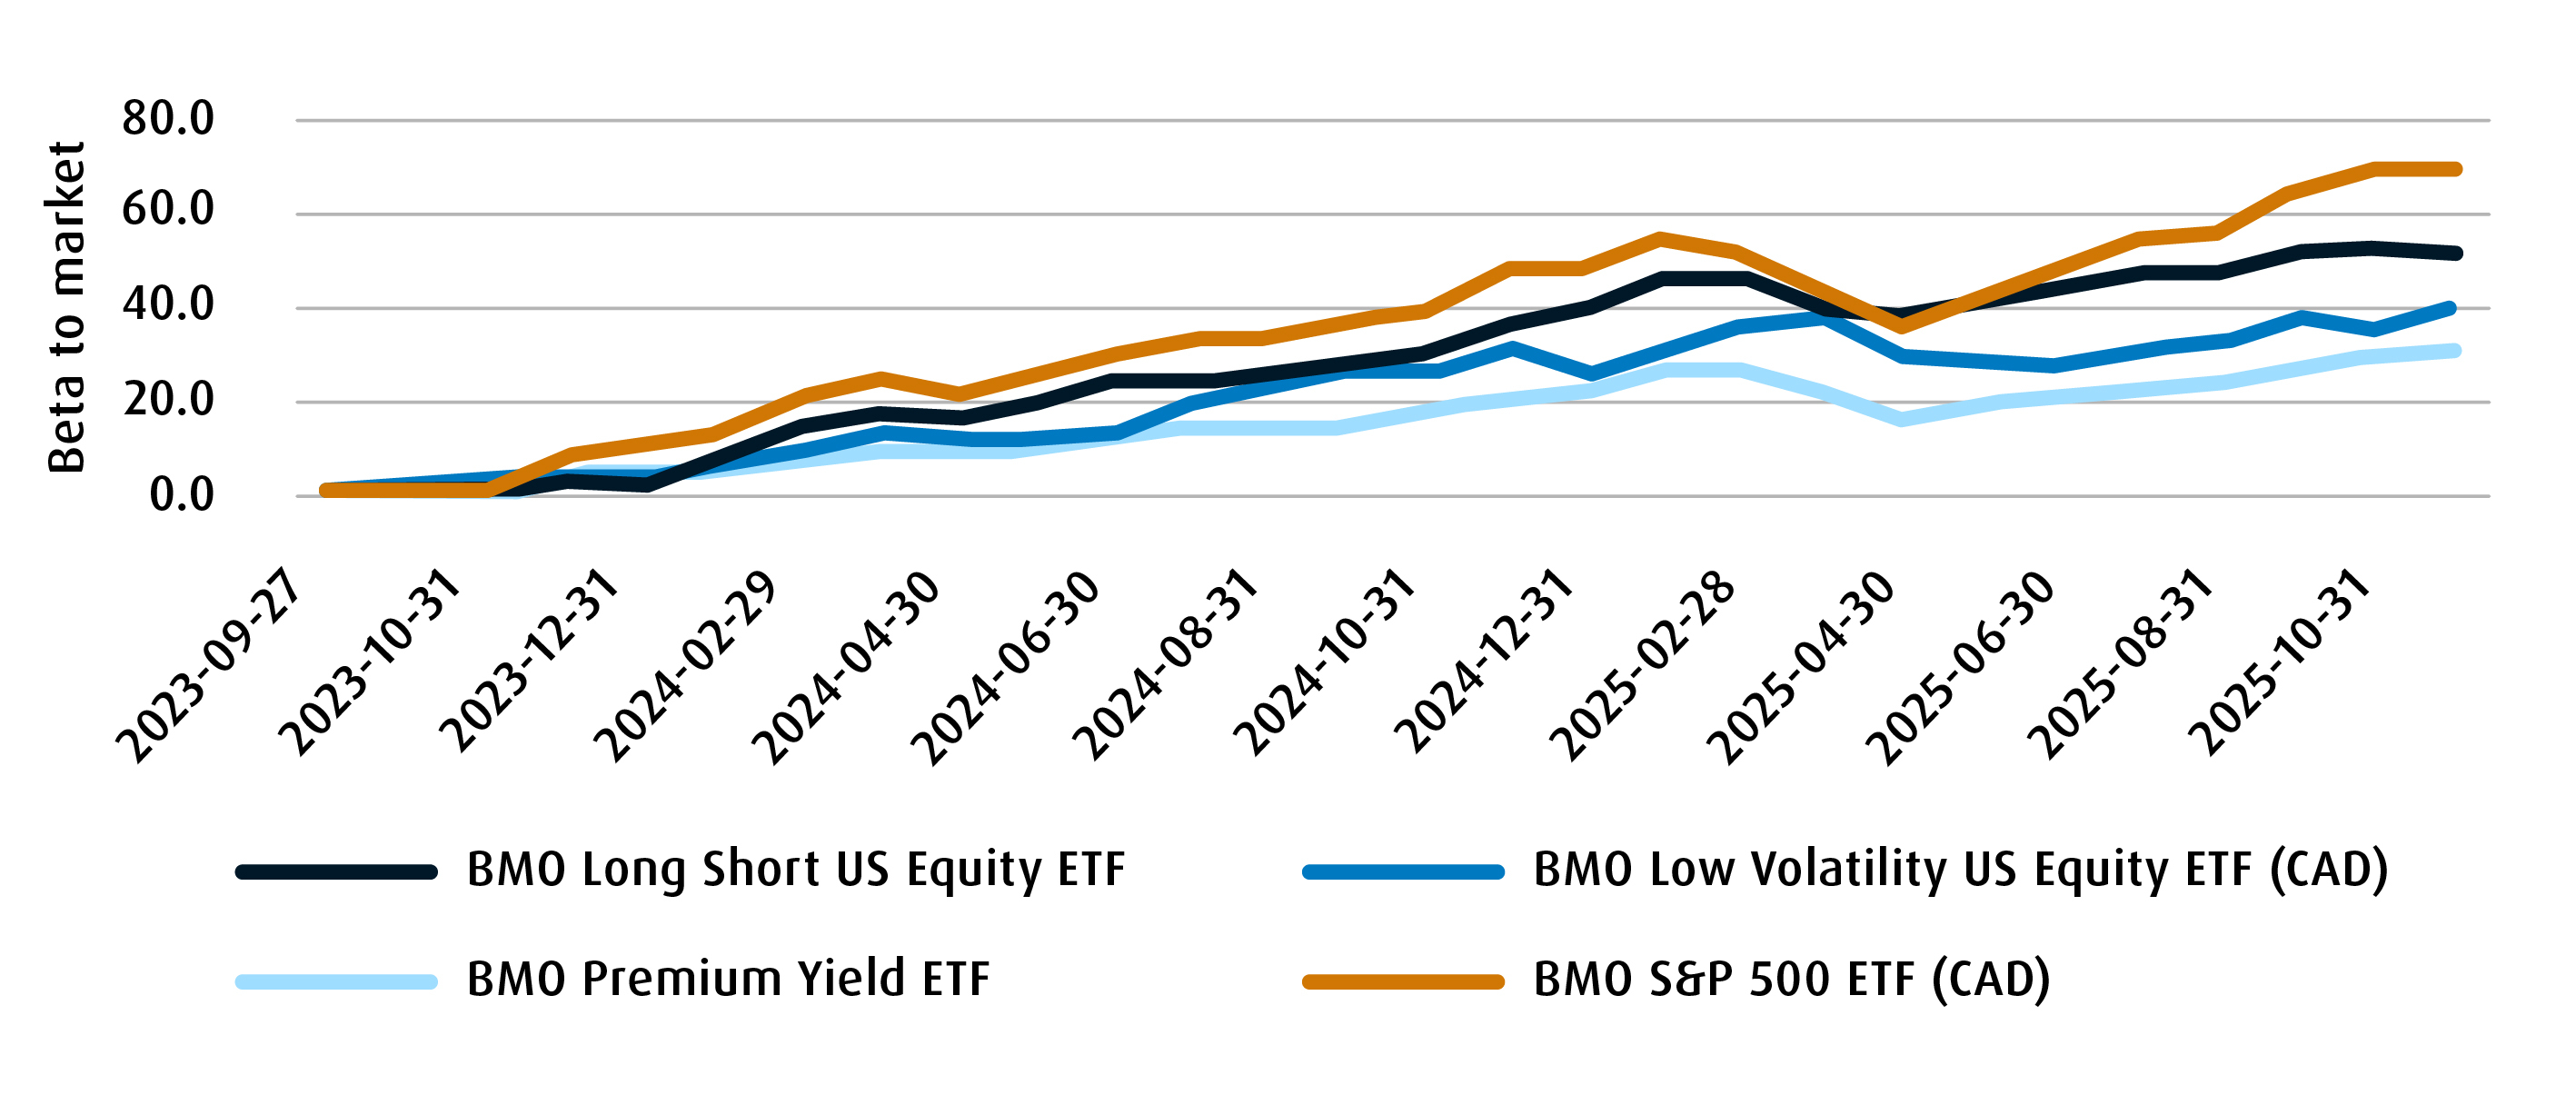
As seen in the beta graphic above, the strategy lowers beta markedly yet still provides equity exposure to participate in rising markets.
The BMO Premium Yield ETF (ticker: ZPAY) sells out-of-the-money puts to earn valuable premium, benefitting from a positive put-call skew. For a given ‘out-of-the-moneyness,’ investors earn more by selling puts than by selling calls.
If assigned, the portfolio will keep the stock, selling an out-of-the-money call to earn more premium. In essence, the methodology creates a buy-low / sell-high discipline, enhancing income with tax effective option premium.
The strategy also harnesses volatility to be a tax effective return source. Options are priced according to changes in implied volatility. That means premium income rises and falls in direct relation to volatility shifts. Investors in option overlay strategies benefits because their anxiety at rising volatility may be assuaged by the commensurate rise in tax effective option premium.
Three risk-aware approaches
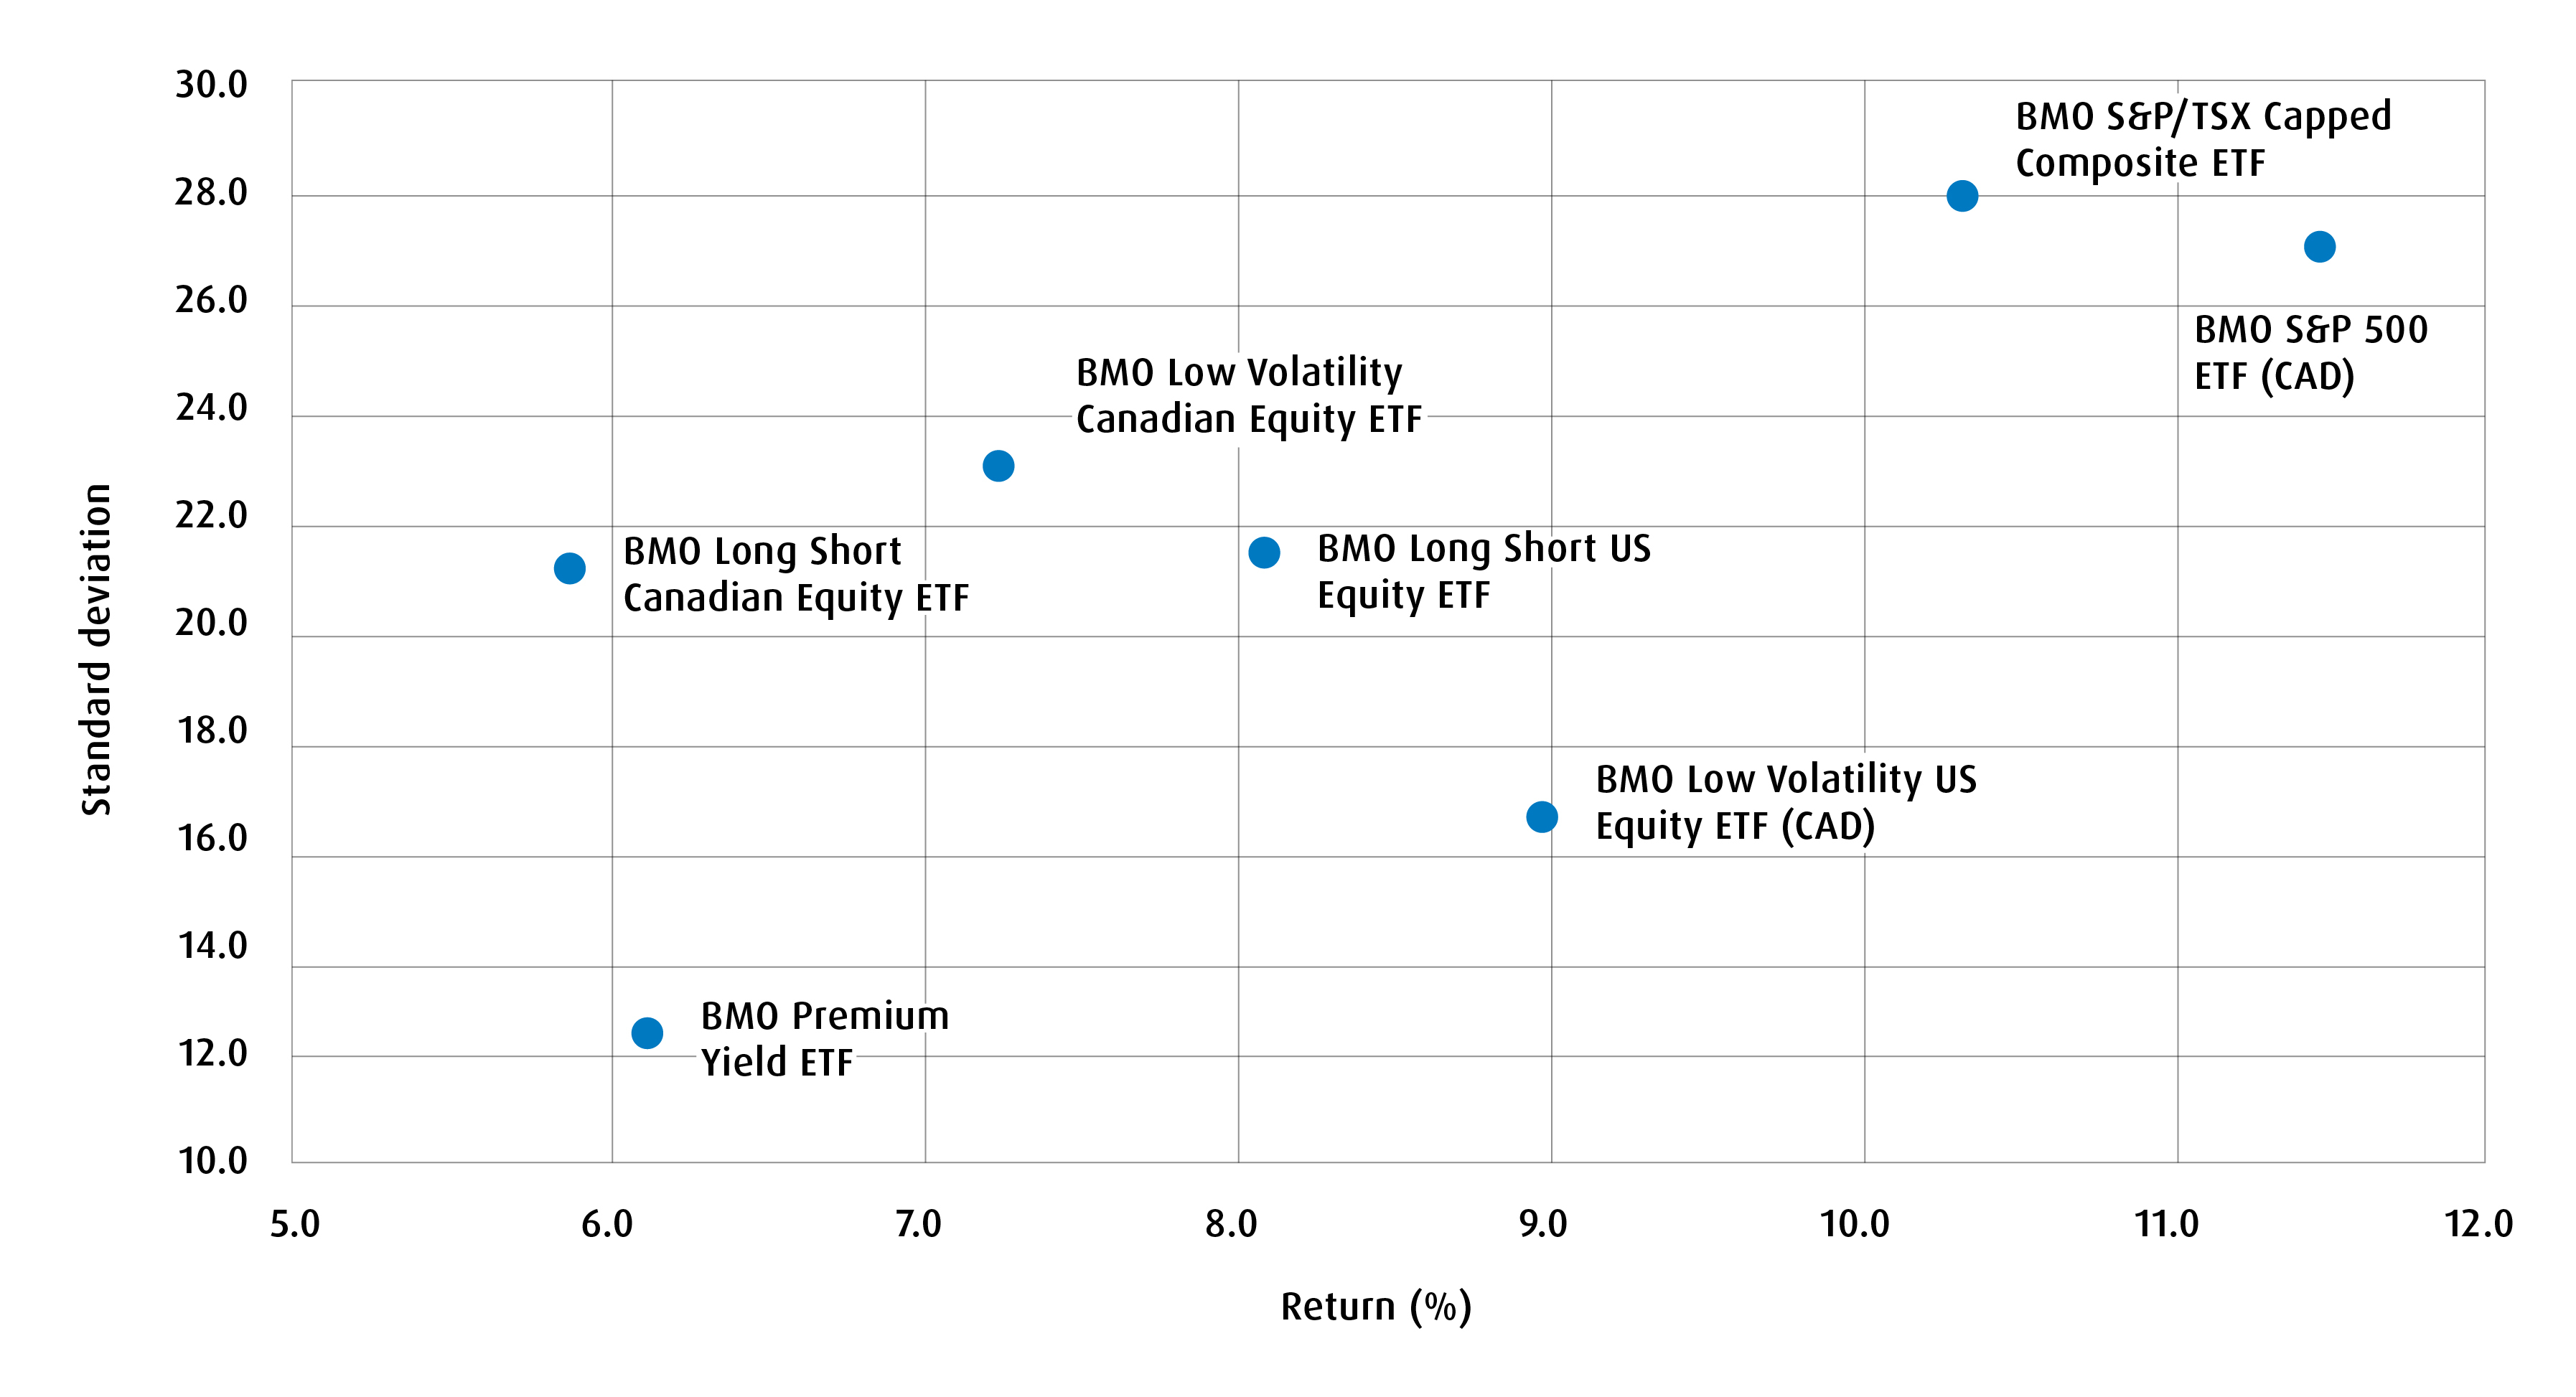
The data below compares and contrasts the strategies. The three approaches — long-short, low-beta and options-based premium yield — are each quite different, but each provides the opportunity to maintain equity exposure for a lower risk profile.
Two-year performance data |
Return (%) |
Standard deviation (%) |
Maximum drawdown (%) |
Sharpe ratio |
Up capture ratio (%) |
Down capture ratio (%) |
21.51 |
5.79 |
-1.93 |
2.74 |
70.62 |
27.60 |
|
21.42 |
8.42 |
-6.85 |
1.92 |
72.98 |
40.56 |
|
11.65 |
6.31 |
-8.30 |
1.18 |
48.74 |
52.99 |
|
22.47 |
6.87 |
-2.68 |
2.42 |
64.48 |
-32.27 |
|
15.40 |
9.29 |
-7.04 |
1.18 |
41.35 |
-19.50 |
|
25.56 |
11.35 |
-12.31 |
1.74 |
99.97 |
102.54 |
|
28.06 |
9.26 |
-3.26 |
2.31 |
99.68 |
99.93 |
Source: BMO Global Asset management, as of December 15, 2025.
Canadian equity beta management
U.S. equity beta management
Used together — or selectively — they allow allocators to tailor portfolios to a client’s risk tolerance. Risk management or mitigation, in our view, is one of the best services councillors and advisors provide to their clients.
Please contact your BMO institutional sales partner for additional market insights.
Performance (%)
Ticker |
Year-to-date |
1-month |
3-month |
6-month |
1-year |
3-year |
5-year |
10-year |
Since inception |
Inception date |
12.29% |
-1.72% |
1.18% |
11.76% |
12.29% |
23.18% |
15.80% |
14.32% |
17.53% |
2012-11-14 |
|
31.55% |
1.30% |
6.22% |
19.46% |
31.55% |
21.32% |
16.01% |
12.62% |
9.61% |
2009-05-29 |
|
25.26% |
0.09% |
5.37% |
10.08% |
25.26% |
16.48% |
14.11% |
11.33% |
12.78% |
2011-10-21 |
|
6.63% |
-3.21% |
-2.02% |
5.82% |
6.63% |
7.79% |
10.28% |
9.23% |
13.20% |
2013-03-19 |
|
5.33% |
-1.15% |
1.14% |
7.16% |
5.33% |
12.72% |
8.09% |
— |
7.98% |
2020-01-15 |
|
20.64% |
0.53% |
4.99% |
9.21% |
20.64% |
— |
— |
— |
20.64% |
2023-09-27 |
Bloomberg, as of December 31, 2025.
Beta: A measure of the volatility, or systematic risk, of a security or a portfolio in comparison to the market as a whole.
Disclaimers
For Advisor and institutional use.
This article is for information purposes only. The information contained herein is not, and should not be construed as investment, tax or legal advice to any party. Particular investments and/or trading strategies should be evaluated relative to the individual’s investment objectives and professional advice should be obtained with respect to any circumstance.
The viewpoints expressed by the author represent their assessment of the markets at the time of publication. Those views are subject to change without notice at any time. The information provided herein does not constitute a solicitation of an offer to buy, or an offer to sell securities nor should the information be relied upon as investment advice. Past performance is no guarantee of future results. This communication is intended for informational purposes only.
Any statement that necessarily depends on future events may be a forward-looking statement. Forward-looking statements are not guarantees of performance. They involve risks, uncertainties and assumptions. Although such statements are based on assumptions that are believed to be reasonable, there can be no assurance that actual results will not differ materially from expectations. Investors are cautioned not to rely unduly on any forward-looking statements. In connection with any forward-looking statements, investors should carefully consider the areas of risk described in the most recent prospectus.
Commissions, management fees and expenses all may be associated with investments in exchange-traded funds. Please read the ETF Facts or prospectus of the BMO ETFs before investing. The indicated rates of return are the historical annual compounded total returns including changes in unit value and reinvestment of all dividends or distributions and do not take into account sales, redemption, distribution or optional charges or income taxes payable by any unitholder that would have reduced returns. Exchange-traded funds are not guaranteed, their values change frequently and past performance may not be repeated.
Distribution yields are calculated by using the most recent regular distribution, or expected distribution, (which may be based on income, dividends, return of capital, and option premiums, as applicable) and excluding additional year end distributions, and special reinvested distributions annualized for frequency, divided by current net asset value (NAV). The yield calculation does not include reinvested distributions.
Distributions are not guaranteed, may fluctuate and are subject to change and/or elimination. Distribution rates may change without notice (up or down) depending on market conditions and NAV fluctuations.
The payment of distributions should not be confused with the BMO ETF’s performance, rate of return or yield. If distributions paid by a BMO ETF are greater than the performance of the investment fund, your original investment will shrink. Distributions paid as a result of capital gains realized by a BMO ETF, and income and dividends earned by a BMO ETF, are taxable in your hands in the year they are paid.
Your adjusted cost base will be reduced by the amount of any returns of capital. If your adjusted cost base goes below zero, you will have to pay capital gains tax on the amount below zero.
Cash distributions, if any, on units of a BMO ETF (other than accumulating units or units subject to a distribution reinvestment plan) are expected to be paid primarily out of dividends or distributions, and other income or gains, received by the BMO ETF less the expenses of the BMO ETF, but may also consist of non-taxable amounts including returns of capital, which may be paid in the manager’s sole discretion. To the extent that the expenses of a BMO ETF exceed the income generated by such BMO ETF in any given month, quarter, or year, as the case may be, it is not expected that a monthly, quarterly, or annual distribution will be paid. Distributions, if any, in respect of the accumulating units of BMO Short Corporate Bond Index ETF, BMO Short Federal Bond Index ETF, BMO Short Provincial Bond Index ETF, BMO Ultra Short-Term Bond ETF and BMO Ultra Short-Term US Bond ETF will be automatically reinvested in additional accumulating units of the applicable BMO ETF. Following each distribution, the number of accumulating units of the applicable BMO ETF will be immediately consolidated so that the number of outstanding accumulating units of the applicable BMO ETF will be the same as the number of outstanding accumulating units before the distribution. Non-resident unitholders may have the number of securities reduced due to withholding tax. Certain BMO ETFs have adopted a distribution reinvestment plan, which provides that a unitholder may elect to automatically reinvest all cash distributions paid on units held by that unitholder in additional units of the applicable BMO ETF in accordance with the terms of the distribution reinvestment plan. For further information, see the distribution policy in the BMO ETFs’ prospectus.
For a summary of the risks of an investment in the BMO ETFs, please see the specific risks set out in the BMO ETF’s prospectus. BMO ETFs trade like stocks, fluctuate in market value and may trade at a discount to their net asset value, which may increase the risk of loss. Distributions are not guaranteed and are subject to change and/or elimination.
The Index is a product of S&P Dow Jones Indices LLC or its affiliates (“SPDJI”), and has been licensed for use by the Manager. S&P®, S&P 500®, US 500, The 500, iBoxx®, iTraxx® and CDX® are trademarks of S&P Global, Inc. or its affiliates (“S&P”) and Dow Jones® is a registered trademark of Dow Jones Trademark Holdings LLC (“Dow Jones”), and these trademarks have been licensed for use by SPDJI and sublicensed for certain purposes by the Manager. The ETF is not sponsored, endorsed, sold or promoted by SPDJI, Dow Jones, S&P, their respective affiliates, and none of such parties make any representation regarding the advisability of investing in such product(s) nor do they have any liability for any errors, omissions, or interruptions of the Index.
BMO ETFs are managed by BMO Asset Management Inc., an investment fund manager, a portfolio manager, and a separate legal entity from Bank of Montreal.
BMO Global Asset Management is a brand name under which BMO Asset Management Inc. and BMO Investments Inc. operate.
“BMO (M-bar roundel symbol)” is a registered trademark of Bank of Montreal, used under licence.