Striking a Better Balance in U.S. Equity Portfolios with ZEQL
Managing concentration risk without sacrificing long‑term growth potential has become a key portfolio construction priority.


Over the past several years, U.S. equities have delivered impressive returns — but those gains have come with a growing challenge for investors and Advisors alike: concentration risk. A small number of mega‑cap stocks and sectors now dominate the performance of the broad U.S. equity market, increasing its sensitivity to their market swings. Managing that risk without sacrificing long‑term growth potential has become a key portfolio construction priority.
One solution worth considering is the BMO MSCI USA Equal Weight Index ETF (ticker: ZEQL): a low‑cost way to rebalance U.S. equity exposure and broaden the sources of return.
“The essence of investment management is the management of risks,
not the management of returns.”
—Benjamin Graham
Why Concentration Risk Matters More Today
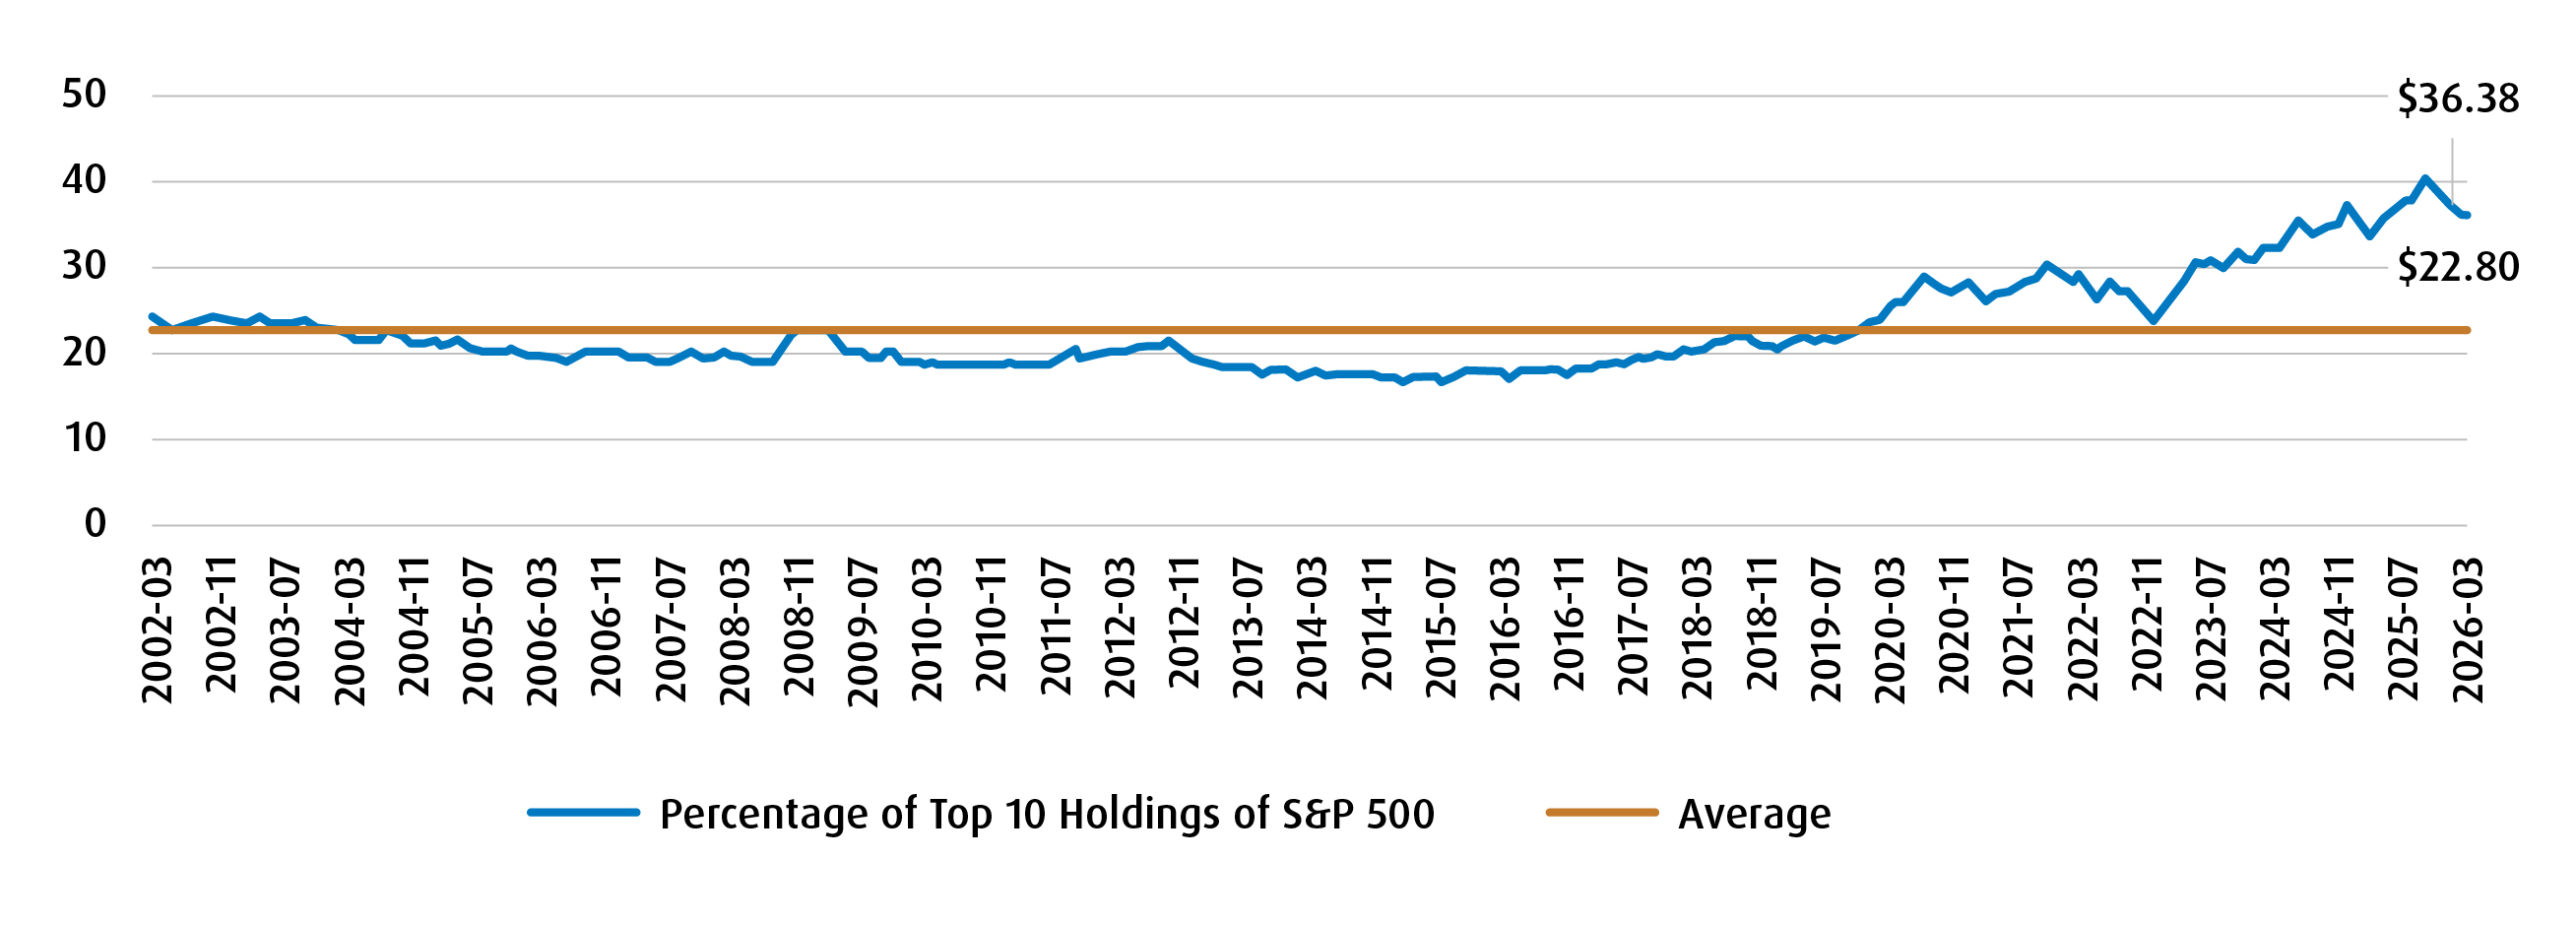
The S&P 500 remains the cornerstone of many Canadian portfolios, yet its structure has changed meaningfully over time. Today, the top 10 holdings represent roughly 36% of the index, well above the long‑term average of approximately 23%.1 At the sector level, Information Technology and Consumer Discretionary now account for an outsized share of total index risk and return.
This concentration has worked in investors’ favour during periods of strong performance by mega‑cap growth stocks — but it also increases vulnerability. When these stocks sell off, as we have seen on multiple occasions, portfolios can experience sharper drawdowns, even if the underlying fundamentals of these mega-cap growth stocks remain intact.
Recent years offer a clear example. While stocks like NVIDIA have delivered extraordinary gains driven by the AI theme, they have also experienced meaningful volatility and drawdowns. Moreover, a significant portion of NVIDIA’s revenue is tied directly to other mega‑cap technology companies, further compounding concentration risk within indexes.
Top 10 Holdings at Levels We Haven’t Seen Since the Turn of the Century
How Equal Weighting Changes the Exposure
Equal‑weight strategies take a different approach. Instead of allocating capital based on company size, each stock receives roughly the same weight. The result is a U.S. equity exposure that is less dependent on a handful of names and more evenly distributed across sectors and market capitalizations.
For ZEQL, this means a notable shift in portfolio composition:
- About 70% of ZEQL’s weight is in smaller-sized companies (mostly mid-cap), providing access to a wider range of U.S. businesses. This approach offers balanced exposure across the size spectrum, in turn helping capture potential growth opportunities beyond the largest names.
- Reduced dominance of mega‑cap stocks, helping mitigate stock and sector concentration risk.
- A broader opportunity set that allows more companies to meaningfully contribute to returns.
This broader exposure matters because leadership in equity markets tends to rotate over time. In 2025, for example, none of the top‑10 performing stocks in the MSCI USA Index came from the so‑called “Magnificent 7.”2 Many of the strongest returns were driven by smaller and mid‑sized companies, areas that are structurally under‑represented in traditional cap‑weighted portfolios.
ZEQL’s Size Exposure Versus the S&P 500
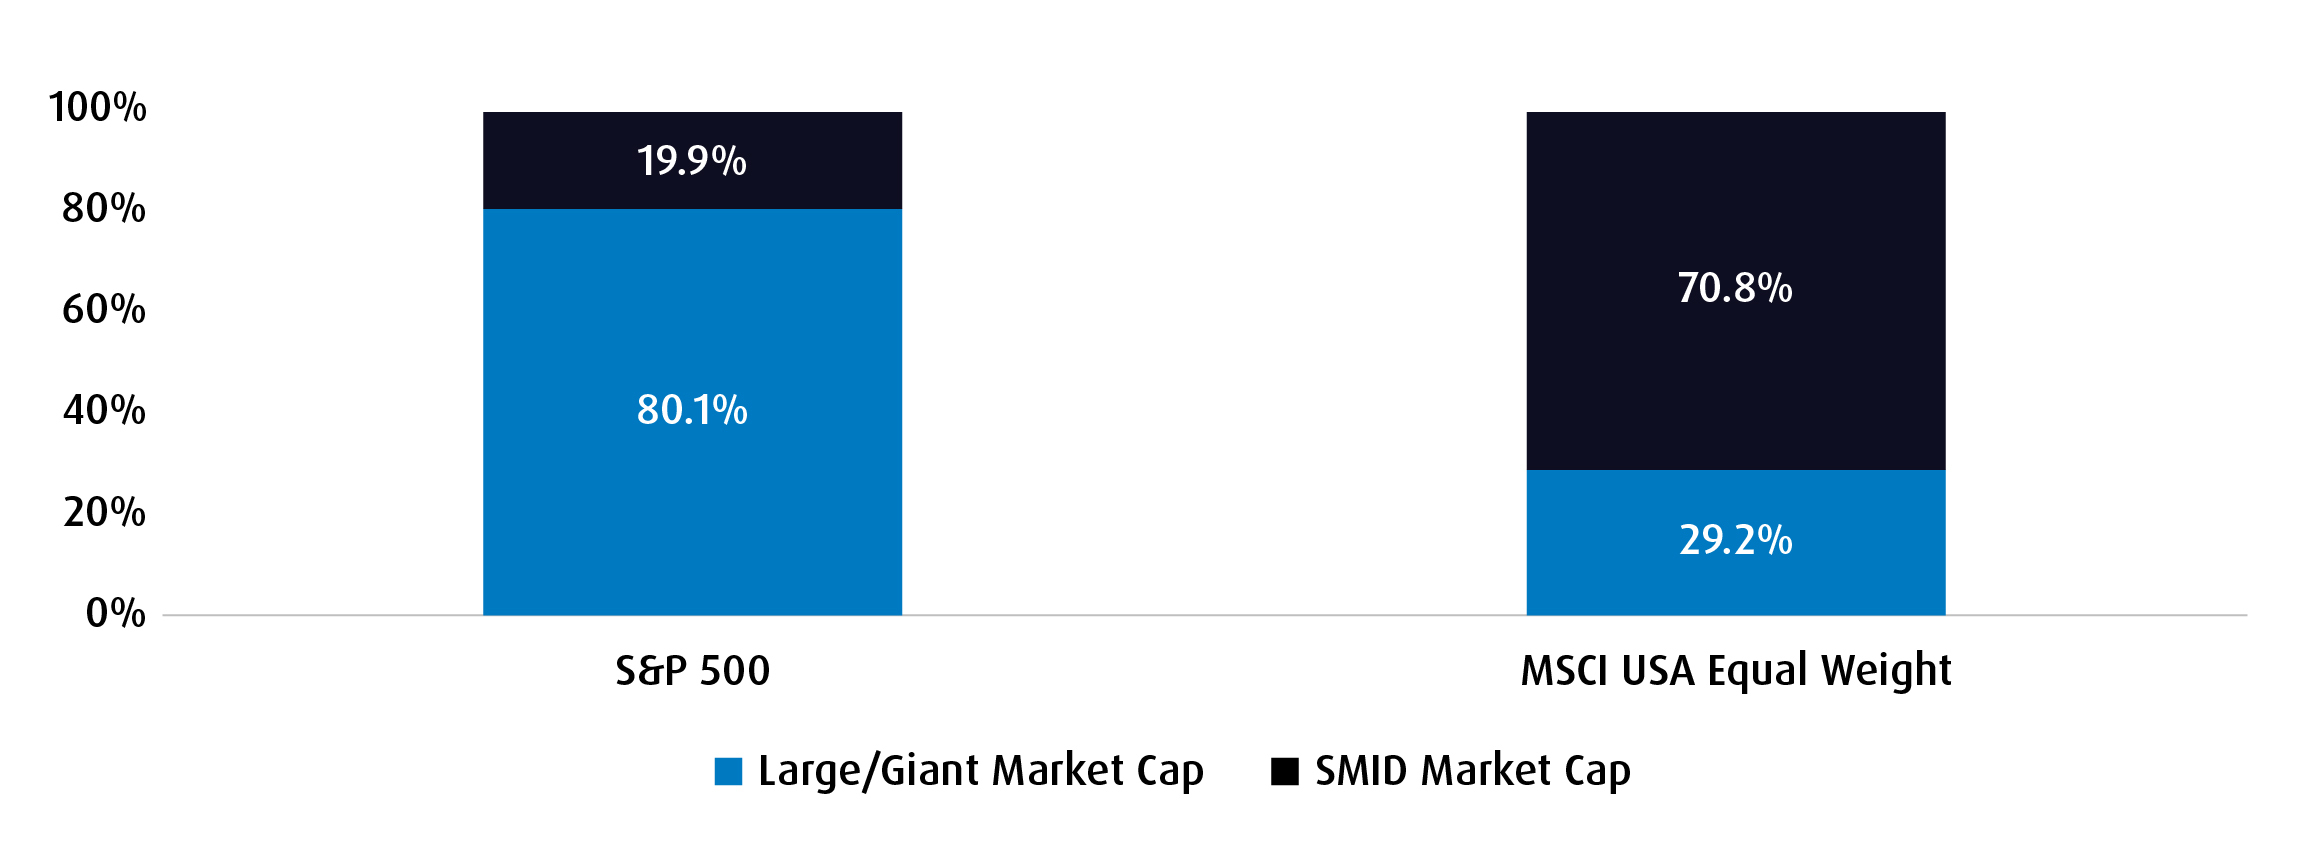
Note: Giant‑Cap: $200B+, Large‑Cap: $10B – $200B, Mid‑Cap: $2B – $10B, Small‑Cap: $300M – $2B. SMID = Small/Mid-Cap stocks.
Long‑Term Performance Across Market Cycles
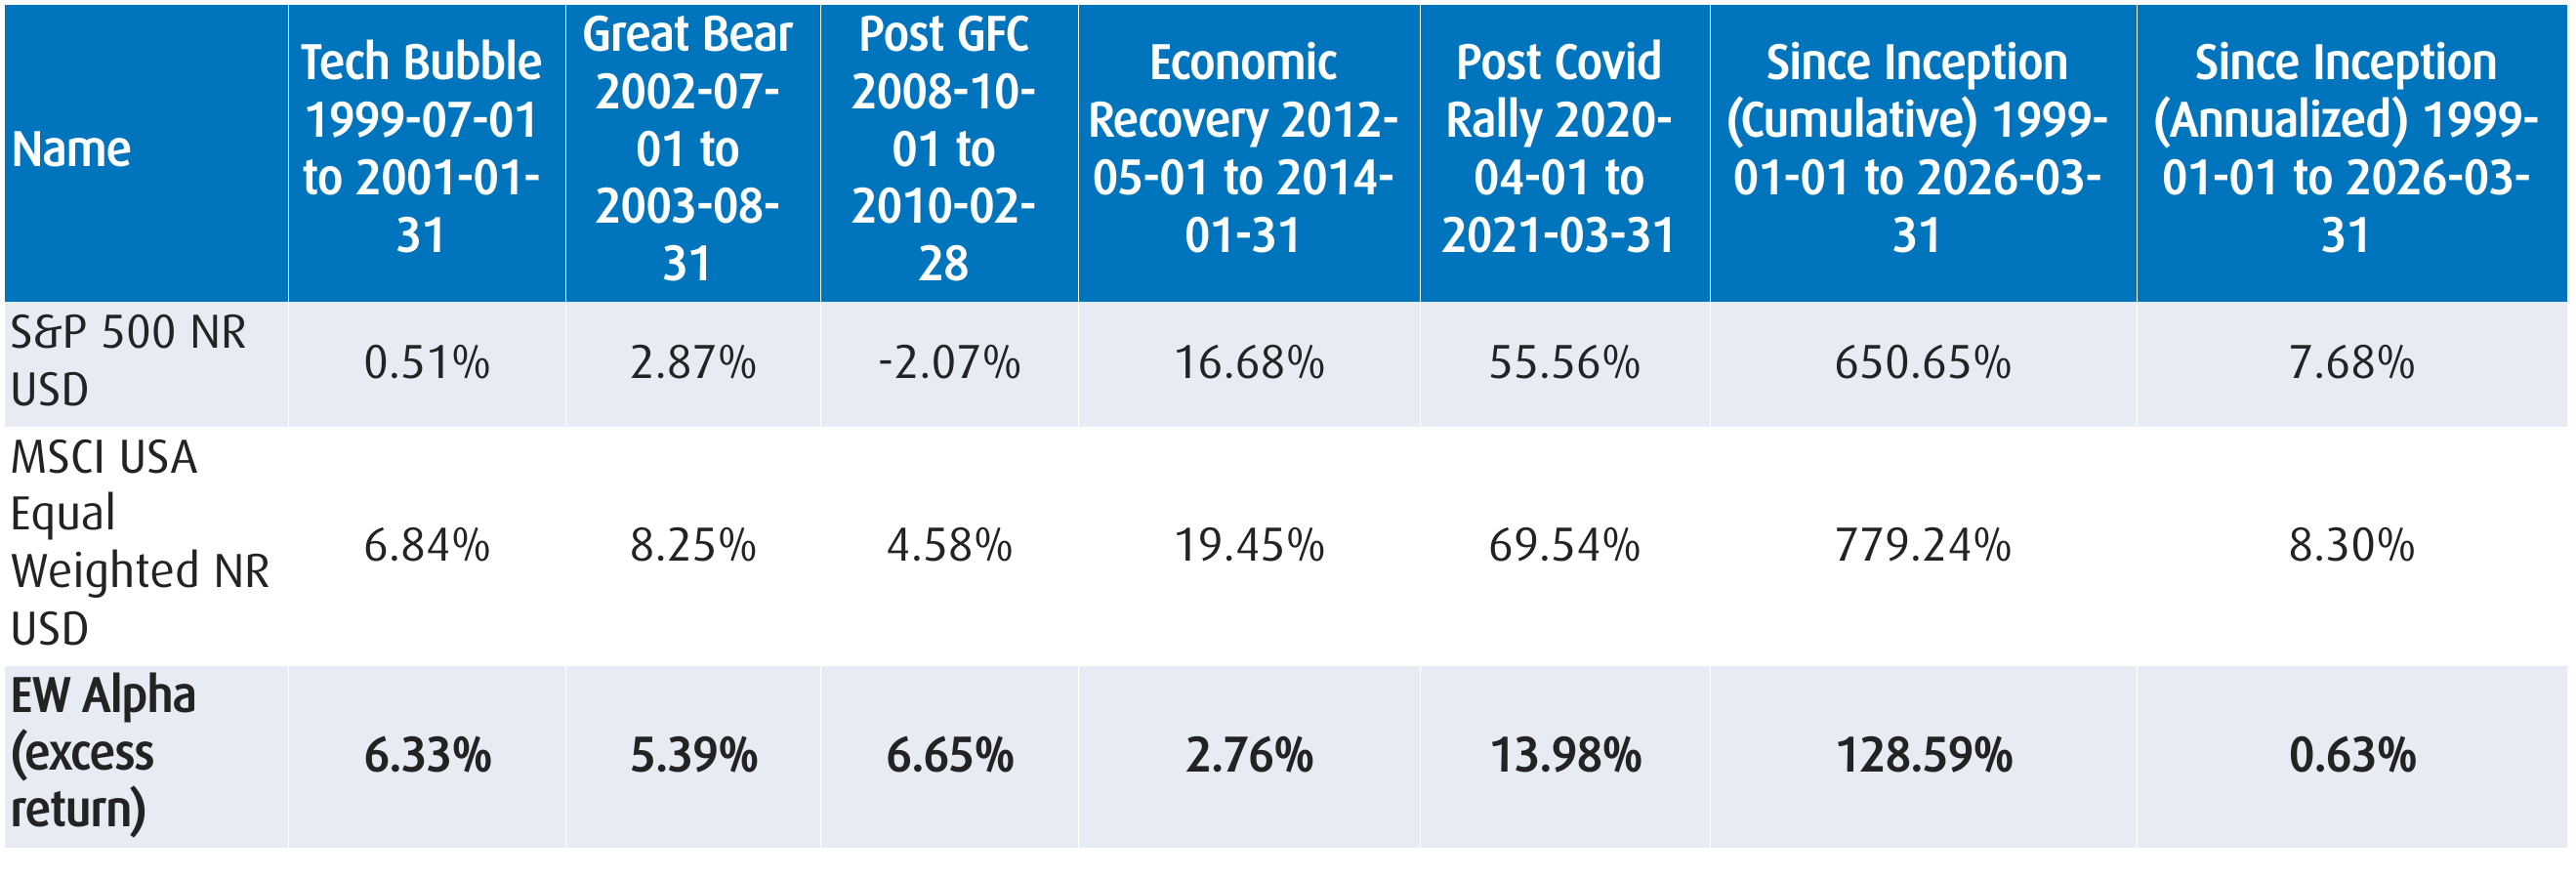
Historically, equal‑weight U.S. equity strategies have delivered attractive results across a range of economic environments. BMO’s MSCI USA Equal Weight strategy has shown:
- Strong relative performance during periods of market recovery
- Resilience following major market drawdowns
- A modest but persistent long‑term return advantage versus the S&P 500, driven by broader participation and rebalancing effects
Since 1999, the strategy’s annualized return has exceeded that of the S&P 500, while also benefiting from a more diversified return profile.
A Low‑Cost Foundation for Portfolio Building
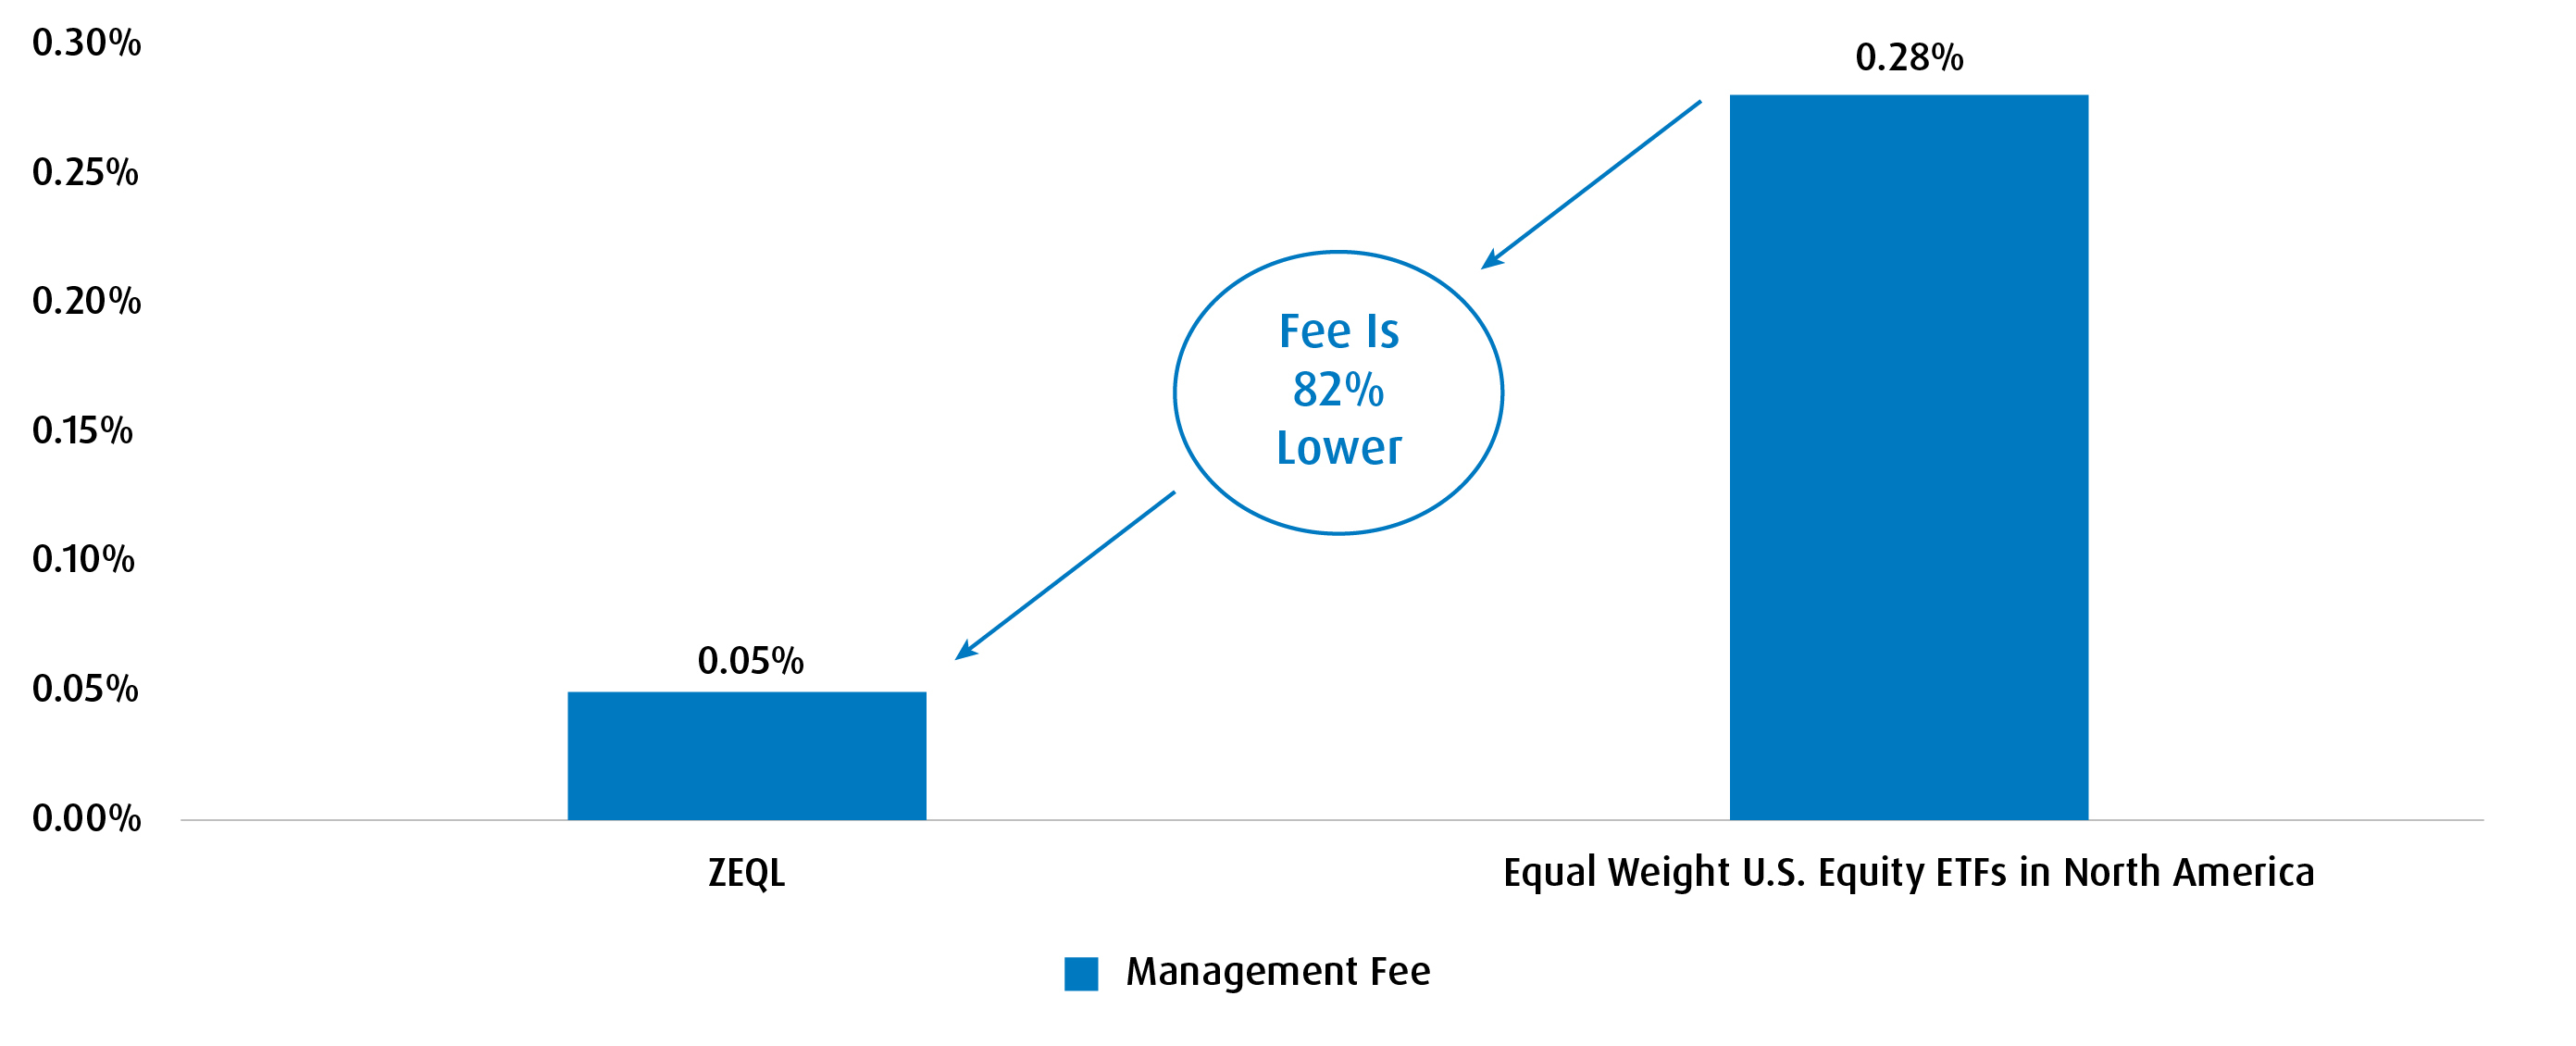
Cost matters — especially for core and structural allocations. ZEQL stands out as the lowest‑fee equal‑weight U.S. equity ETF in North America, with a management fee of just 0.05%, representing a meaningful cost advantage relative to peers.
ZEQL’s Management Fee Is Significantly Lower Than Peers
Practical Portfolio Applications
ZEQL is a flexible tool that can be implemented in several ways:
1. Pairing with Individual Stock Portfolios
For investors who manage individual U.S. stock portfolios, ZEQL can act as a diversification anchor. Blending ZEQL with a concentrated stock portfolio has historically improved risk‑adjusted returns, as the equal‑weight exposure offsets single‑name risk.
2. Core Holding with Sector Tilts
ZEQL can serve as a neutral starting point, with investors layering sector ETFs on top to express tactical views, without allowing any one sector to dominate the entire allocation.
3. Completion Sleeve for Large‑Cap Exposure
For portfolios already heavily allocated to broad U.S. market ETFs, ZEQL can complement existing holdings by meaningfully increasing exposure to mid‑ and smaller‑cap companies.
Putting Balance Back into U.S. Equity Exposure
Managing risk isn’t about avoiding growth; it’s about ensuring portfolios are not overly reliant on the fate of a small set of stocks. As concentration in U.S. equity markets remains elevated, equal‑weight strategies like ZEQL provide a compelling way to rebalance exposure, broaden participation, and maintain long‑term growth potential.
With diversified holdings, a structural tilt toward under‑represented parts of the market, and one of the lowest fees in the category, ZEQL offers investors a practical and cost‑effective way to strike the balance in U.S. equity portfolios.
1Morningstar Direct. Data is as of March 31, 2026.
2Magnificent 7: Apple, Microsoft, Alphabet, Amazon, NVIDIA, Meta Platforms, Tesla
Disclaimer:
This content is intended for information purposes. The views expressed herein are subject to change without notice. The content contained herein is not, and should not be construed as, investment advice to any party. Particular investments and/or trading strategies should be evaluated and professional advice should be obtained with respect to any circumstance.
The information provided herein does not constitute a solicitation of an offer to buy, or an offer to sell securities nor should the information be relied upon as investment advice. The views expressed herein regarding a particular company, security, industry, or market sector should not be considered as an indication of trading intent of any investment funds managed by BMO Global Asset Management. Any reference to a particular company is for illustrative purposes only and should not be considered as investment advice or a recommendation to buy or sell nor should it be considered as an indication of how the portfolio of any investment fund managed by BMO Global Asset Management is or will be invested.
You cannot invest directly in an index. Past performance is no guarantee of future results.
BMO MSCI USA Equal Weight Index ETF referred to herein is not sponsored, endorsed, or promoted by MSCI and MSCI bears no liability with respect to the ETF or any index on which such ETF is based. The ETF’s prospectus contains a more detailed description of the limited relationship MSCI has with the Manager and any related ETF.
Commissions, management fees and expenses all may be associated with investments in exchange-traded funds. The indicated rates of return are the historical annual compounded total returns including changes in unit value and reinvestment of all dividends or distributions and do not take into account sales, redemption, distribution or optional charges or income taxes payable by any unitholder that would have reduced returns. Please read the ETF Facts or prospectus of the BMO ETFs before investing. Exchange-traded funds are not guaranteed, their values change frequently and past performance may not be repeated.
For a summary of the risks of an investment in the BMO ETFs, please see the specific risks set out in the BMO ETF’s prospectus. BMO ETFs trade like stocks, fluctuate in market value and may trade at a discount to their net asset value, which may increase the risk of loss. Distributions are not guaranteed and are subject to change and/or elimination.
BMO ETFs are managed and administered by BMO Asset Management Inc., an investment fund manager and a portfolio manager, and a separate legal entity from Bank of Montreal.
BMO Global Asset Management is a brand name under which BMO Asset Management Inc. and BMO Investments Inc. operate.
“BMO (M-bar roundel symbol)” is a registered trademark of Bank of Montreal, used under licence.