Three Ways to Play Defence: Comparing BMO’s Low Volatility, Buffer and Dividend ETF Strategies
Defence isn’t one-size-fits-all. Low vol, buffer and dividend ETF strategies can reshape risk and return profiles, and help steady clients’ nerves when markets test conviction.


Periods of market stress tend to expose a key behavioural challenge for investors: staying invested when volatility rises. While “defensive equities” are often discussed as a single category, BMO’s ETF lineup offers several robust options, each designed to manage risk in a different way: low volatility (low vol), dividend‑focused, and buffer (structured outcome) equity ETFs.
Understanding how they work — and when each is most appropriate — is key to using them effectively.
Below, we review each strategy and how to deploy it, starting with low vol:
1. Low Volatility ETFs: Smoothing the Ride
BMO’s low volatility equity ETFs seek to reduce portfolio swings by investing in stocks that have historically been less sensitive to broad market movements. BMO uses a beta‑based selection process, ranking stocks by historical beta relative to the market and constructing portfolios with lower‑beta names, while imposing sector and individual security constraints to avoid excessive concentration. As a result of the screening methodology, these ETFs tend to be tilted towards more defensive sectors.
How They Behave in Volatile Markets
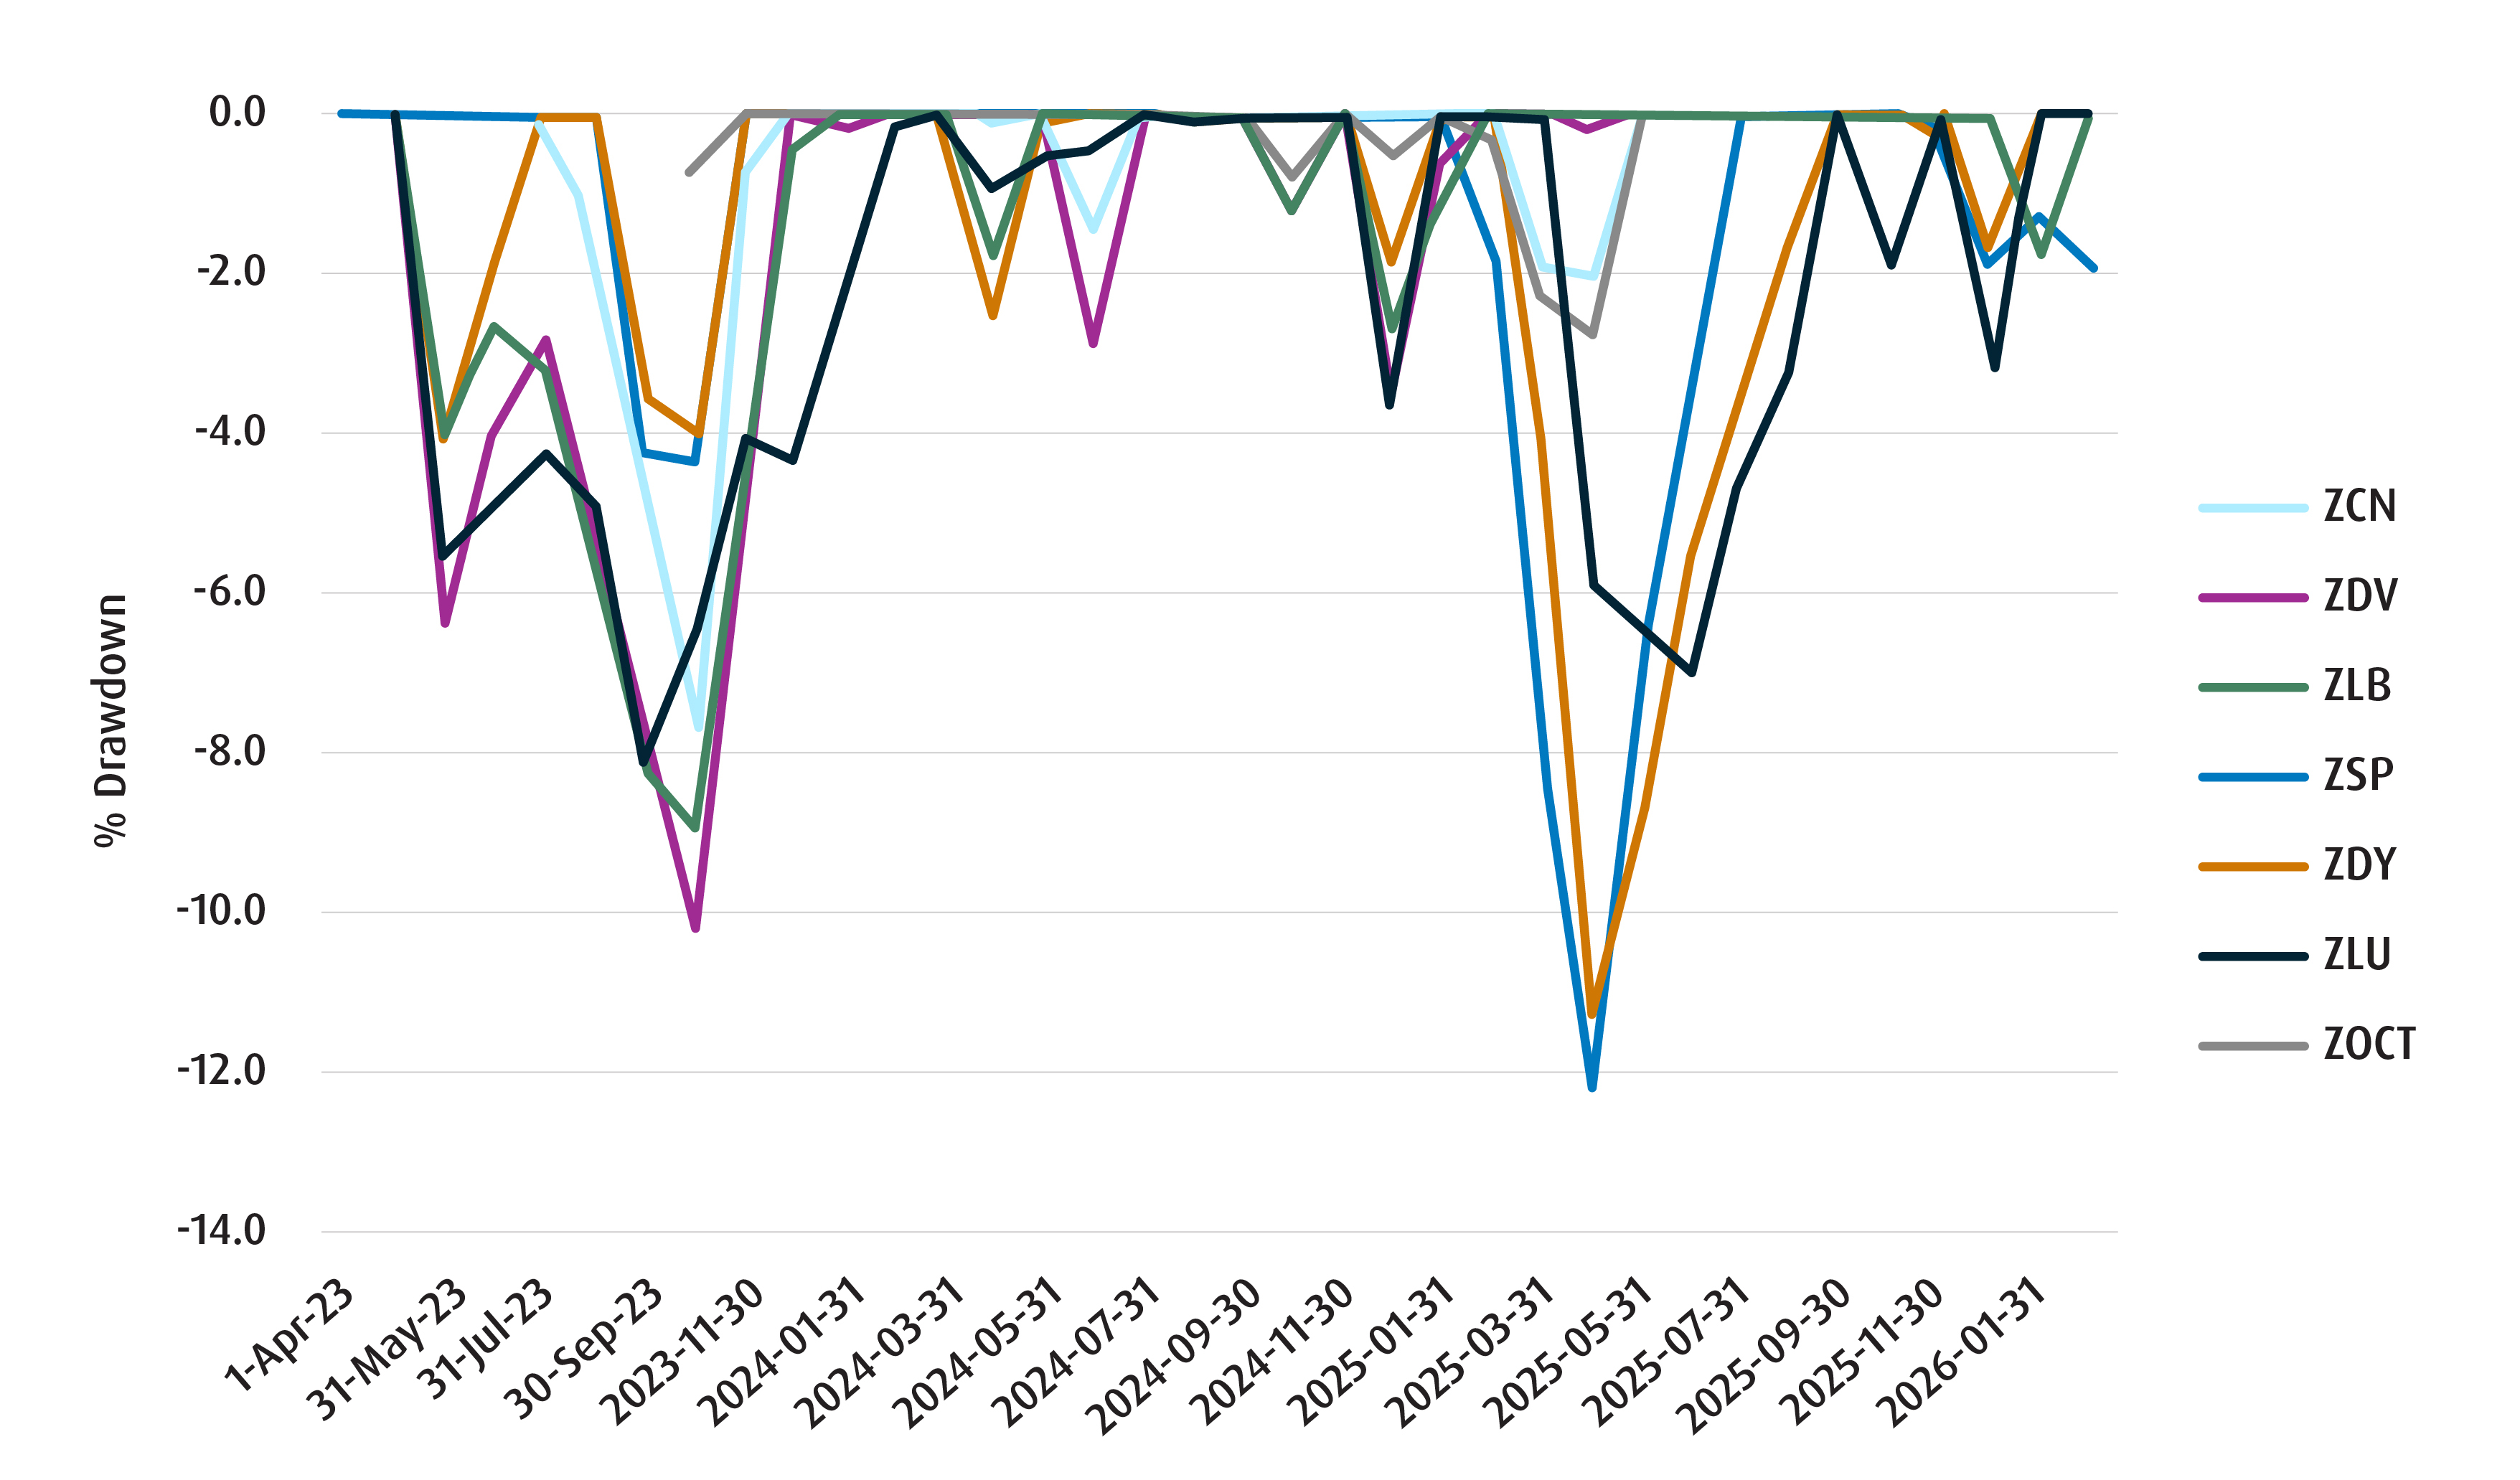
Low volatility strategies are designed to lose less in down markets, which can sometime means lagging in sharp rallies. Over multiple market corrections, BMO’s low volatility ETFs have historically shown lower downside capture than broad market benchmarks, helping investors stay invested during drawdowns. Importantly, this risk reduction is continuous — there is no defined protection level or reset date.
Best Suited For
- Investors seeking long‑term equity exposure with reduced volatility.
- Core allocations where staying invested through market cycles is the priority.
- Investors comfortable accepting modest underperformance in strong bull markets in exchange for smoother outcomes.
- Investors looking for simple, transparent screening and long-only equity exposure.
What to Know
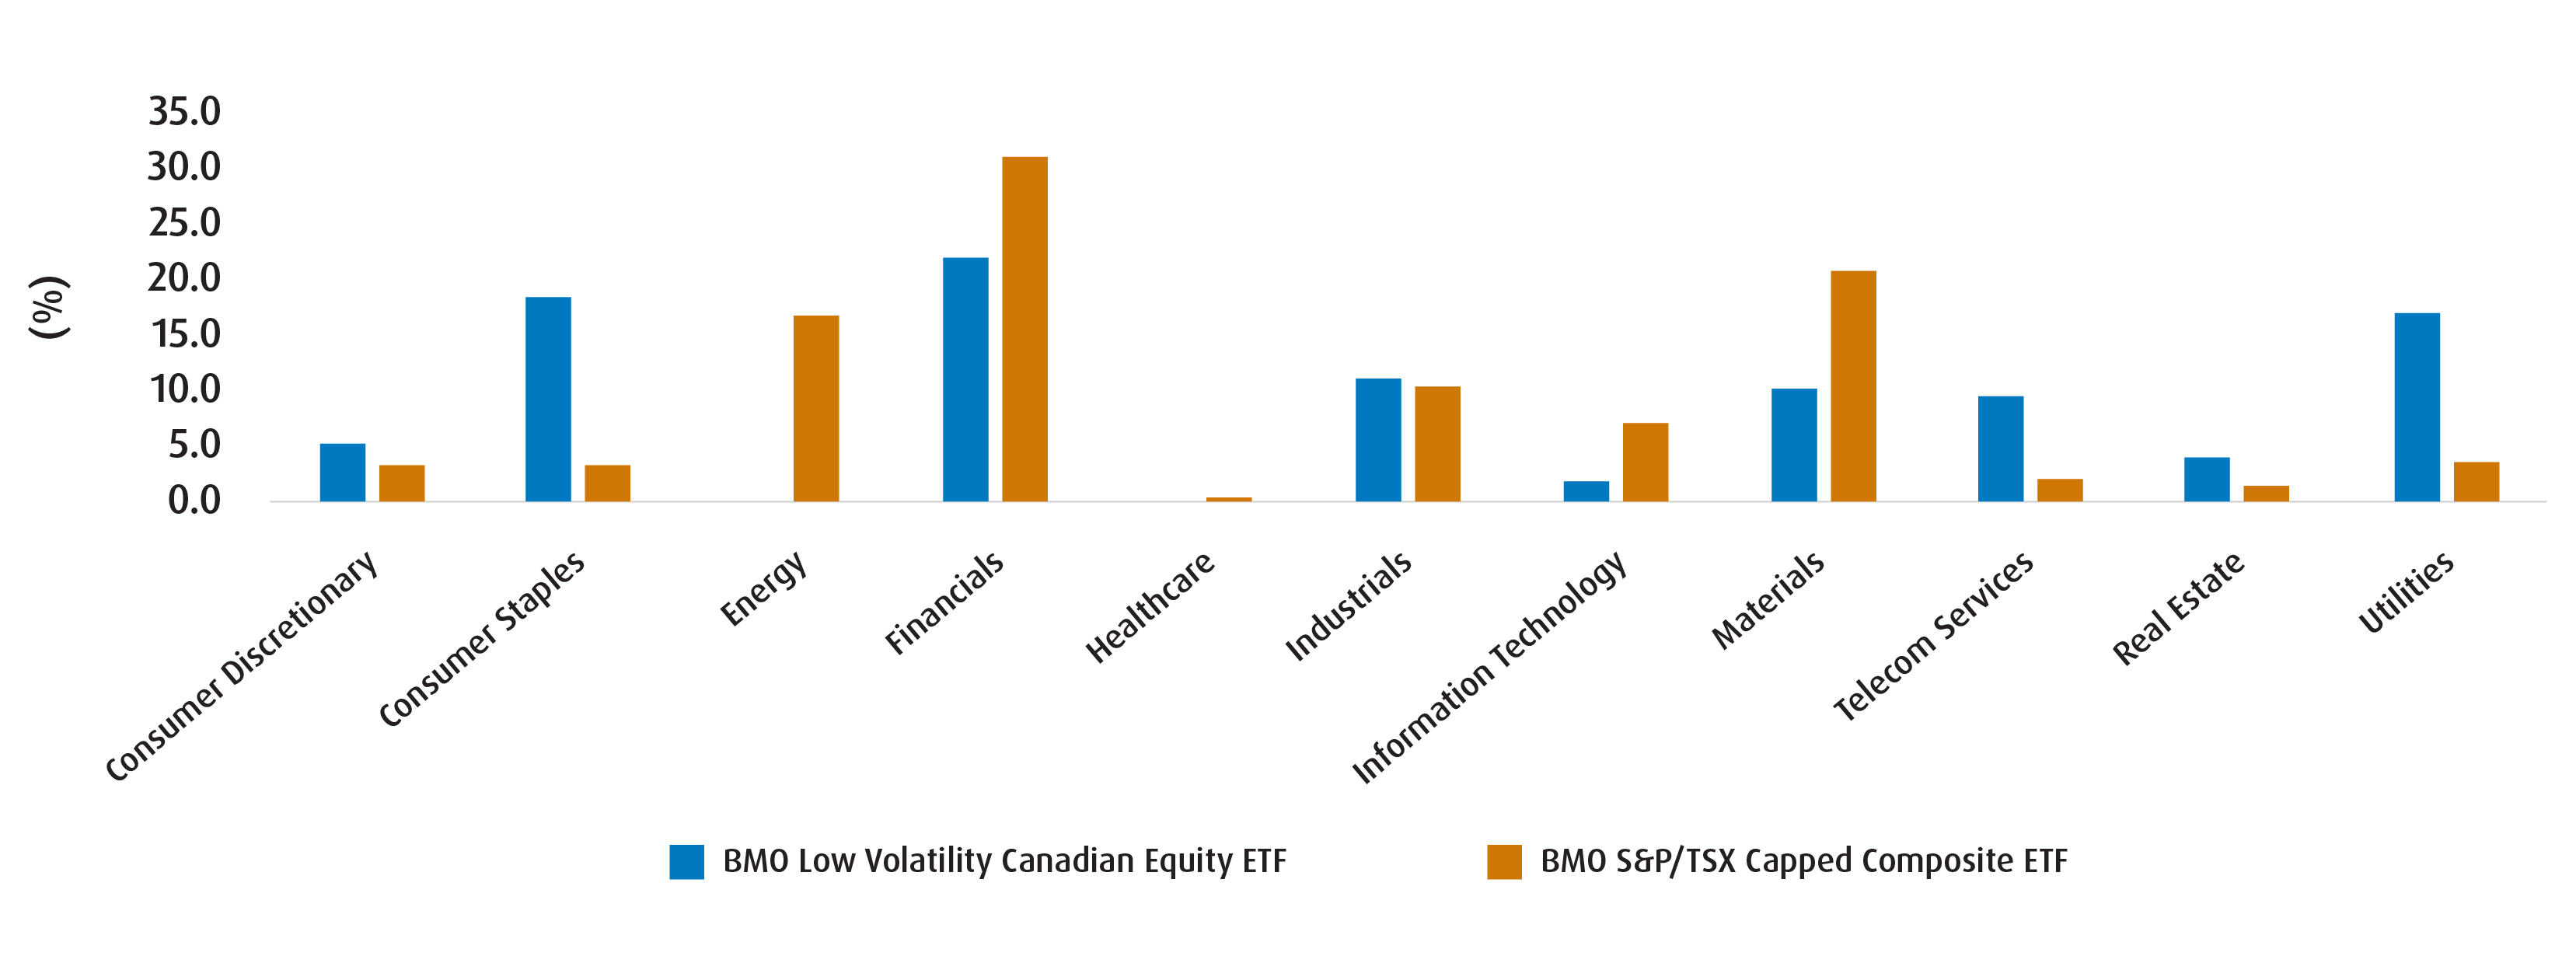
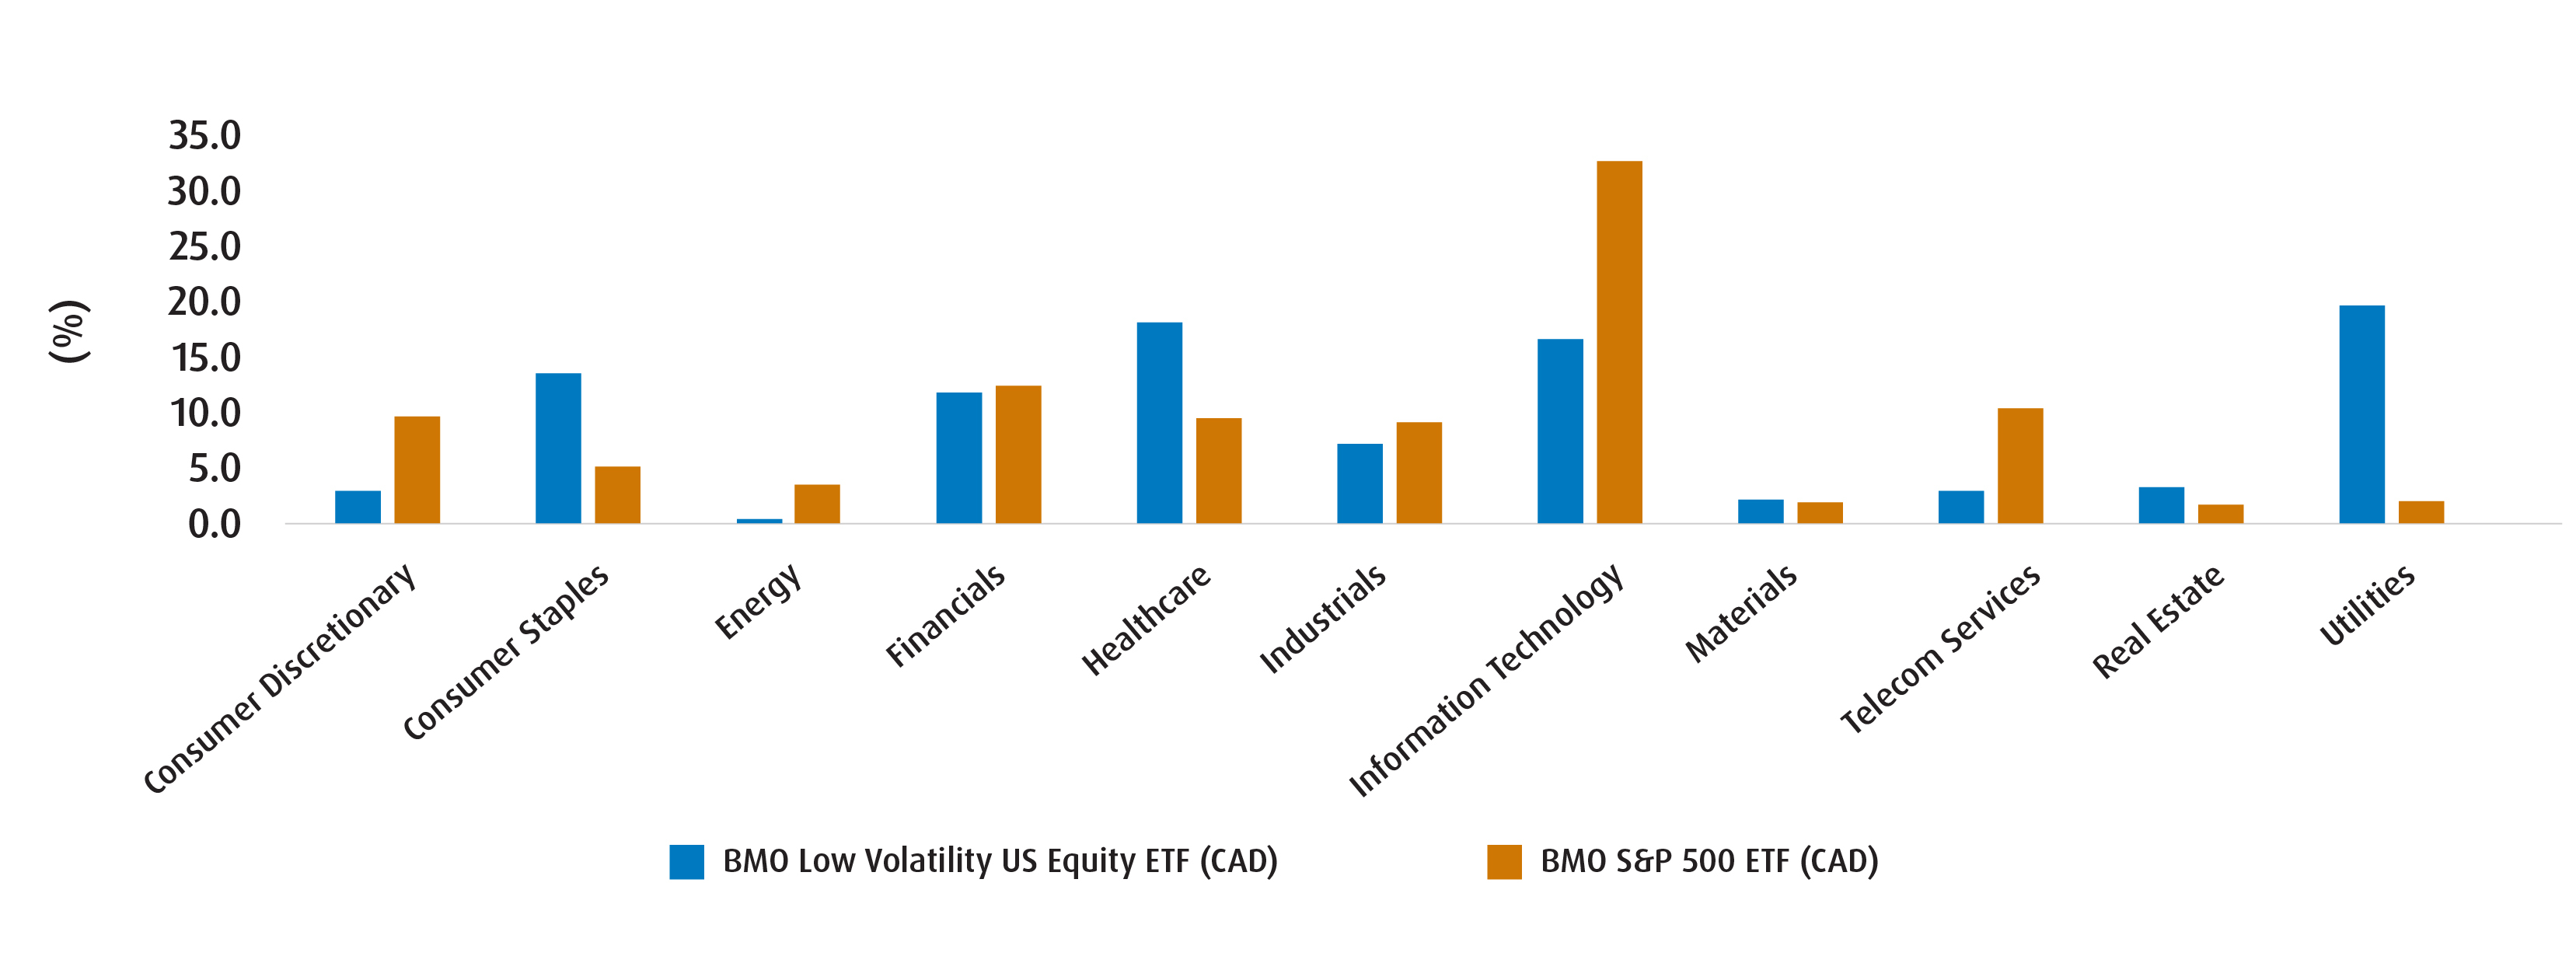
- The beta screening methodology does lead to a defensive sector tilt. Think: consumer staples, utilities, telecom, health care. Cyclical sectors such as Energy, Materials, and Information Technology tend to be less represented.
- For further information regarding the methodology: BMO ETF Low Volatility Strategy.
- For further information regarding the methodology: BMO ETF Low Volatility Strategy.
- BMO offers the largest low volatility suite in the Canadian marketplace, with eight dedicated ETFs spanning Canadian, U.S. to International and Emerging Market equities. Visit here and search “low vol” to see each.
Canadian Exposure
Lower Drawdown, Downside Capture Ratio, and Standard Deviation
5 Year Risk Measures (%)
ETF | Return | Standard Deviation | Up Capture Ratio | Down Capture Ratio | Max Drawdown |
12.83 | 9.30 | 66.95 | 47.72 | -9.01 | |
15.12 | 12.45 | 98.85 | 101.41 | -14.40 |
Source: Morningstar, April 1, 2021-March 31, 2026. Past performance is not indicative of future results.
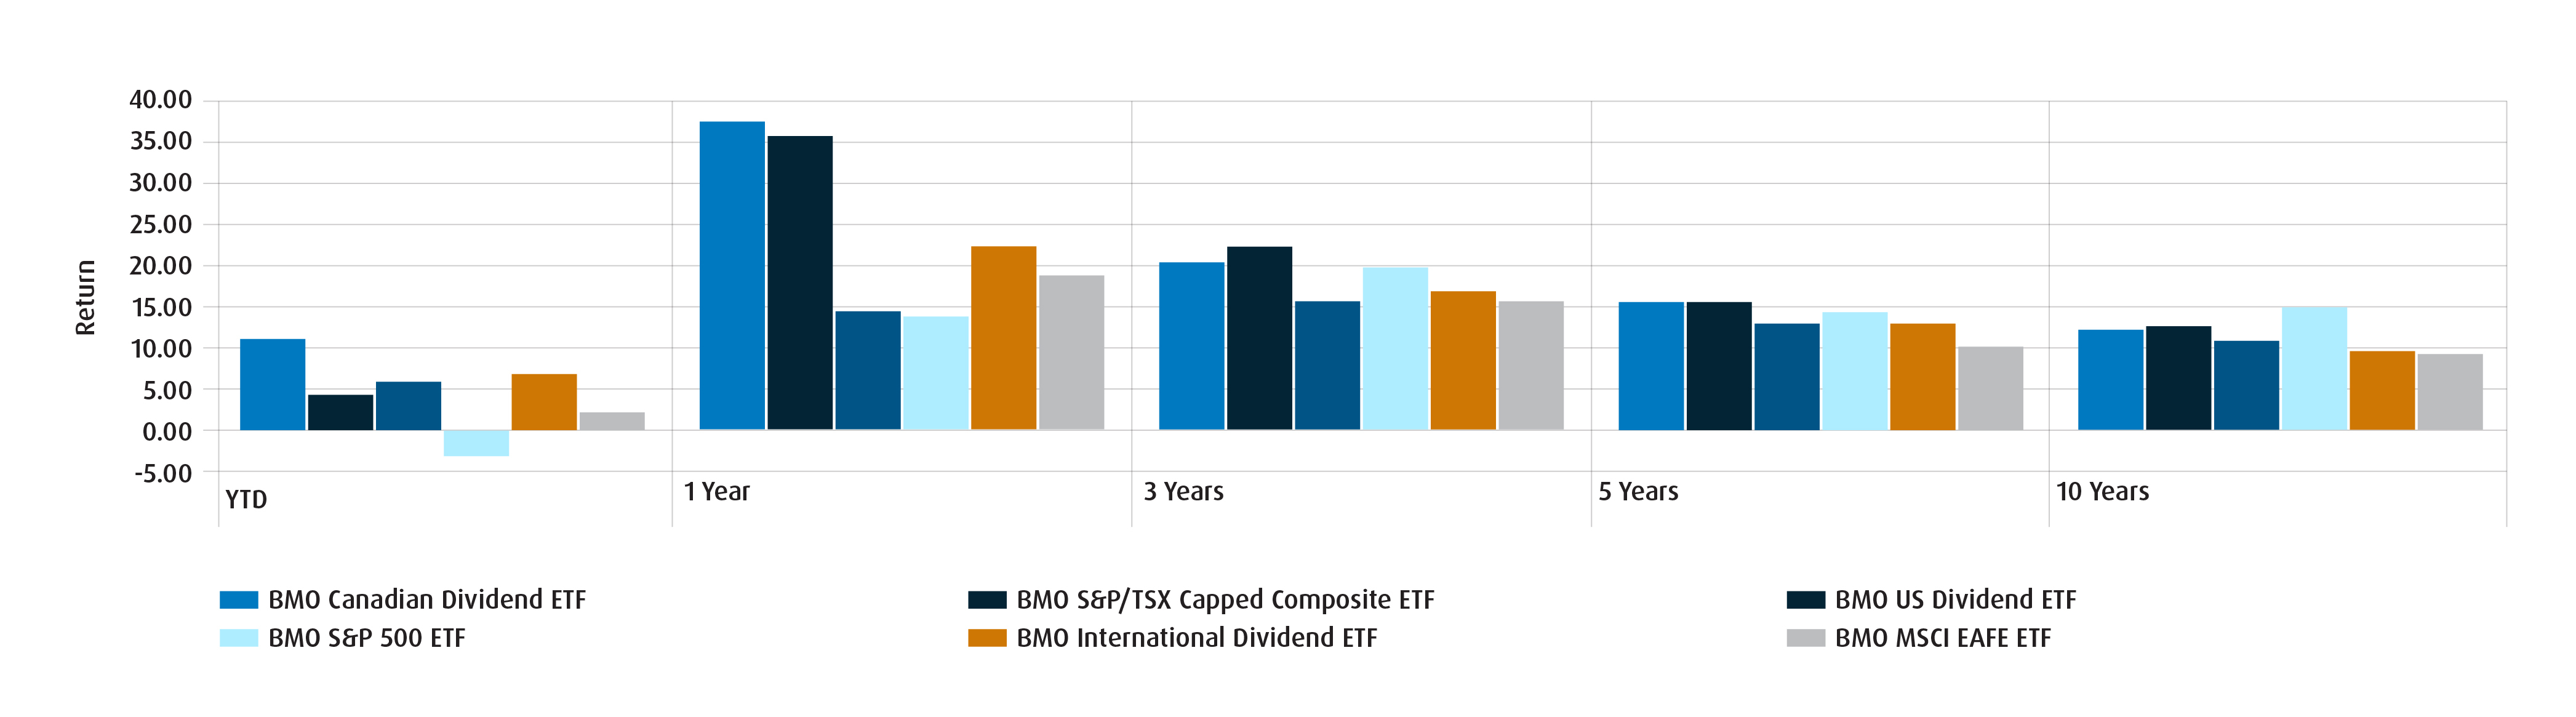
Calendar Year Returns (%): Past 10 Years
ETF | 2025 | 2024 | 2023 | 2022 | 2021 | 2020 | 2019 | 2018 | 2017 | 2016 |
25.26 | 15.34 | 9.39 | -0.37 | 22.88 | 1.62 | 21.83 | -2.78 | 11.09 | 13.04 | |
31.55 | 21.55 | 11.67 | -5.86 | 25.03 | 5.70 | 22.83 | -8.84 | 9.05 | 20.99 |
Source: Morningstar. As of March 31, 2026. Past performance is not indicative of future results.
Trailing Returns (%)
ETF | 1 M | 3 M | 6 M | YTD | 1 Y | 2 Y | 3 Y | 5 Y | 10 Y | Since | Inception Date |
-2.72 | 1.45 | 6.90 | 1.45 | 20.24 | 18.74 | 14.47 | 12.84 | 10.68 | 12.66 | 10/21/2011 | |
-4.30 | 3.94 | 10.40 | 3.94 | 34.73 | 24.89 | 21.09 | 15.12 | 12.56 | 9.72 | 5/29/2009 |
Source: Morningstar, as of March 31, 2026. Past performance is not indicative of future results.
Sector Differences Between ZLB & ZCN
U.S. Exposure
ZLU vs. ZSP: Lower Drawdown, Downside Capture Ratio and Standard Deviation
5-Year Risk Measures
ETF | Return | Standard Deviation | Up Capture Ratio | Down Capture Ratio | Max Drawdown |
11.10 | 10.21 | 58.96 | 37.38 | -8.59 | |
14.01 | 12.92 | 99.44 | 94.91 | -18.66 |
Source: Morningstar, April 1, 2021-March 31, 2026. Past performance is not indicative of future results.
Calendar Year Returns (%): Past 10 Years
ETF | 2025 | 2024 | 2023 | 2022 | 2021 | 2020 | 2019 | 2018 | 2017 | 2016 |
6.63 | 21.22 | -3.11 | -7.98 | 20.63 | 2.16 | 20.32 | 8.49 | 5.10 | 5.74 | |
12.29 | 35.25 | 23.08 | -12.63 | 27.53 | 15.67 | 24.53 | 3.44 | 13.58 | 8.19 |
Source: Morningstar, as of March 31, 2026. Past performance is not indicative of future results.
Trailing Returns (%)
ETF | 1 M | 3 M | 6 M | YTD | 1 Y | 2 Y | 3 Y | 5 Y | 10 Y | Since | Inception |
-3.61 | 7.13 | 4.96 | 7.13 | 5.39 | 12.93 | 10.82 | 11.1 | 9.85 | 13.53 | 3/19/2013 | |
-3.10 | -3.13 | -1.98 | -3.13 | 13.58 | 14.14 | 19.09 | 14.01 | 14.55 | 16.90 | 11/14/2012 |
Source: Morningstar, as of March 31, 2026.Past performance is not indicative of future results.
Sector Differences Between ZLU & ZSP
Performance (%):
| Fund | MTD | 1 M | 6 M | YTD | 1 Y | 2 Y | 5 Y | 10 Y | Since Inception | Inception Date |
| BMO US Equity Buffer Hedged to CAD ETF - April |
0.7 | 1.1 | 2.81 | 1.63 | 8.29 | 7.5 | - | - | 7.18 | 2024-03-26 |
| BMO US Equity Buffer Hedged to CAD ETF - January |
0.34 | -1.77 | 0.4 | -1.42 | 8.46 | 7.02 | - | - | 7.43 | 2024-01-24 |
| BMO US Equity Buffer Hedged to CAD ETF - October |
0.35 | -1.76 | 0.26 | -1.35 | 8.37 | 6.01 | - | - | 7.96 | 2023-09-27 |
| BMO US Equity Buffer Hedged to CAD ETF - July |
0.3 | -1 | 0.72 | -0.53 | 10.19 | - | - | - | 7.41 | 2024-06-27 |
| BMO S&P 500 Hedged to CAD ETF |
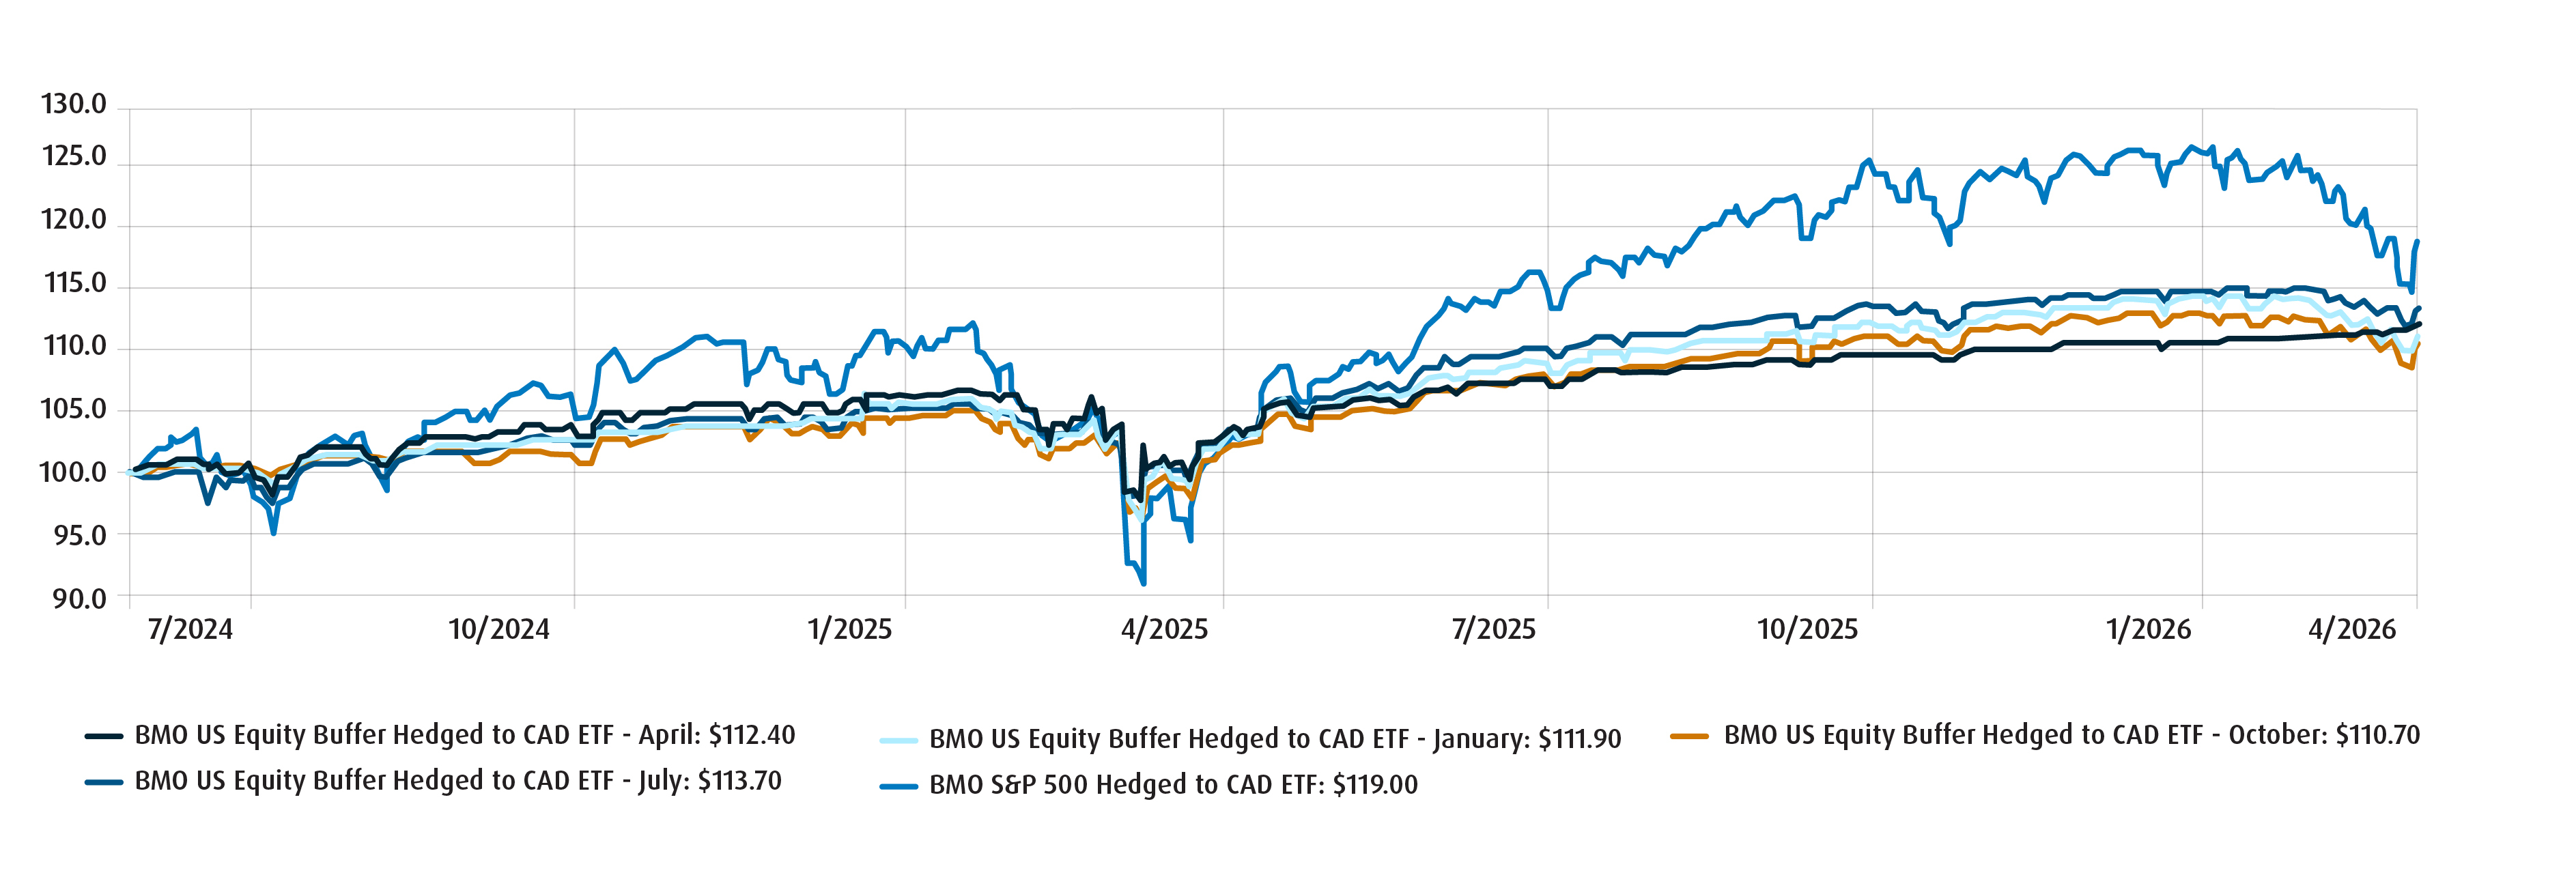
0.68 | -4.57 | -2.57 | -4.28 | 15.65 | 11.35 | 10.26 | 12.41 | - | - |
Source: Morningstar Direct, as of April 1, 2026. Past performance is not indicative of future results.
Growth of $10,000: June 29, 2024-April 1, 2026
2. Dividend Equity ETFs: Income as a Stabilizer
Dividend equity ETFs focus on companies with a history of paying (and often growing) dividends. BMO’s dividend ETFs typically emphasize consistent and growing dividend payouts, cash‑flow durability, and established business models, which tend to be more resilient during economic slowdowns. The methodology uses a robust combination of fundamental and quantitative screens (link to BMO Dividend ETFs: Portfolio Construction Methodology to learn more) to identify dividend payers poised to best perform.
With the dividend methodology, sector exposures tend to be closer to the respective broad market indexes than the low volatility ETFs, which tend to be more skewed towards the defensive sectors.
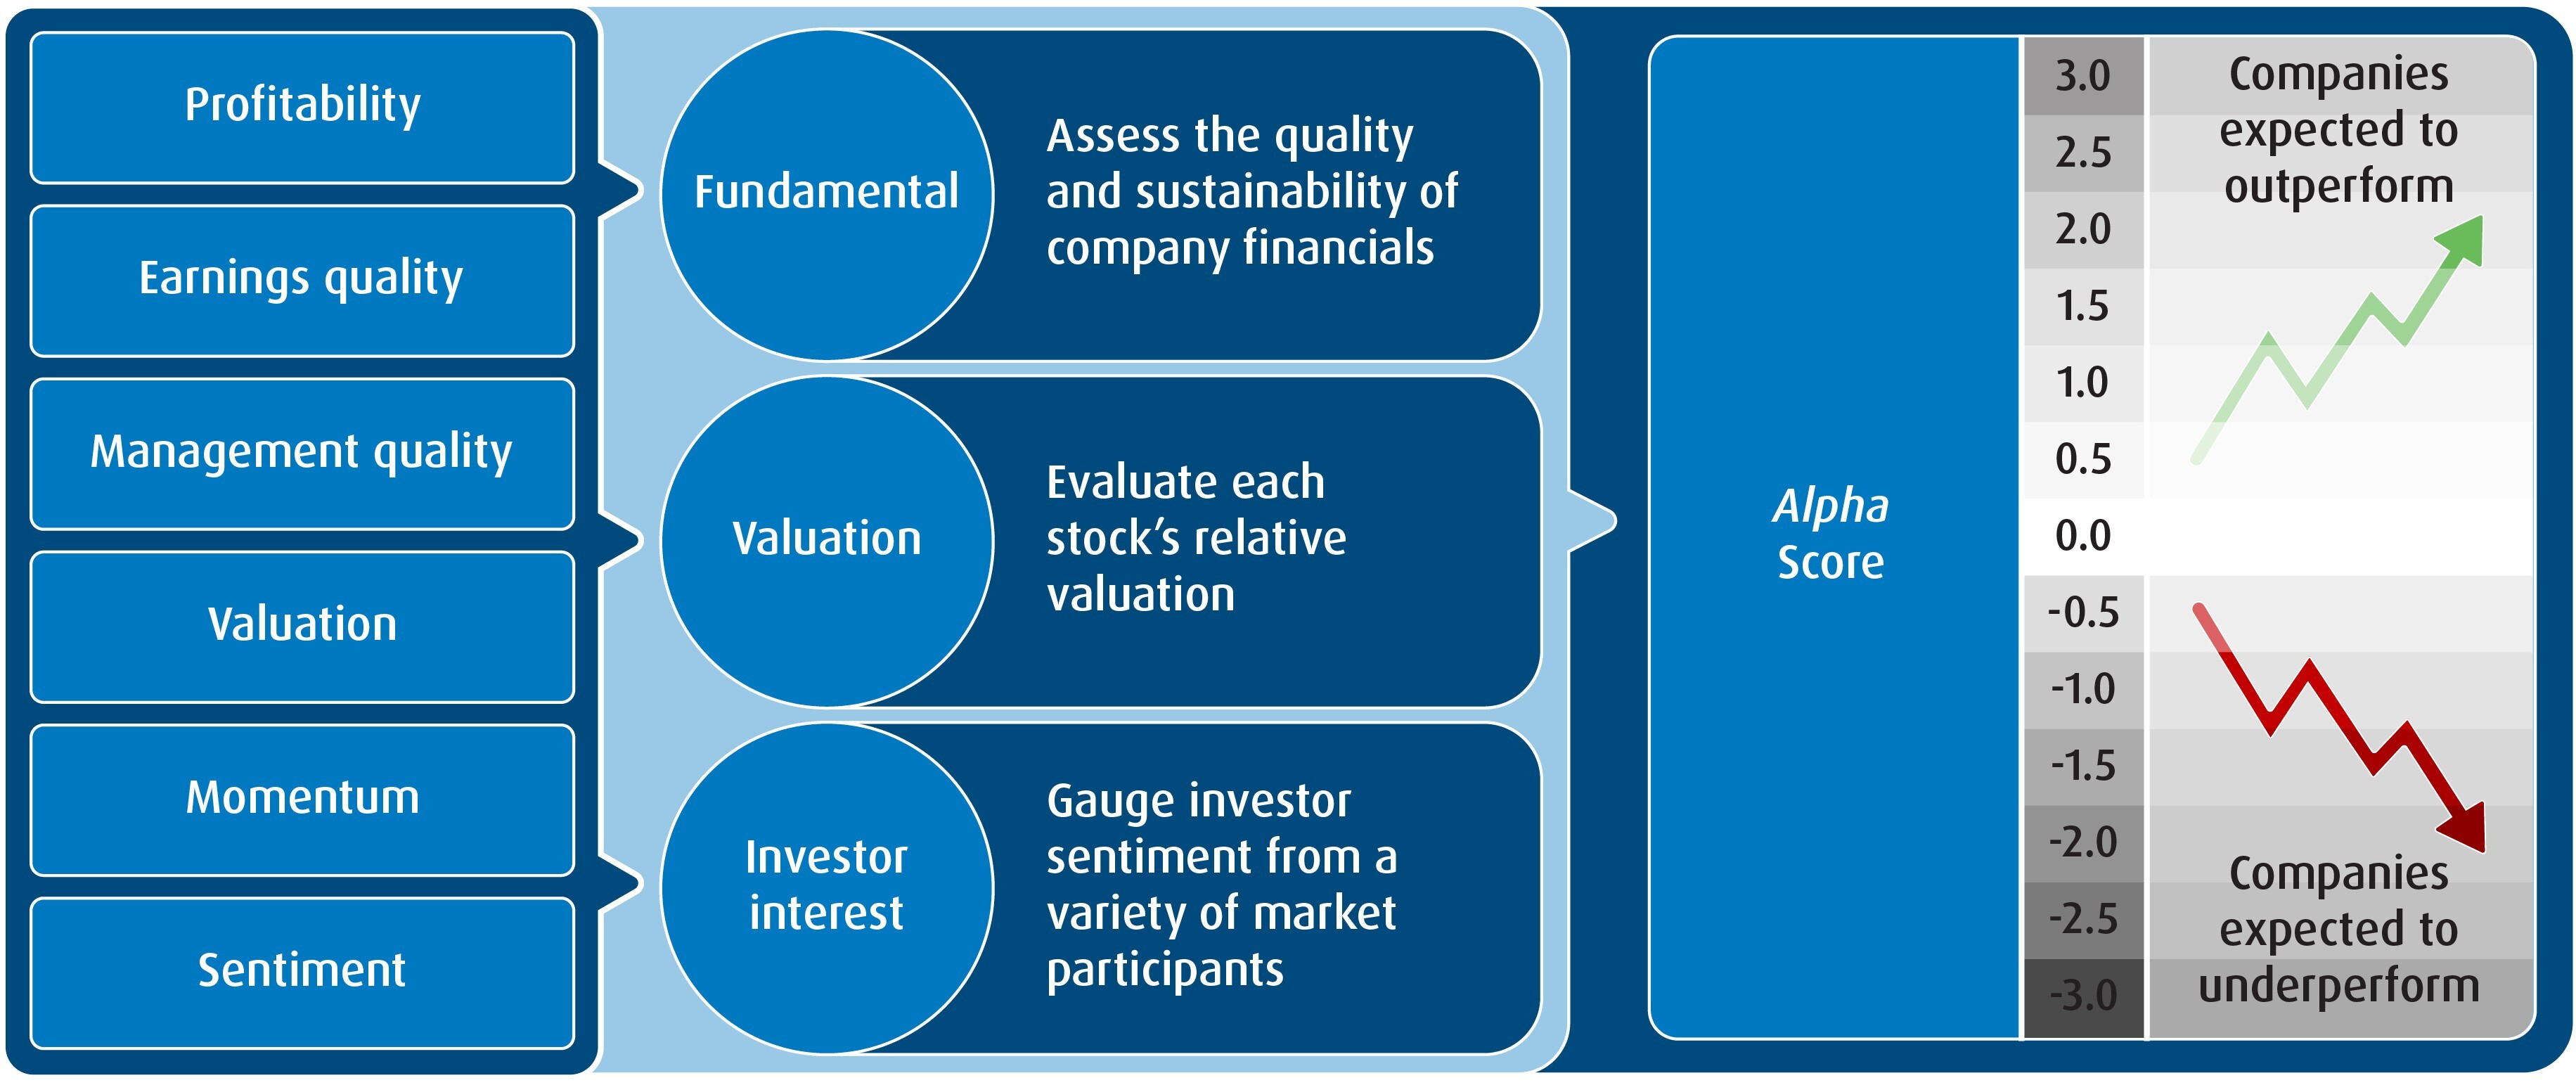
Stock Selection: Model Driven Process
A multi faceted alpha screening process is applied to the geographic universe aligned with each ETF — Canada, the U.S., or International markets. This proprietary alpha score is powered by fundamentally meaningful investment factors that have historically been associated with equity outperformance. Companies that excel on these metrics emerge as strong candidates for inclusion in the portfolio.
Target Portfolio Construction Controls:
Parameter |
Approach |
Universe |
Dividend payers only |
Sector Weights |
Benchmark + 5% |
Security Weights |
Benchmark + 10% (subject to 10% concentration limit) |
Rebalance |
Monthly – to timely update the portfolio |
Additional portfolio construction constraints ensure a well-balanced final portfolio, with managed exposure to sectors and individual securities.
How they behave in volatile markets
Dividends can act as a return cushion when markets are choppy, as investors continue to receive their dividends even as stock prices fluctuate. Historically, dividend‑oriented equity strategies have tended to experience slightly less severe drawdowns than broad equity markets, though they remain exposed to market risk, and can exhibit sector concentration (notably financials and utilities in Canada).
Best suited for
- Clients seeking long-term equity growth with a bit of cash flow
- Portfolios where income helps offset volatility psychologically and financially
Trailing Returns (%)
1 M |
6 M |
YTD |
1 Y |
2 Y |
5 Y |
10 Y |
|
-1.09 |
17.77 |
10.70 |
36.92 |
26.01 |
15.66 |
11.76 |
|
-4.30 |
10.4 |
3.94 |
34.73 |
24.89 |
15.12 |
12.56 |
|
-1.68 |
6.65 |
5.42 |
13.93 |
15.43 |
12.62 |
10.76 |
|
-3.10 |
-1.98 |
-3.13 |
13.58 |
14.14 |
14.01 |
14.55 |
|
-4.96 |
11.7 |
6.41 |
21.72 |
17.51 |
13.34 |
9.39 |
|
-6.64 |
4.93 |
2.08 |
18.21 |
15.04 |
10.28 |
9.27 |
Source: Morningstar, as of March 31, 2026. Past performance is not indicative of future results.
Calendar Year Returns (%): Past 10 Years
2025 |
2024 |
2023 |
2022 |
2021 |
2020 |
2019 |
2018 |
2017 |
2016 |
|
28.70 |
16.88 |
8.19 |
-1.62 |
28.59 |
-3.38 |
22.59 |
-10.65 |
7.71 |
24.15 |
|
31.55 |
21.55 |
11.67 |
-5.86 |
25.03 |
5.70 |
22.83 |
-8.84 |
9.05 |
20.99 |
|
10.09 |
25.89 |
4.68 |
-2.27 |
23.04 |
-5.19 |
16.97 |
3.95 |
6.71 |
20.18 |
|
12.29 |
35.25 |
23.08 |
-12.63 |
27.53 |
15.67 |
24.53 |
3.44 |
13.58 |
8.19 |
|
25.56 |
10.59 |
16.51 |
1.00 |
12.16 |
-5.62 |
13.01 |
-6.24 |
15.20 |
5.63 |
|
25.02 |
11.99 |
15.16 |
-8.26 |
10.26 |
5.72 |
16.16 |
-5.98 |
17.11 |
-1.85 |
Source: Morningstar, as of March 31, 2026. Past performance is not indicative of future results.
5-Year Risk Measures: April 1, 2021-March 31, 2026
ETF |
Return |
Standard |
Up Capture |
Down Capture |
Max |
15.66 |
11.76 |
94.30 |
87.33 |
-12.98 |
|
15.12 |
12.45 |
98.85 |
101.41 |
-14.4 |
|
12.61 |
10.82 |
77.87 |
73.92 |
-11.34 |
|
14.01 |
12.92 |
86.27 |
81.93 |
-18.66 |
|
13.33 |
11.40 |
70.92 |
52.81 |
-15.73 |
|
10.28 |
11.97 |
72.93 |
80.97 |
-20.96 |
Source: Morningstar, April 1, 2021-March 31, 2026. Past performance is not indicative of future results.
Choosing Between Them: A Practical Framework
Rather than asking which strategy is “best,” a more useful question is what type of defence is needed:
- Looking for a blend of growth, resilience, and income?
Dividend ETFs provide a balance of growth potential and ongoing cash flow, which can help offset volatility. - Want smoother long‑term equity exposure?
Low volatility ETFs aim to reduce swings across full market cycles though may lag during strong bull markets. - Worried about a near‑term correction?
Buffer ETFs offer explicit, time‑bound downside protection — with clear trade‑offs.
Drawdowns, Since April 1, 2023
Beta Spectrum by strategy, Since Oct 1, 2023 - Feb 28, 2026
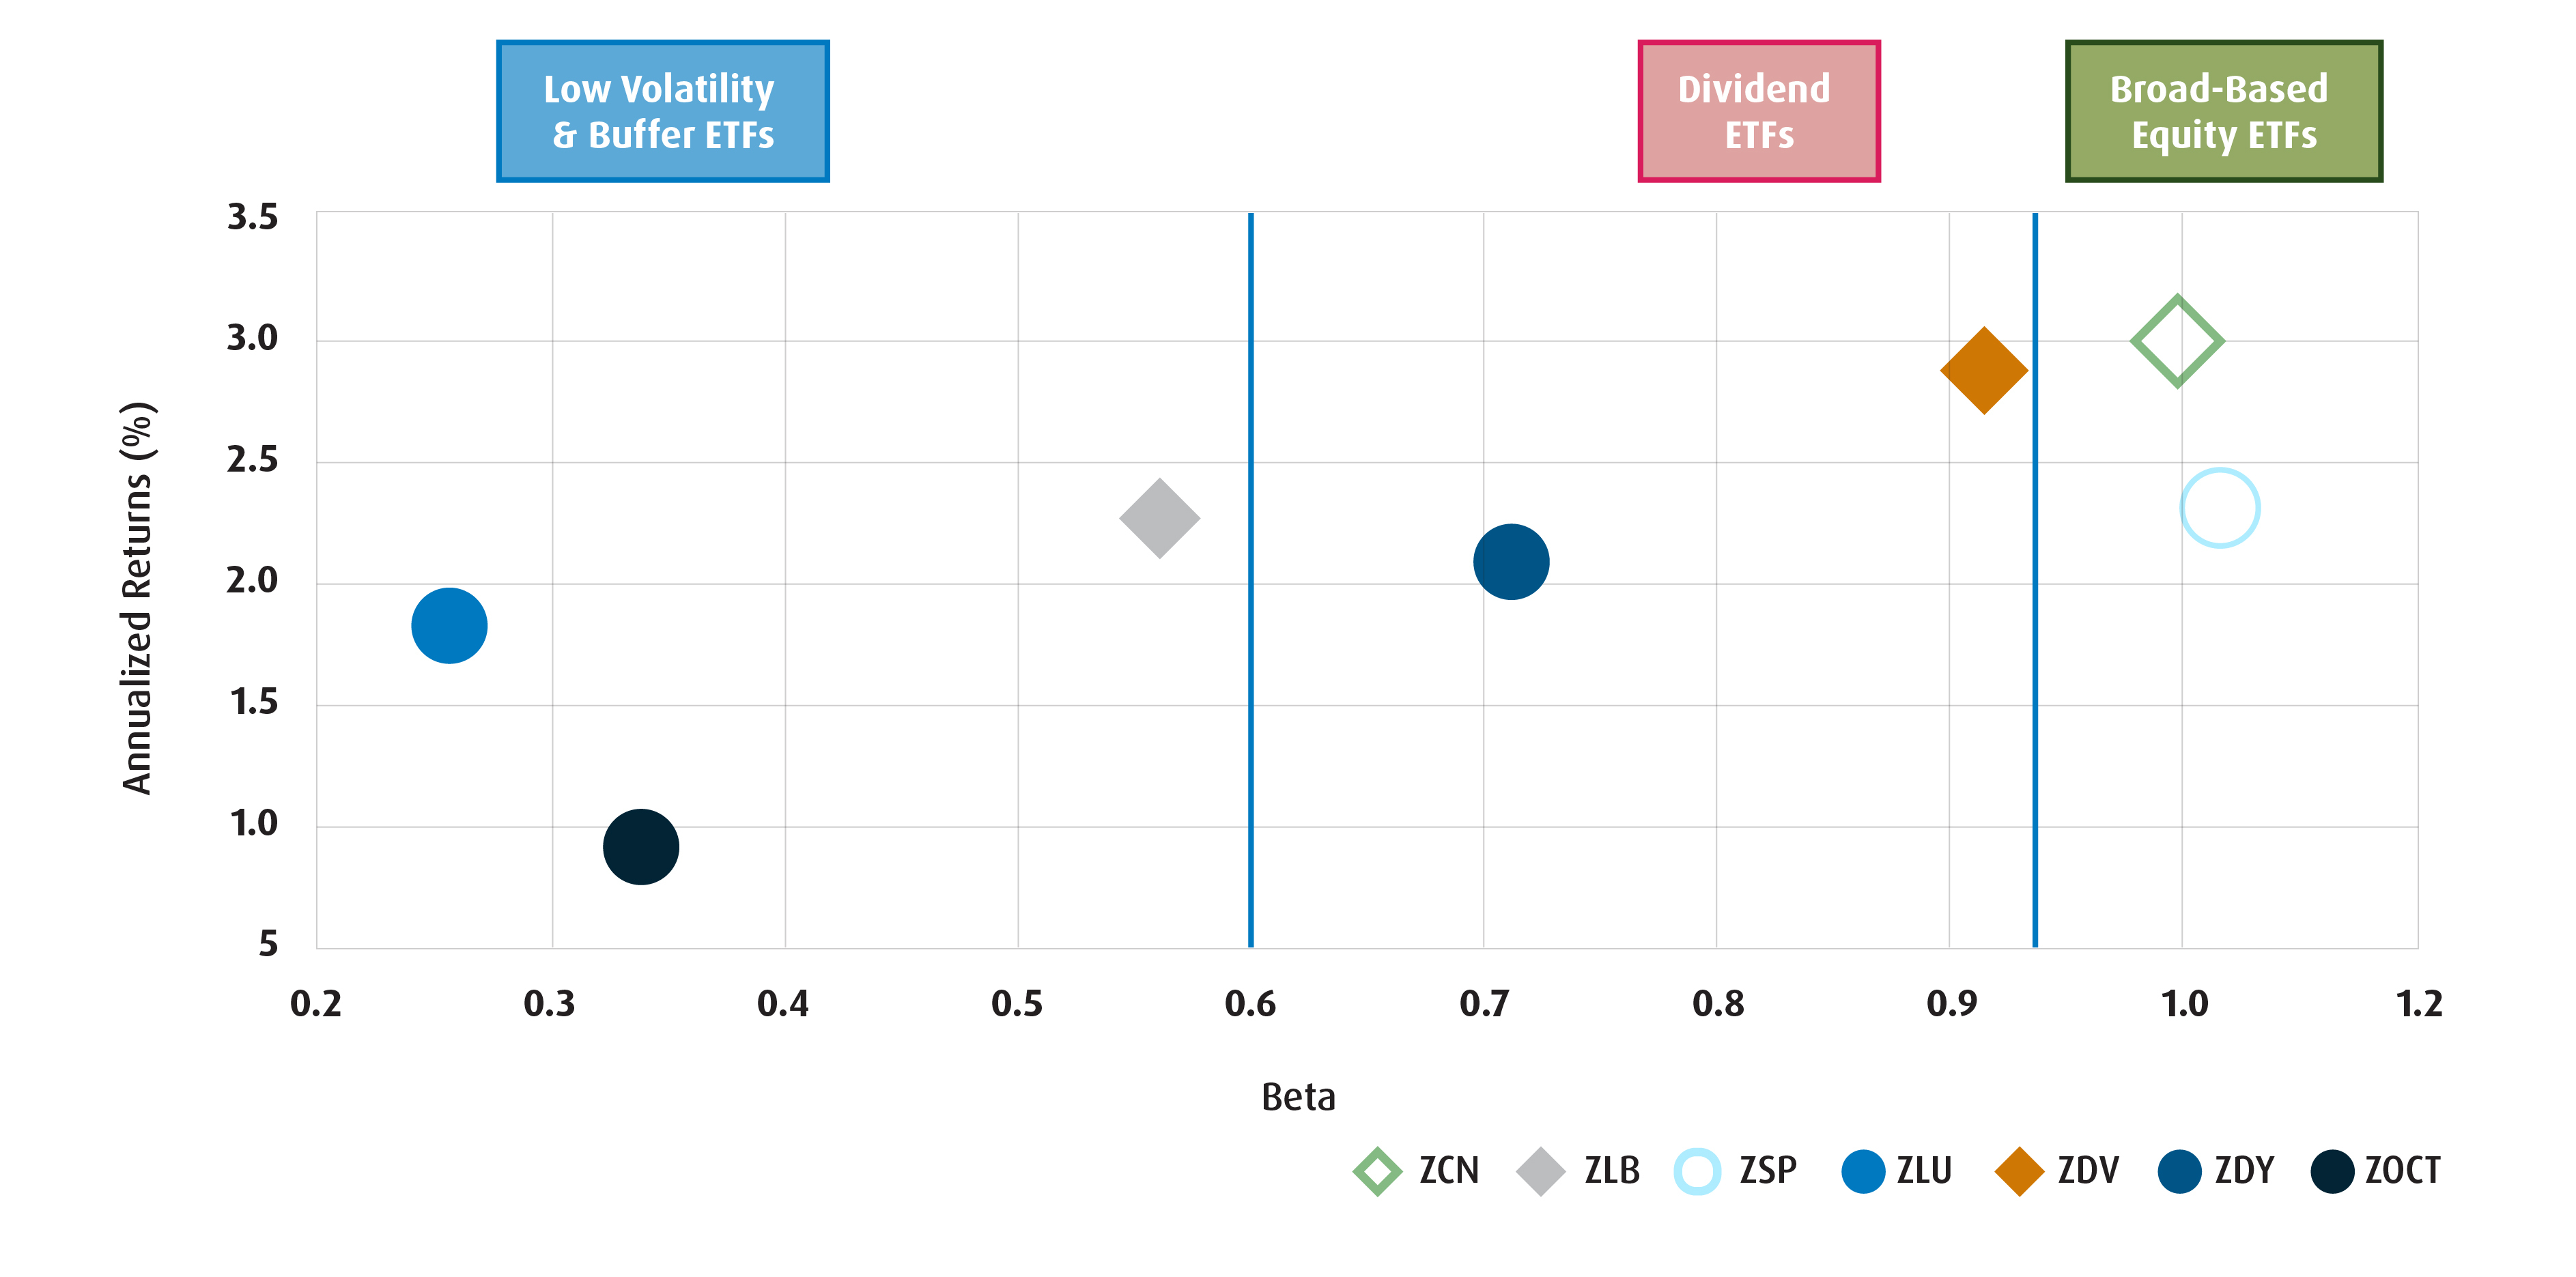
One way to think about it visually is to place these ETF strategies along a spectrum of risk, from higher beta to lower beta. Beta measures how sensitive an investment is to the overall market. A Beta of 1 means it moves in line with the market, below 1 means it’s less volatile, and above 1 means it tends to amplify market moves.
Note: ZCN, ZLB and ZDV are displaying Beta relative to the S&P/TSX Composite Index. ZSP, ZLU and ZDY Beta is shown relative to the S&P 500 Index in C$ and ZOCT is calculating Beta relative to the S&P 500 Hedged to CAD Index.
In practice, many portfolios blend these approaches. Low volatility can serve as a core investment for more conservative investors, dividends can be used for investors that desire a balance of growth and cash flow, and buffer ETFs can be either as a core for conservative investors, or used tactically when uncertainty is elevated.
3. Buffer ETFs: Defined Protection, Defined Trade‑offs
Think of buffer ETFs as S&P500 index exposure, with guardrails. Buffer ETFs (also known as structured outcome ETFs) are designed to provide S&P500 exposure with explicit downside protection over a defined outcome period, typically one year. BMO’s buffer ETFs use option strategies to protect against the first ~15% of market losses, while capping upside participation over the same period (that is the trade-off of the downside protection).
How They Behave in Volatile Markets
During sharp market sell‑offs, buffer ETFs can help absorb losses, offering psychological and portfolio‑level protection when volatility spikes. However, this protection only fully applies if the ETF is held from the start to the end of the outcome period; returns may differ for investors who buy or sell mid‑cycle. In strong rebound markets, the upside cap can limit participation. Advisors can refer to the BMO GAM Structured Outcome tool (BMO ETF Dashboard | Structured Outcome ETF Tool), which updates on a daily basis, and illustrates the growth potential and buffer protection available for each of the 4 buffer ETFs.
Best Suited for
- Investors with short‑term downside concerns yet still want to be invested in broad U.S. equities.
- Those transitioning from cash to equities (i.e., dollar cost averaging into the market or deploying a lump sum of capital) and concerned about current valuations.
- Risk‑averse investors who value defined outcomes over full market participation.
What to Know
- The BMO Buffer ETFs offer 15% buffer protection on ZUE, the S&P 500 Hedged-to-CAD Index ETF, on a Canadian dollar hedged basis (strips the USD currency return out of the equation).
- The upside potential of the buffer ETF will be dependent on the cost of the downside protection at the time of inception of the underlying one-year options.
- The one-year options automatically roll within the ETF at the end of the period – they do not de list and the tickers do not change. The buffer will reset to 15% from the rollover date and a new upside participation cap will be determined.
- Why was a 15% buffer level selected? At the time of launch in 2023, looking at market data going back to 2010, 90% of the time when the market is down over a one-year period, it has been down less than 15%.
- Sales aid – client friendly: BMO US Equity Buffer Hedged to CAD ETF
- Though BMO offers four quarterly buffer purchase options, ZAPR (BMO US Equity Buffer Hedged to CAD ETF - April) currently provides best value as it just had its annual roll date, and now provides a fresh 15% downside buffer and 9.69% upside participation level (which does not include dividend payments!).
Bottom Line
Defensive investing is not one‑size‑fits‑all. BMO’s low volatility, buffer, and dividend equity ETFs each manage risk differently — through risk screening by beta, options‑based protection, or stock selection plus income generation.
Understanding those differences helps investors choose the right tool for the right job, and, ultimately, stay invested when markets become unpredictable
Advisor Use Only.
This article is for information purposes. The information contained herein is not, and should not be construed as, investment, tax or legal advice to any party. Particular investments and/or trading strategies should be evaluated relative to the individual’s investment objectives and professional advice should be obtained with respect to any circumstance.
The viewpoints expressed represent an assessment of the markets at the time of publication. Those views are subject to change without notice at any time. The information provided herein does not constitute a solicitation of an offer to buy, or an offer to sell securities nor should the information be relied upon as investment advice. Past performance is no guarantee of future results. This communication is intended for informational purposes only.
An investor that purchases Units of a Structured Outcome ETF other than at starting NAV on the first day of a Target Outcome Period and/or sells Units of a Structured Outcome ETF prior to the end of a Target Outcome Period may experience results that are very different from the target outcomes sought by the Structured Outcome ETF for that Target Outcome Period. Both the cap and, where applicable, the buffer are fixed levels that are calculated in relation to the market price of the applicable Reference ETF and a Structured Outcome ETF’s NAV (as Structured herein) at the start of each Target Outcome Period. As the market price of the applicable Reference ETF and the Structured Outcome ETF’s NAV will change over the Target Outcome Period, an investor acquiring Units of a Structured Outcome ETF after the start of a Target Outcome Period will likely have a different return potential than an investor who purchased Units of a Structured Outcome ETF at the start of the Target Outcome Period. This is because while the cap and, as applicable, the buffer for the Target Outcome Period are fixed levels that remain constant throughout the Target Outcome Period, an investor purchasing Units of a Structured Outcome ETF at market value during the Target Outcome Period likely purchased Units of a Structured Outcome ETF at a market price that is different from the Structured Outcome ETF’s NAV at the start of the Target Outcome Period (i.e., the NAV that the cap and, as applicable, the buffer reference). In addition, the market price of the applicable Reference ETF is likely to be different from the price of that Reference ETF at the start of the Target Outcome Period. To achieve the intended target outcomes sought by a Structured Outcome ETF for a Target Outcome Period, an investor must hold Units of the Structured Outcome ETF for that entire Target Outcome Period.
All investments involve risk. The value of an ETF can go down as well as up and you could lose money. The risk of an ETF is rated based on the volatility of the ETF’s returns using the standardized risk classification methodology mandated by the Canadian Securities Administrators. Historical volatility doesn’t tell you how volatile an ETF will be in the future. An ETF with a risk rating of “low” can still lose money. For more information about the risk rating and specific risks that can affect an ETF’s returns, see the BMO ETFs’ prospectus.
Distribution yields are calculated by using the most recent regular distribution, or expected distribution, (which may be based on income, dividends, return of capital, and option premiums, as applicable) and excluding additional year end distributions, and special reinvested distributions annualized for frequency, divided by current net asset value (NAV). The yield calculation does not include reinvested distributions.
Distributions are not guaranteed, may fluctuate and are subject to change and/or elimination. Distribution rates may change without notice (up or down) depending on market conditions and NAV fluctuations.
The payment of distributions should not be confused with the BMO ETF’s performance, rate of return or yield. If distributions paid by a BMO ETF are greater than the performance of the investment fund, your original investment will shrink. Distributions paid as a result of capital gains realized by a BMO ETF, and income and dividends earned by a BMO ETF, are taxable in your hands in the year they are paid.
Your adjusted cost base will be reduced by the amount of any returns of capital. If your adjusted cost base goes below zero, you will have to pay capital gains tax on the amount below zero.
Cash distributions, if any, on units of a BMO ETF (other than accumulating units or units subject to a distribution reinvestment plan) are expected to be paid primarily out of dividends or distributions, and other income or gains, received by the BMO ETF less the expenses of the BMO ETF, but may also consist of non-taxable amounts including returns of capital, which may be paid in the manager’s sole discretion. To the extent that the expenses of a BMO ETF exceed the income generated by such BMO ETF in any given month, quarter, or year, as the case may be, it is not expected that a monthly, quarterly, or annual distribution will be paid. Distributions, if any, in respect of the accumulating units of BMO Short Corporate Bond Index ETF, BMO Short Federal Bond Index ETF, BMO Short Provincial Bond Index ETF, BMO Ultra Short-Term Bond ETF and BMO Ultra Short-Term US Bond ETF will be automatically reinvested in additional accumulating units of the applicable BMO ETF. Following each distribution, the number of accumulating units of the applicable BMO ETF will be immediately consolidated so that the number of outstanding accumulating units of the applicable BMO ETF will be the same as the number of outstanding accumulating units before the distribution. Non-resident unitholders may have the number of securities reduced due to withholding tax. Certain BMO ETFs have adopted a distribution reinvestment plan, which provides that a unitholder may elect to automatically reinvest all cash distributions paid on units held by that unitholder in additional units of the applicable BMO ETF in accordance with the terms of the distribution reinvestment plan. For further information, see the distribution policy in the BMO ETFs’ prospectus.
The S&P 500 Index and the S&P/TSX Capped Composite Index are products of S&P Dow Jones Indices LLC or its affiliates (“SPDJI”), and have been licensed for use by the Manager. S&P®, S&P 500®, US 500, The 500, iBoxx®, iTraxx® and CDX® are trademarks of S&P Global, Inc. or its affiliates (“S&P”) and Dow Jones® is a registered trademark of Dow Jones Trademark Holdings LLC (“Dow Jones”), and these trademarks have been licensed for use by SPDJI and sublicensed for certain purposes by the Manager. The ETF is not sponsored, endorsed, sold or promoted by SPDJI, Dow Jones, S&P, their respective affiliates, and none of such parties make any representation regarding the advisability of investing in such product(s) nor do they have any liability for any errors, omissions, or interruptions of the Index.
The BMO MSCI EAFE ETF referred to herein is not sponsored, endorsed, or promoted by MSCI and MSCI bears no liability with respect to the ETF or any index on which such ETF is based. The ETF’s prospectus contains a more detailed description of the limited relationship MSCI has with the Manager and any related ETF.
Commissions, management fees and expenses all may be associated with investments in exchange-traded funds. Please read the ETF Facts or prospectus of the BMO ETFs before investing. The indicated rates of return are the historical annual compounded total returns including changes in unit value and reinvestment of all dividends or distributions and do not take into account sales, redemption, distribution or optional charges or income taxes payable by any unitholder that would have reduced returns. Exchange-traded funds are not guaranteed, their values change frequently and past performance may not be repeated.
For a summary of the risks of an investment in the BMO ETFs, please see the specific risks set out in the BMO ETF’s prospectus. BMO ETFs trade like stocks, fluctuate in market value and may trade at a discount to their net asset value, which may increase the risk of loss. Distributions are not guaranteed and are subject to change and/or elimination.
BMO ETFs are managed by BMO Asset Management Inc., an investment fund manager, portfolio manager, and a separate legal entity from Bank of Montreal.
BMO Global Asset Management is a brand name under which BMO Asset Management Inc. and BMO Investments Inc. operate.
“BMO (M-bar roundel symbol)” is a registered trademark of Bank of Montreal, used under licence.