US Dollars to Invest? These 10 ETFs Should Be on Your Radar
Not sure how to invest your clients’ U.S. dollars? Erika Toth, Director, Director, Institutional & Advisory ETF Distribution, BMO ETFs, breaks down the benefits of BMO’s suite of USD ETFs, with solutions ranging from places to park cash to tax-efficient1 income generators to index-based equity exposure and beyond.


For Advisors, Family Offices and Investment Counselors managing money for wealthy Canadians, our “.U” ETFs (which are $USD denominated, but traded on the Toronto Stock Exchange) offer a convenient way to invest cleanly and directly into US assets. And the benefits don’t stop there.
Two key advantages of .U solutions that portfolio managers should know about are:
- There is no exposure to U.S. Estate Taxes
- There is no requirement to fill out T-1135 Foreign Income Verification forms come tax time each year, as these are considered Canadian-domiciled trusts
BMO Global Asset Management has many offerings to choose from across different asset classes, empowering portfolio managers to build a complete portfolio to match their clients’ risk tolerance level and current market conditions.
Below, we will explore some of the options, broken down by asset class.
A parking spot for cash
After the historic increase in interest rates over the past year, rates on cash and near-cash instruments have become compelling.
1. ZUS.U – BMO Ultra Short-Term US Bond ETF (USD Units)
ZUS.U invests in U.S. investment grade bonds under one year to maturity, and the bonds are held to maturity. The portfolio is rebalanced based on fundamental analysis, relative strength indicators, and risk-adjusted yield expectations.
Investment Characteristics:2
- Annualized Distribution Yield3: 4.89%; monthly pay
- Yield to Maturity4: 5.77%
- Duration: 0.48 years
- MER: 0.17%
- Also available in an Accumulating Units option, the BMO Ultra Short-Term US Bond ETF (US Dollar Accumulating Units) (ZUS.V), which reinvests the monthly distributions
Income plays
2. ZWB.U – BMO Covered Call Canadian Banks ETF (US Dollar Units)
This ETF holds the six largest Canadian banks, equally weighted. Call options are sold on half of the portfolio to protect against downside risk and boost the level of monthly income. Why half? This is to provide a balance between generating additional cash flow while protecting against downside risk and capturing the majority of the upside growth potential of the stocks over time.
The annualized distribution yield is 7.33%;2 roughly half of this yield comes from the banks’ dividends, which are taxed as Canadian eligible dividends, and the other half comes from the call option premiums, which are taxed as capital gains.
BMO introduced ZWB, the first covered call ETF, to the market in 2011, and it remains the largest covered call ETF in Canada2. The USD units, ZWB.U, were introduced in 2022.
3. ZPAY.U – BMO Premium Yield ETF (USD Units)
This ETF sells call and put options on a basket of large-cap, high-fundamental-quality blue-chip US equities.
We sometimes refer to this ETF as the “buy low, sell high and get paid to wait” ETF. With the out-of-the-money call and put options, equity weight will adjust depending on market conditions. As markets rally, we gradually lighten up on our equity exposure via the call options. As markets drop, we buy names we like on sale via the put options.
The current equity weight2 is 45.82% but was as high as 70% in early 2023.
The annualized distribution yield of ZPAY.U is % 6.62%,2 with roughly 1% coming from the underlying dividends. (Because they are dividends from U.S. companies, this portion is taxed as foreign income.) The remainder comes from the call and put option premiums.
Bonds are back
4. ZTL.U – BMO Long-Term US Treasury Bond Index ETF (USD Units)
Many portfolio managers have increased their allocations to fixed income over the last several quarters and have added duration within their bond sleeves. The yield curve may not see much more inversion on the long end. However, the return to a more normalized correlation between long bonds and equities means that the efficiency of long bonds as an equity market hedge is returning.
ZTL.U replicates the returns of the Bloomberg U.S. Treasury 20+ Year Index, net of expenses. The Fund invests in a variety of U.S. Treasuries, primarily with a term to maturity greater than twenty years.
- Entirely AAA rated credit
- Annualized distribution yield of 3.47%, weighted average YTM of 3.98%2
- Weighted average duration of 17.48 years2
- Management fee of 0.2% and MER 0.23%2
- Why purchase ZTL.U instead of the US-listed TLT? No U.S. estate tax exposure or T-1135 filing
- Also available in $CAD unhedged BMO Long-Term US Treasury Bond Index ETF (ZTL) and $CAD hedged BMO Long-Term US Treasury Bond Index ETF (Hedged Units) (ZTL.F)
Not all investors are comfortable with a duration in excess of 15 years. Those who prefer less rate sensitivity but want to maintain a high level of overall credit quality can consider:
5. ZUAG.U – BMO US Aggregate Bond Index ETF (USD Units)
The U.S. has a broader aggregate fixed income index than our FTSE Canada Universe Bond Index, more diversified corporate bond issuers, and 30% weight in securitized bonds (which are mortgage-backed securities backed by the U.S. government that carry a AAA credit rating). The average credit quality for the index is AA. Overall exposure is 40.6% Treasuries, 29.4% Securitized, 25.3% corporates, and 4.9% government agency issued.6
- ZUAG.U tracks the Bloomberg US Treasury 20+ Year Index
- Annualized distribution yield of 2.03%, weighted average Yield to Maturity of 4.79%%2
- Lower duration than ZAG (6.31 years versus 7.41 years) – you are assuming less interest rate sensitivity versus the Canadian bond benchmark, or versus ZTL.U outlined above.
- Why purchase ZUAG.U instead of the U.S.-listed AGG? No U.S. estate tax exposure or T-1135 filing
- Competitive management fee of 0.08%,2 which is less than half the cost compared to other Canadian-listed issuers.
- Also available in $CAD hedged BMO US Aggregate Bond Index ETF (Hedged Units) (ZUAG.F) and $CAD unhedged BMO US Aggregate Bond Index ETF (ZUAG)
Broad equities: index- and rules-based
6. ZSP.U – BMO S&P 500 Index ETF (USD Units)
Those looking for the broad, low cost and highly liquid U.S. equity exposure to the S&P 500 should look no further than ZSP.U. Many portfolio managers use the S&P 500 alongside their individual stock holdings to capture quick macroeconomic opportunities and to reduce the impact of cash drag on their portfolios to remain fully invested at all times.
BMO’s ZSP is the largest S&P 500 ETF in Canada, with assets under management of $9.59 billion CAD3. The $USD units, ZSP.U, account for another $1.84 billion in assets, and the $CAD hedged ZUE another $1.87 billion; all three purchase options are managed as one pool.
Many portfolio managers are surprised to learn that with a management fee of 0.08% and MER of 0.09%, ZSP.U is now actually priced cheaper than the U.S.-listed SPY (which has a gross expense ratio of 0.0945%).2
And again, why purchase ZSP.U instead of the U.S.-listed SPY? No U.S. estate tax exposure or T-1135 filing.
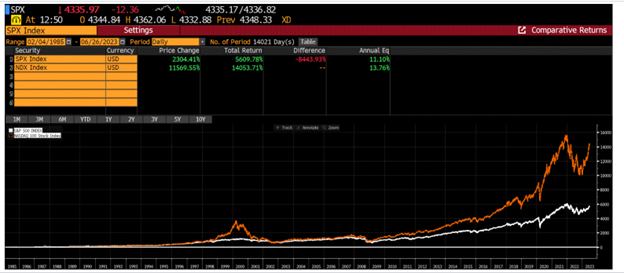
7. ZNQ.U – BMO Nasdaq 100 Equity Index ETF (USD Units)
Investors with a longer-term horizon may want to consider Nasdaq exposure to boost the growth potential of their portfolios. Since common inception in January 1985, the returns of the Nasdaq-100 Index have dwarfed those of the S&P 500, as the chart below demonstrates.
Contrary to popular belief, the Nasdaq-100 Index is not 100% technology. Its top sector exposures are 51% Technology, 17% Communication Services, 14% Consumer Discretionary, and 5.5% Healthcare.7
Between BMO’s three currency options for the Nasdaq-100 Index, the assets under management are $2 billion6. Similar to ZSP and ZUAG, the hedged (ZQQ), unhedged (ZNQ), and $USD baskets (ZNQ.U) are managed as one pool. Because the underlying stocks and bonds are large and liquid, the ETF will benefit from that liquidity as well. Investors should look at the bid-offer spreads when evaluating the liquidity of an ETF, and not the trading volume, since ETFs are an open-ended structure and units can be created or redeemed to reflect supply and demand.
Canadian investors with $USD on hand should consider purchasing ZNQ.U instead of the popular U.S.-listed QQQ units. As a Canadian-domiciled trust, ZNQ.U is not subject to U.S. estate taxes or T-1135 filing.
8. ZUQ.U – BMO MSCI USA High Quality Index ETF (USD Units)
Of the U.S. equity factors on the BMO ETF shelf (Low Volatility, High Quality, Value, Size and Dividends), the Quality factor may minimize risk and provide good long-term growth opportunities.
The MSCI USA High Quality index is rules-based and screens for the 125 names of the highest fundamental quality defined by the following filters: high return on equity (ROE), stable year-over-year earnings growth and low financial leverage. As a result of these screens, the Fund will tend to have a lower weight to Financial, and Utilities which have higher leverage, and it a higher weighting in Technology.
While less Technology-oriented than the Nasdaq-100 index (which is at 51%), ZUQ.U still provides an overweight to tech versus the S&P 500 (34.15% and 28.2% respectively).6
The three currency versions of ZUQ — unhedged (ZUQ), CAD hedged (ZUQ.F), and ZUQ.U (USD units) — represent $530 million in assets under management.5
9. ZLU.U – BMO Low Volatility US Equity ETF (USD Units)
Investors who are focused on capital preservation or are wanting to tilt their U.S. equity exposure more defensively should consider BMO’s Low Volatility ETF, which follows a proprietary rules-based approach and screens for the 100 stocks with the lowest beta versus the broad market. The resulting portfolio is less sensitive to the economic cycle.
Together, all three currency versions of ZLU — unhedged, CAD hedged (ZLH) and ZLU.U (USD units) — account for AUM of $1.67 billion.5
One-Ticket Balanced
10. ZMI.U – BMO Monthly Income ETF (USD Units)
ZMI.U is a great option for investors wanting to keep it simple with a one-ticket balanced solution.
- The annualized distribution yield is 4.94%.2
- ZMI ($CAD version; BMO Monthly Income ETF) has been in existence since 2011, and was one of the first one-ticket asset allocation ETFs in Canada.
- ZMI.U features a portfolio of yield-oriented ETFs: dividend-paying ETFs on the equity side, and Investment Grade corporate bonds on the fixed income side.
- The management fee is a very low 0.18% (MER is 0.2% including taxes).2 There is no double dipping on management fees of the underlying ETFs – the advertised fee is what investors are actually paying; what you see is what you get.
- Asset allocation is approximately 60% equity, 40% fixed income, and regional allocation is 38% US, 38% Canada, with the balance being international developed markets.2
- The fund is rated low-to-medium risk.
Additional resources for Advisors, Portfolio Managers & Family Offices with snowbird clients:
BMO ETF Roadmap (.U ETFs listed are listed on page 4)
Article: Tax Issues, U.S. Investing, and Your Clients
Full list of BMO’s .U ETFs:
Solutions for U.S. Dollar Accounts
- No U.S. Estate Tax Exposure
- No T-1135 Foreign Income Verification form required
- Learn more about our US dollar solutions
Equity
BMO S&P 500 Index ZSP.U | BMO Nasdaq 100 Equity Index ZNQ.U | BMO MSCI USA High Quality Index ZUQ.U |
BMO Low Volatility US Equity ZLU.U | BMO US Dividend ZDY.U | BMO US High Dividend Covered Call ZWH.U |
BMO Covered Call Banks ZWB.U | BMO S&P US Mid Cap Index ZMID.U | BMO S&P US Small Cap Index ZSML.U |
Fixed Income
BMO Short-Term US TIPS Index ZTIP.U | BMO US TIPS Index TIPS.U | |
BMO US Aggregate Bond Index ZUAG.U | BMO Mid-Term US IG Corporate Bond Index ZIC.U | BMO Short-Term US Treasury Bond Index ZTS.U |
BMO Mid-Term US Treasury Bond Index ZTM.U | BMO Long-Term US Treasury Bond Index ZTL.U | BMO High Yield US Corporate Bond ZJK.U |
Asset Allocation
BMO Monthly Income ZMI.U |
Alternatives
BMO US Preferred Share Index ZUP.U | BMO US Put Write ZPW.U | BMO Premium Yield ZPAY.U | BMO Laddered Preferred Share Index ZPR.U |
Note: When entering U.S. Dollar unit symbol “(.U)” on Thomson One use “(‘U)”. (‘U-T) for TSX listed ETFs and (‘U-GD) for NEO listed ETFs
For more information on BMO’s USD ETF solutions, reach out to your regional Institutional BMO ETF Specialist.
1 Tax-Efficient: as compared to an investment that generates an equivalent amount of interest income.
2 As of June 30, 2023.
3 Annualized distribution yield: The most recent regular distribution, or expected distribution, (excluding additional year end distributions) annualized for frequency, divided by current NAV.
4 Yield to maturity (YTM): The total expected return from a bond when it is held until maturity – including all interest, coupon payments, and premium or discount adjustments.
5 Measured by AUM, as of March 31, 2023.
6 As of July 4, 2023.
7 As of June 26, 2023.
Disclosures:
Any statement that necessarily depends on future events may be a forward-looking statement. Forward-looking statements are not guarantees of performance. They involve risks, uncertainties and assumptions. Although such statements are based on assumptions that are believed to be reasonable, there can be no assurance that actual results will not differ materially from expectations. Investors are cautioned not to rely unduly on any forward-looking statements. In connection with any forward-looking statements, investors should carefully consider the areas of risk described in the most recent simplified prospectus.
The viewpoints expressed by the authors represents their assessment of the markets at the time of publication. Those views are subject to change without notice at any time without any kind of notice. The information provided herein does not constitute a solicitation of an offer to buy, or an offer to sell securities nor should the information be relied upon as investment advice. Past performance is no guarantee of future results. The statistics in this update are based on information believed to be reliable but not guaranteed.
This article is for information purposes. The information contained herein is not, and should not be construed as, investment, tax or legal advice to any party. Investments should be evaluated relative to the individual’s investment objectives and professional advice should be obtained with respect to any circumstance.
S&P®, S&P/TSX Capped Composite®, S&P 500® are registered trademarks of Standard & Poor’s Financial Services LLC (“S&P”) and “TSX” is a trademark of TSX Inc. These trademarks have been licensed for use by S&P Dow Jones Indices LLC and sublicensed to BMO Asset Management Inc. in connection with the ETFs. The ETFs are not sponsored, endorsed, sold or promoted by S&P Dow Jones LLC, S&P, TSX, or their respective affiliates and S&P Dow Jones Indices LLC, S&P, TSX and their affiliates make no representation regarding the advisability of trading or investing in such BMO ETF(s).
The ETF referred to herein is not sponsored, endorsed, or promoted by MSCI and MSCI bears no liability with respect to the ETF or any index on which such ETF is based. The ETF’s prospectus contains a more detailed description of the limited relationship MSCI has with the Manager and any related ETF.
Nasdaq® is a registered trademark of Nasdaq, Inc. (which with its affiliates is referred to as the “Corporations”) and is licensed for use by the Manager. The ETF has not been passed on by the Corporations as to their legality or suitability. The ETF is not issued, endorsed, sold, or promoted by the Corporations. The Corporations make no warranties and bear no liability with respect to the ETF.
Commissions, management fees and expenses all may be associated with investments in exchange traded funds. Please read the ETF Facts or prospectus before investing. The indicated rates of return are the historical annual compounded total returns including changes in unit value and reinvestment of all dividends or distributions and do not take into account sales, redemption, distribution or optional charges or income taxes payable by any unitholder that would have reduced returns. Exchange traded funds are not guaranteed, their values change frequently and past performance may not be repeated.
For a summary of the risks of an investment in the BMO ETFs, please see the specific risks set out in the prospectus. BMO ETFs trade like stocks, fluctuate in market value and may trade at a discount to their net asset value, which may increase the risk of loss. Distributions are not guaranteed and are subject to change and/or elimination.
BMO ETFs are managed by BMO Asset Management Inc., which is an investment fund manager and a portfolio manager, and a separate legal entity from Bank of Montreal.
BMO Global Asset Management is a brand name under which BMO Asset Management Inc. and BMO Investments Inc. operate.
®/™Registered trademarks/trademark of Bank of Montreal, used under licence.