Macro Notes - How High Can US Tax Rates Go?
July 25, 2025
In the United States, the gross federal debt-to-GDP ratio has ranged between the 118-125% range for the past few years.
The last time the US approached that level of indebtedness was World War II. And the deleveraging process took several decades to play out (Chart 1).
A painful part of that process was the rise in income tax rates – with the top marginal rate reaching as high as 90% in the early 1960s (Chart 2). In fact, taxes remained elevated throughout the 1970s as well and didn’t really shift lower until the Reagan era of the 1980s.
We bring this up because the passage of OBBBA (or the “One, Big, Beautiful Bill Act”) means that the US debt-to-GDP ratio is set to climb further in the decades to come – potentially as high as 180%.
It’s hard to envisage economic growth outpacing that of debt given the backdrop. That means one, or more of the below are likely in the coming years:
- The US leans further into protectionism (to source tariff revenues)
- Spending cuts
- Higher income taxes
We suspect that it’s a combination of the three. Having said this, the right policy path to pursue for better outcomes would be the last bullet – receipts from income taxes are far too low given the level of the debt and deficits.
Failure to act on this will inevitably mean higher bond yields over time.
Chart 1: US Debt to GDP (%) Over Time
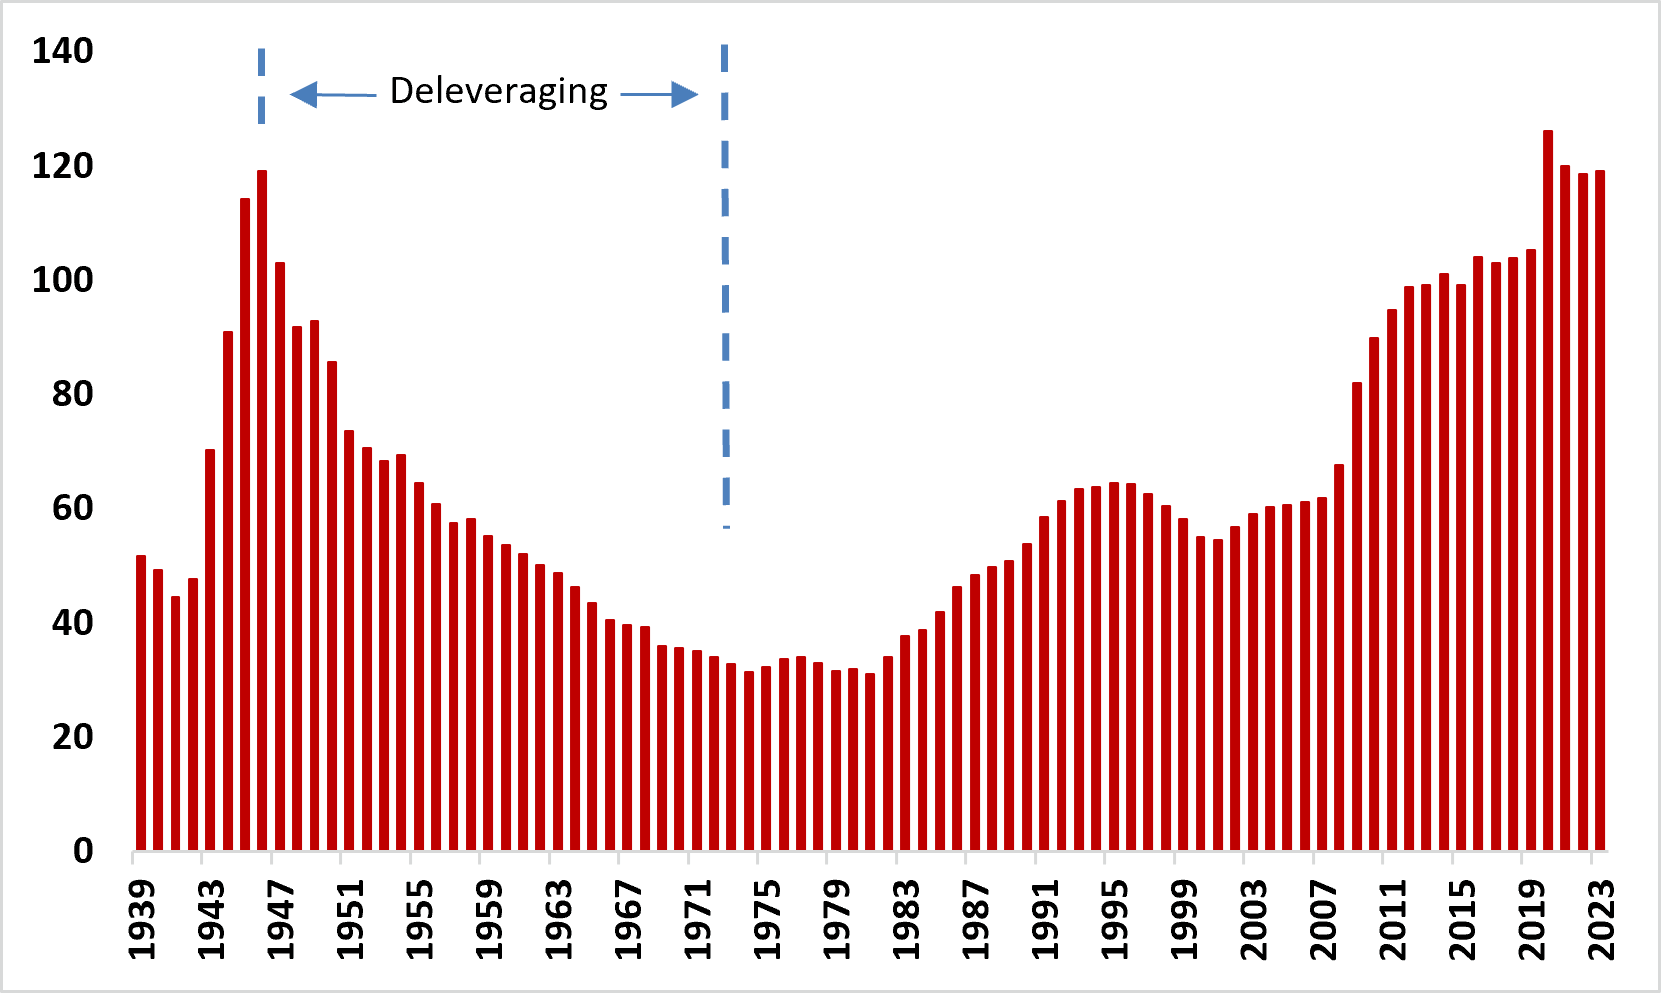
Source: FRED
Chart 2: Top US Marginal Income Tax Rate (%) Over Time
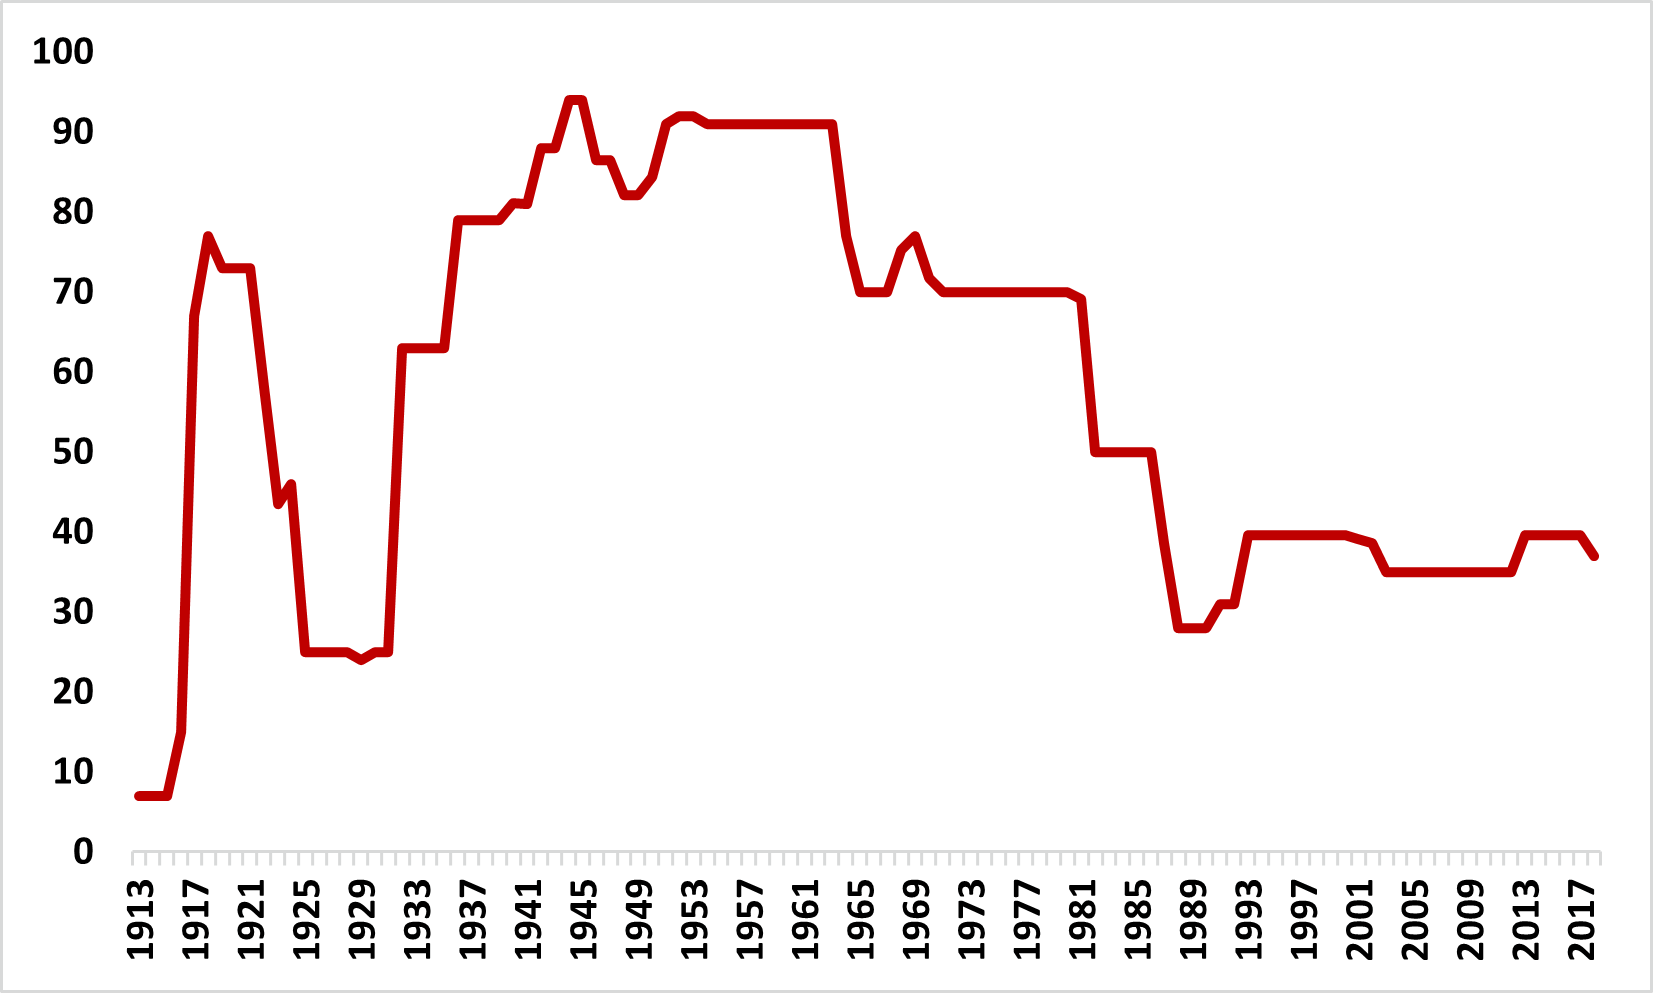
Source: US Tax Policy Center