Macro Notes - The AI Boom Explained in Two Charts
August 07, 2025
Lost in the details of last week’s US GDP release was the fact that proxies for AI-related expenditures continue to show strength.
Chart 1 shows how the average quarterly growth in spending on ‘software + research/development’ stacks up against personal consumption and headline real GDP in the US over the past eight quarters. It’s worth noting that the last two quarters of data have amplified this trend.
Meanwhile, Chart 2 shows the change in earnings expectations by sector since the start of this year.
The moral of the story – despite clear signs of slower real activity in the US economy, AI-related enthusiasm is providing an effective offset.
Long ‘Tech + Comms’ is still where its at.
Chart 1 – Growth in AI spending is outpacing Personal Consumption and Real GDP
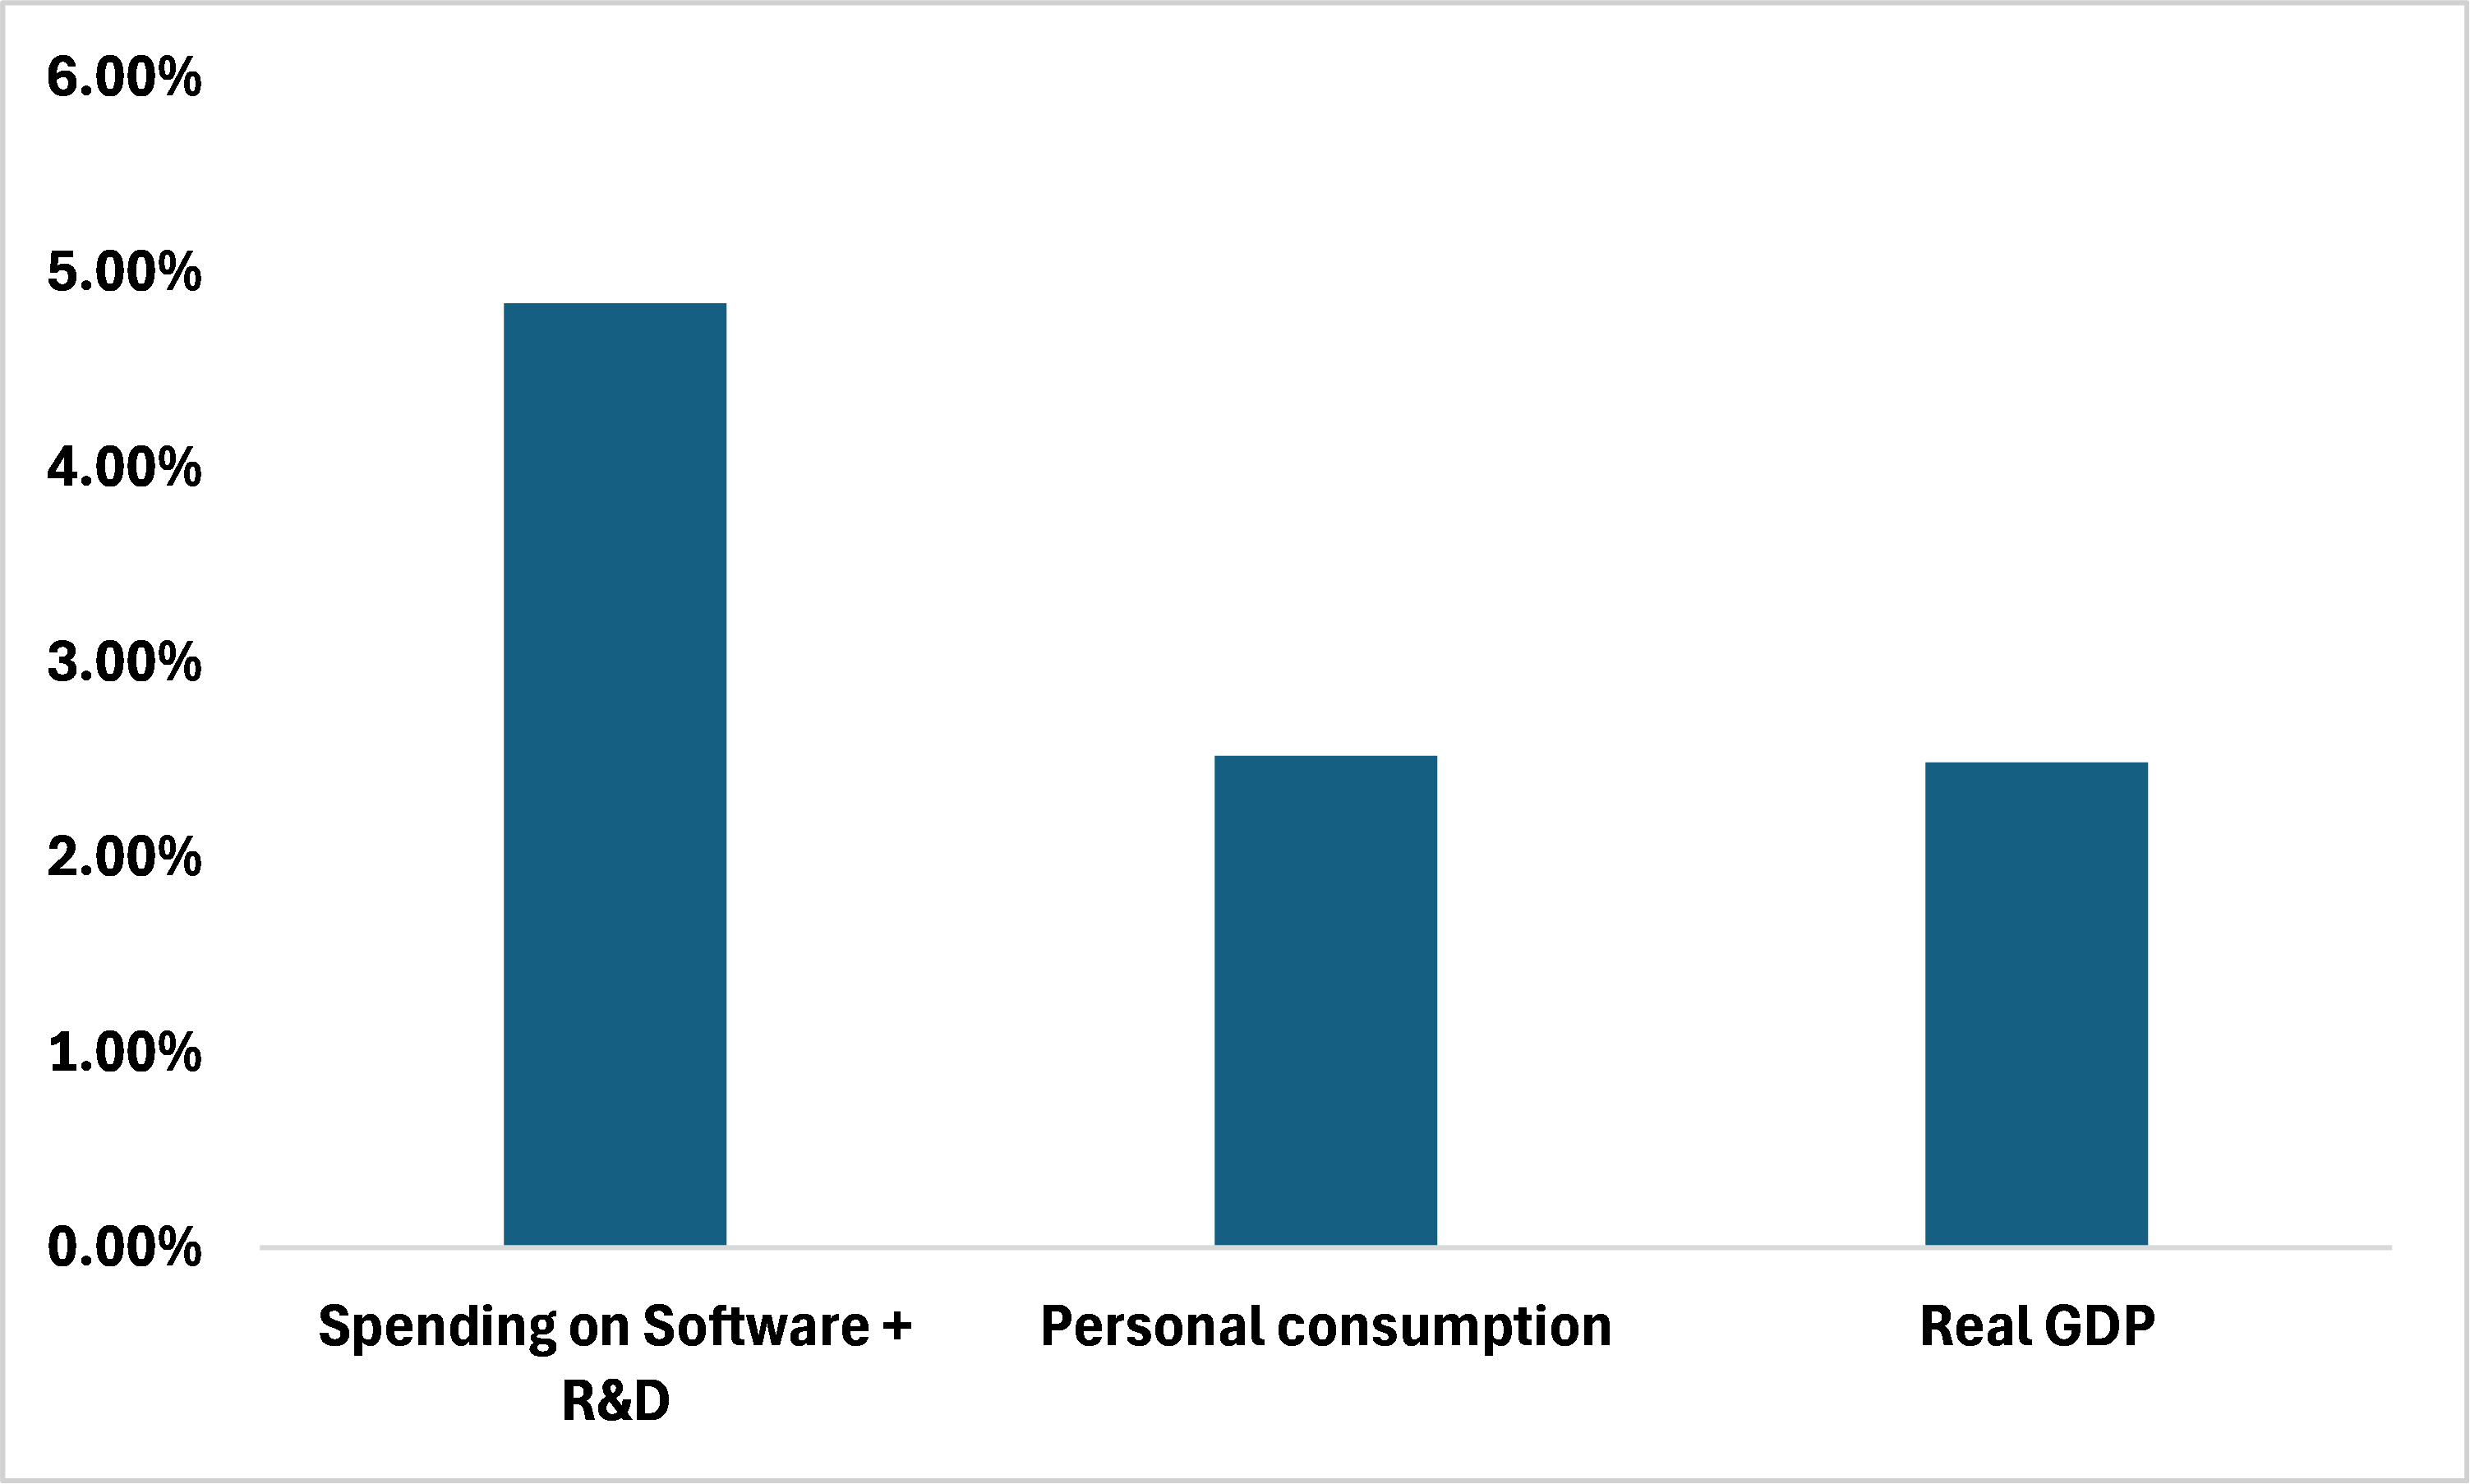
Source: BEA, BMO GAM
Chart 2 – Change in earnings expectations for 2025 since the start of the year
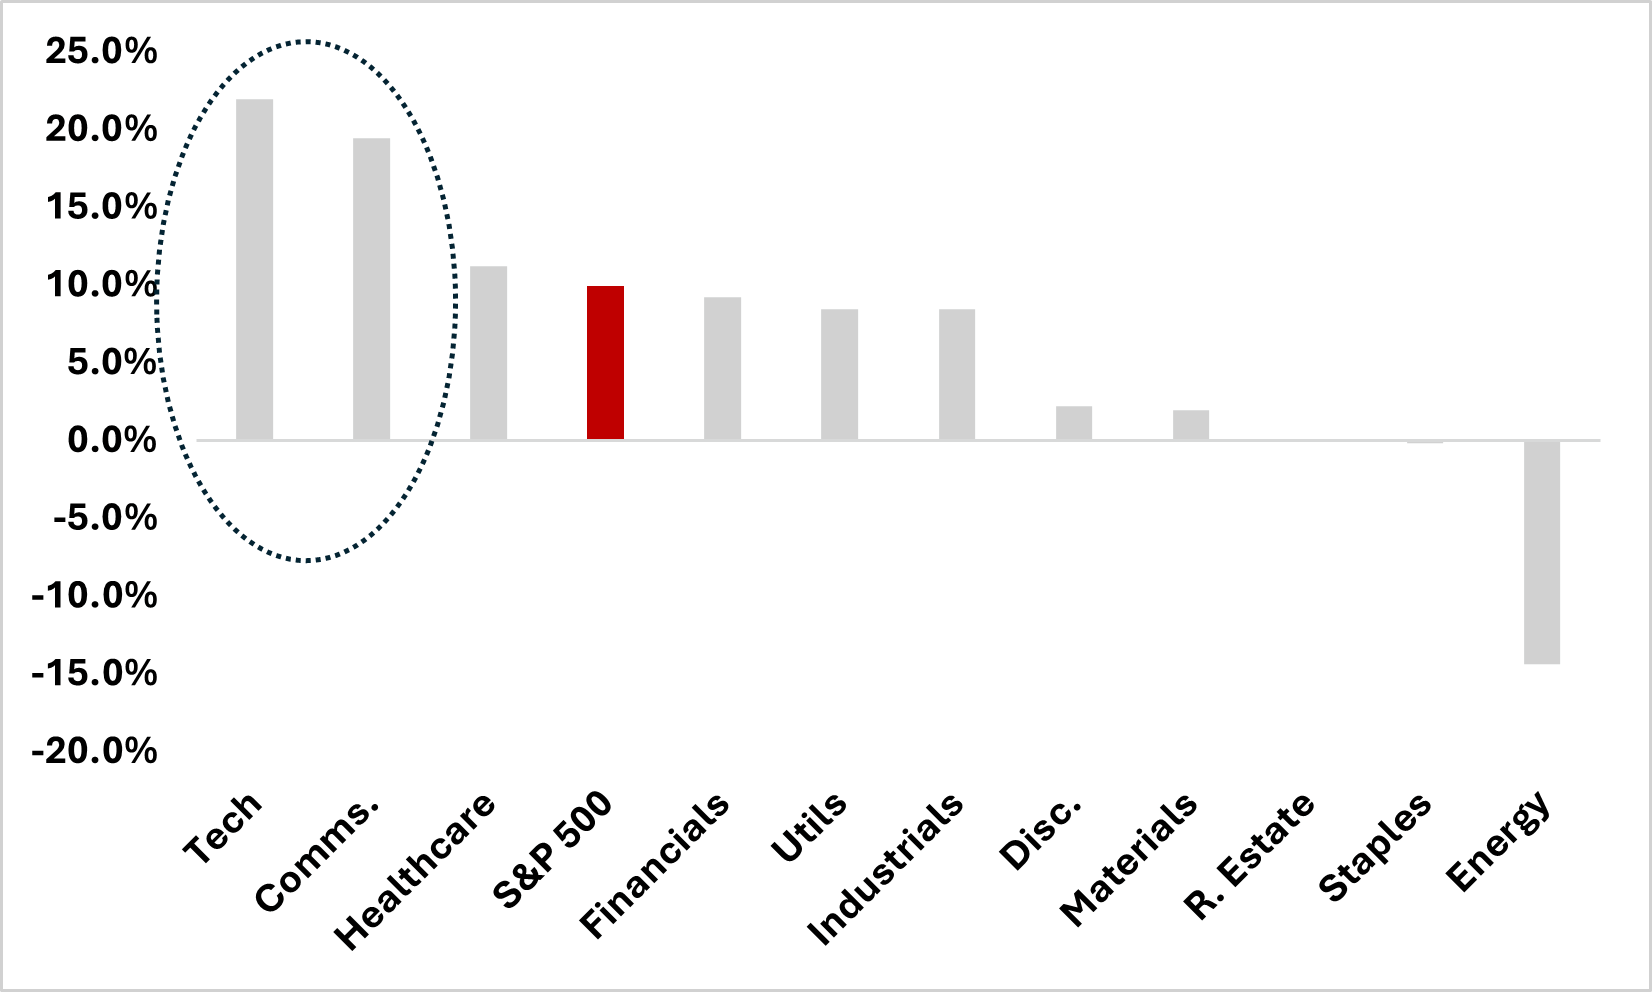
*As of August 5th, 2025
Source: Bloomberg, BMO GAM