Thoughts on US CPI + A Bit of Cyclical Analysis
February 12, 2025

Into the start: Things are relatively quiet ahead of the release of US CPI this morning.
One particular theme that is catching buzz is that Chinese markets are continuing to perform. That comes as markets take note of the rally in tech stocks there over the past month (see point 4 below).
1.) In the US
a.) US CPI is going to be front and center this morning. The street is anticipating a +0.3% m/m gain for both the headline and the core – thanks in part to constructive used car prices as well as still strong activity with household spending remaining robust as nominal wage growth is still above 4% y/y.
If there is a pain point for markets, it’ll be if the number surprises to the upside. That’s not least as the other side of the Fed’s mandate (employment) remains healthy – as indicated by Friday’s data.
A result above +0.3% m/m for the core gauge will likely see the USD bid, while rates come under pressure (yields higher).
b.) We didn’t much new from Chair Powell’s appearance in front of the Senate Banking Committee yesterday. One particular interesting item that isn’t related to policy is that mortgage accessibility in certain areas could become a serious issue in the years to come. That’s because insurers have been taking massive losses and cancelling policies across the country as natural disasters continue to intensify.
Without home insurance – mortgage lenders won’t lend to prospective buyers. That could become an issue for home prices in the US and have knock-on effects further out.
c.) NY Fed President Williams says that while monetary policy is still restrictive, “it’s where it needs to be right now”.
Our take: Slowly, the focus is shifting to how long current restrictive settings need to be in place for. That could portend to trouble for markets.
2.) In the UK: One of the country’s more respected think tanks projects that the Bank of England doesn’t have much room to ease rates further this year (after last week’s 25bps cut).
That’s largely because the inflation profile looks sticky – with CPI set to track near 3.7% y/y later this year before gradually shifting to the 2% BoE target in late-2027.
Our take: Two things to take note of here…
- Close to ten years later, we can more easily see why Brexit was such a massive mistake. The UK is experiencing a much more prolonged economic shock (inflation) largely because it untethered itself from its most important trade relationship.
- Higher rates for longer means greater risks for domestic risk assets.
Within our funds, the largest exposure to the UK are in ZWP, ZWEN, and ZEQ.
3.) Other EU Notes
With the rise in natural gas prices, the European Commission is reportedly considering price caps as part of discussions in the coming weeks. This comes as the spread between Euro-area (+13% year-to-date) and US gas prices (-4% year-to-date) continues to widen due to weather issues.
Our take: What’s to stop producers from shifting supply to less regulated regions over the long-term? A hard cap compounds the supply problem over the long-term.
A ‘dynamic’ price cap would work marginally better.
4.) Asia-Pacific Notes:
In China: Chinese tech stocks are now up 20% over the past month – really since the DeepSeek news hit.
In Japan: The 10-year JGB yield continues to make fresh highs. The current yield is now 133.8bps – which is the highest its been in 15 years.
Our take: Again, one of the more critical risks for US assets this year will be if foreign portfolio flows migrate to other regions.
A continued rise in risk assets outside of North America would cascade that (as currently seen in China). Additionally, a rise in domestic yields in Japan means US assets could become sensitive to repatriation.
5.) Cyclical Analysis: According to the OECD’s suite of leading indicators – our preferred gauge for cyclical analysis (see Chart 1) - the current phase of expansion in the US economy has lasted 22 months. For comparison, Table 1 gives you a sense of how long these types of period can last. Indeed, we can see from the Table that the current period might not indicate that expansion is ‘long in the tooth’, but we also feel that context matters here.
For instance, we don’t think a comparison between the current cycle and a few of the other ones makes sense. The 2020-2021 expansion was all about unwinding the effects of COVID lockdowns and a response to fiscal/monetary stimulus. The 2009-2011 and 2011-2014 cycles were due to loose monetary policy, as the Fed embarked on a series of extraordinary measures (QE, operation twist) following the financial crisis.
Despite how unique the current cycle is in certain ways (above trend growth, with loose fiscal and tight monetary policy), we feel the more appropriate comparison points are with the 2016-2018 and 2005-2007 expansionary phases. After all, both correspond with monetary policy tightening (the Fed hiked policy rates throughout them) which is in-keeping with the current phase. If we’re right, then this current expansion is nearing maturation.
In the coming quarters, we should start to see a transition in the economic from expansion to slowdown. The way to trade this is to rotate away from sector winners so far this year (communications, financials) and into more defensive sectors (especially healthcare and staples). When paired with current valuations, health care feels like a sector that should continue to perform.
Long ZXLV (BMO SPDR Health Care Select Sector Index ETF) is where its at.
Chart 1 – OECD Leading Indicator vs US GDP Over Time
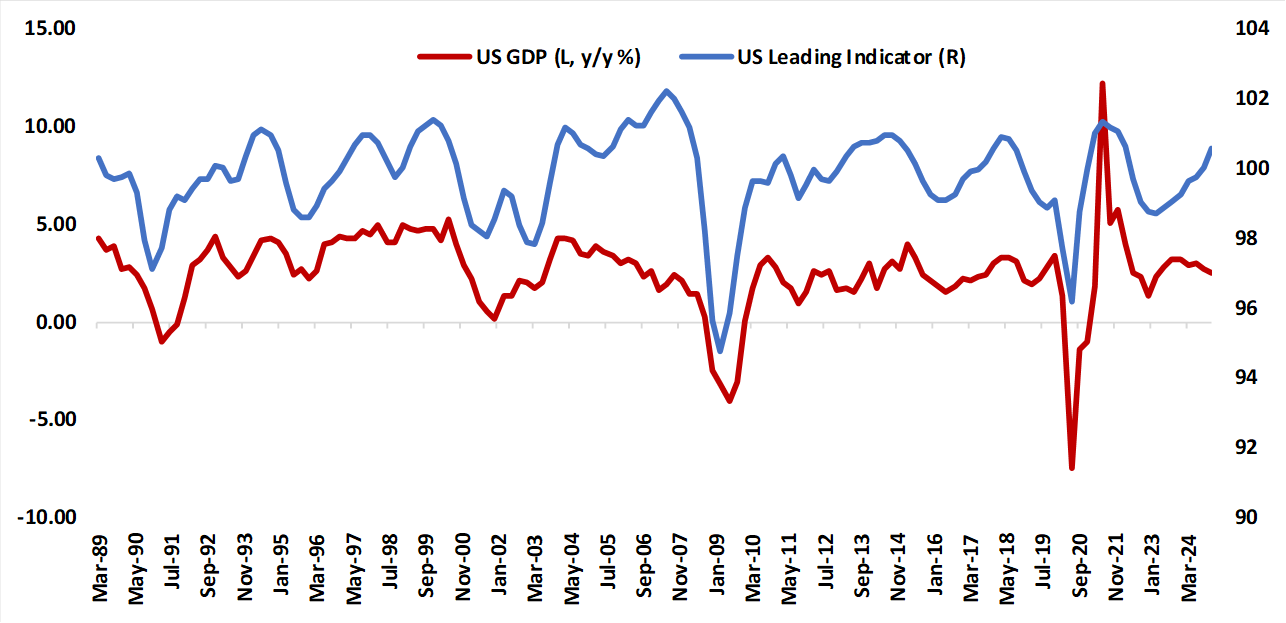
Table 1 – How Long Did Prior Expansionary Cycles Last?
| Expansion Period | Duration |
|---|---|
| Current expansion (March 2023 - ) | 22 months |
| April 2020 - June 2021 | 14 months |
| March 2016 - May 2018 | 26 months |
| September 2011 - September 2014 | 36 months |
| February 2009 - March 2011 | 25 months |
| April 2005 - July 2007 | 27 months |
Source: BMO GAM
6.) Data/Events to Watch for:
Wed Feb 12
- US: CPI (Jan), Fed’s Waller speaks
- Canada: BoC Summary of Deliberations is released
Thurs Feb 13
- US: Initial claims, PPI (Jan)
- UK: Q4 GDP (prelim)
Fri Feb 14
- US: Retail sales (Jan), Industrial production (Jan)
- Eurozone: Q4 GDP (prelim)
7.) Central Bank Expectations (Market Implied)
| Central Bank | Current Policy Target (%) | Current Effective Rate (%) | Next Meeting | What’s Priced in for Next Meeting (bps) | Expected Terminal (%) |
|---|---|---|---|---|---|
| BoC | 3.00 | 3.02 | 3/13/2025 | -14.5 | 2.48 |
| Fed | 4.38 | 4.33 | 3/19/2025 | 0.0 | 3.91 |
| BoE | 4.50 | 4.45 | 3/20/2025 | -4.6 | 3.78 |
| ECB | 2.75 | 2.67 | 3/12/2025 | -24.5 | 1.88 |
| BoJ | 0.50 | 0.48 | 3/21/2025 | 0.6 | 1.05 |
| RBA | 4.35 | 4.34 | 2/19/2025 | -20.9 | 3.57 |
| RBNZ | 4.25 | 4.25 | 2/20/2025 | -48.5 | 3.08 |
Source: BMO GAM
8.) Our current portfolio holdings
Table 1 – Our Balanced Portfolio for Q1
| Ticker | ETF Name | Sector Positioning | Price | Weight (%) | ||
|---|---|---|---|---|---|---|
| Fixed Income | ||||||
| ZDB | BMO Discount Bond Index ETF | Fixed Income | Core | $14.83 | 0.09% | 10.0% |
| ZBI | BMO Canadian Bank Income ETF | Fixed Income | Core | $30.23 | 0.25% | 15.0% |
| ZCM | BMO Mid Corporate Bond Index ETF | Fixed Income | Tactical | $15.30 | 0.30% | 5.0% |
| ZTL | BMO Long-Term US Treasury Bond Index ETF | Fixed Income | Tactical | $37.13 | 0.20% | 5.0% |
| Total Fixed Income | 35.0% | |||||
| Equities | ||||||
| ZUQ | BMO MSCI USA High Quality Index ETF | Equity | Core | $87.88 | 0.30% | 8.00% |
| ZUQ/F | BMO MSCI USA High Quality Index ETF - Hedged Units | Equity | Core | $51.68 | 0.30% | 7.00% |
| ZLB | BMO Low Volatility Canadian Equity ETF | Equity | Core | $46.20 | 0.35% | 5.00% |
| ZWS | BMO US High Dividend Covered Call - Hedged to CAD ETF | Equity | Tactical | $20.17 | 0.65% | 5.00% |
| ZWK | BMO Covered Call US Banks ETF | Equity | Tactical | $25.24 | 0.65% | 10.00% |
| ZWEN | BMO Covered Call Energy ETF | Equity | Tactical | $30.04 | 0.65% | 5.00% |
| Total Equity | 40.0% | |||||
| Non-Traditional Hybrids | ||||||
| ZLSU | BMO Long Short US Equity ETF | Hybrid | Tactical | $41.36 | 0.65% | 10.00% |
| ZJAN | BMO US Equity Buffer Hedged to CAD ETF - January | Hybrid | Tactical | $32.64 | 0.65% | 5.00% |
| ZGLD | BMO Gold Bullion ETF | Hybrid | Tactical | $41.36 | 0.20% | 10.00% |
| Total Alternatives | 25.00% |
Table 2 – Our Income Portfolio for Q1
| Ticker | ETF Name | Weight | Duration | Weighted Avg YTM | Management Fee | Exposure | Positioning |
|---|---|---|---|---|---|---|---|
| ZDB | BMO Discount Bond Index ETF | 25.0% | 7.25 | 3.47% | 0.09% | Canada | Core |
| ZPR | BMO Laddered Preferred Share Index ETF | 20.0% | 3.05 | 6.65% | 0.45% | Canada | Core |
| ZBI | BMO Canadian Bank Income Index ETF | 25.0% | 2.17 | 4.18% | 0.25% | Canada | Core |
| ZTL | BMO Long-Term US Treasury Bond Index ETF | 15.0% | 16.33 | 4.87% | 0.20% | United States | Non-Traditional |
| ZPS | BMO Short Provincial Bond Index ETF | 15.0% | 2.91 | 3.08% | 0.25% | Canada | Non-Traditional |
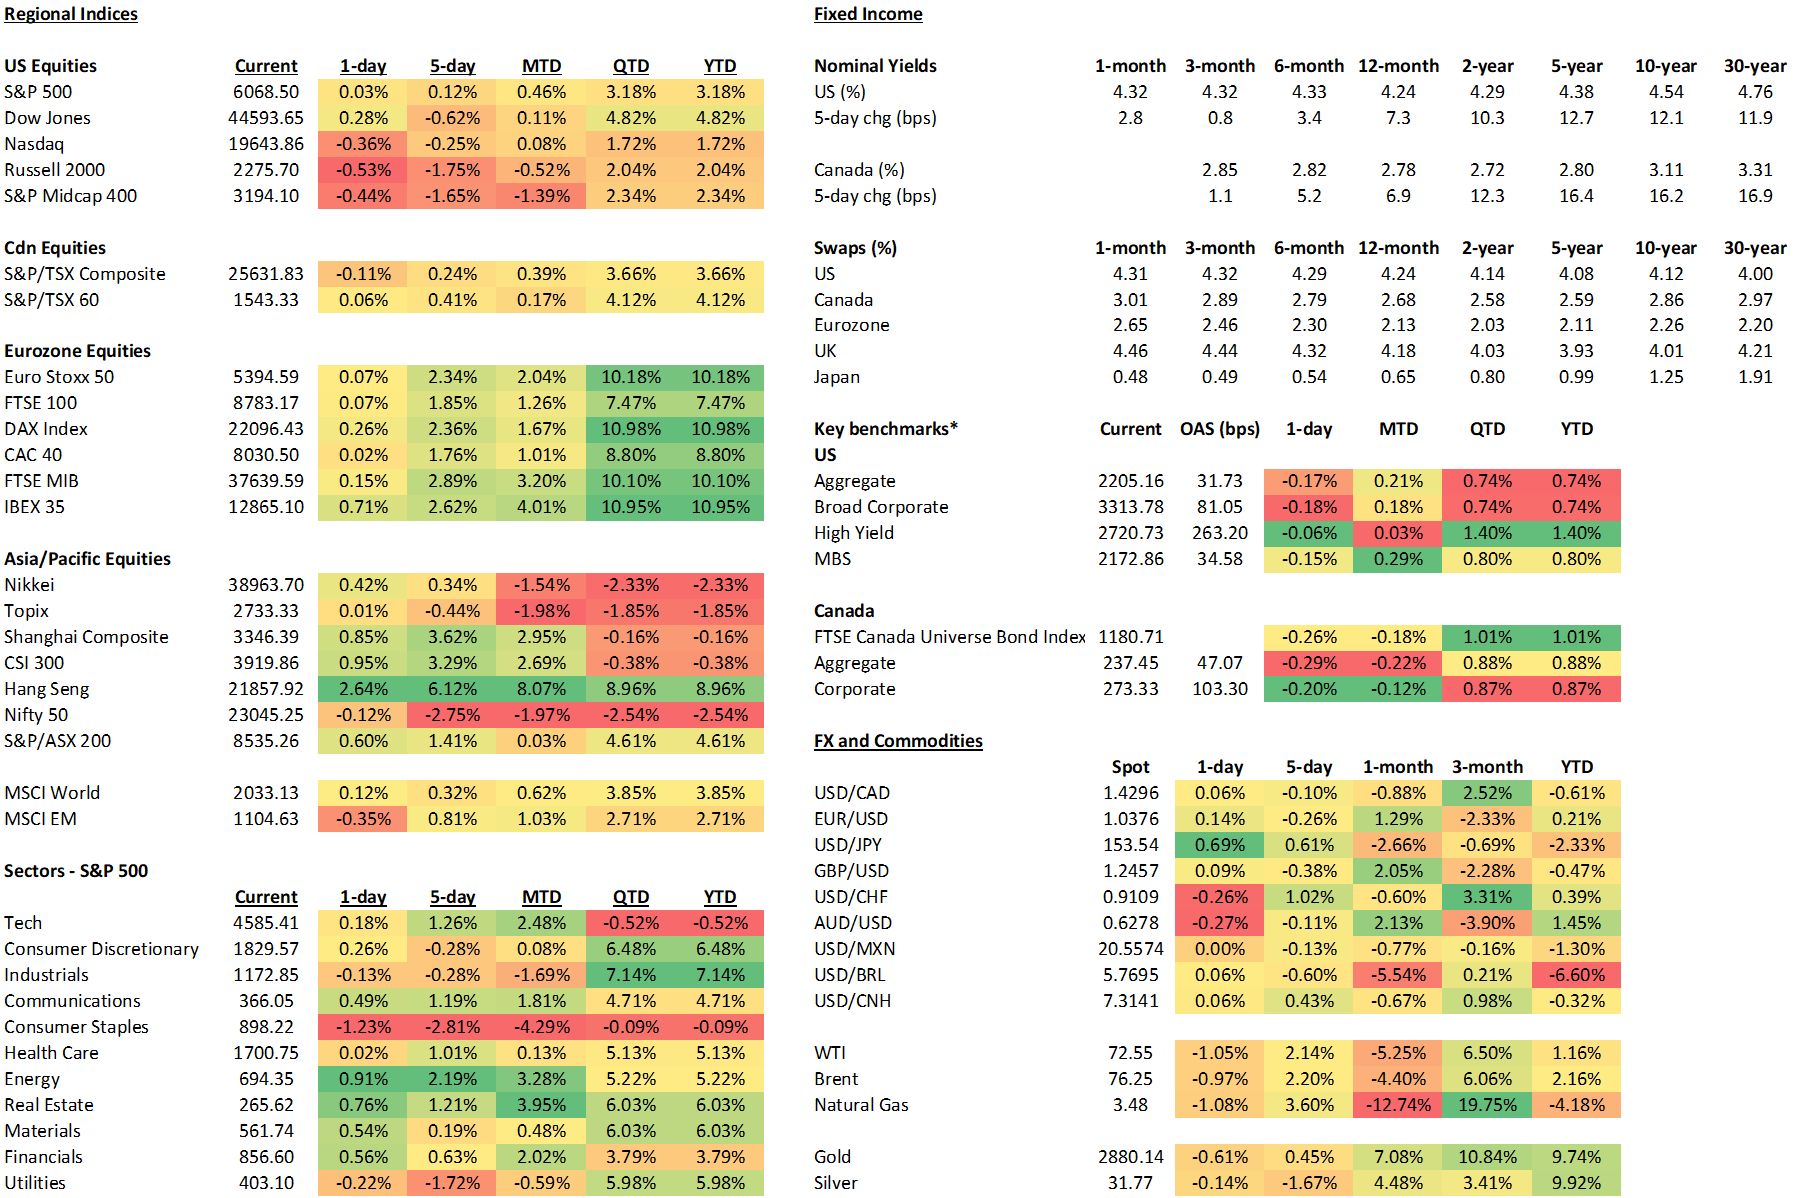
9.) Markets