Trimming the Extremes of Trade Policy
May 12, 2025
- Initial thoughts on the US/China agreement
- Key questions after the US/UK “trade deal”
- A quick summary of year-to-date BMO ETF flows
- Updated portfolio strategy
1.) Where are we in the trade conflict?
a.) Update on China talks: After hours of talks in Switzerland, both sides agree to slash tariff rates by 115% for 90 days. The US will apply an average tariff rate of 30% on Chinese goods imports, and China will apply an average tariff rate of 10%.
This comes after both Bessent and Greer say that “substantial progress” has been made to de-escalate the trade war between the US and China. Notably, both sides have agreed to establish a trade consultation mechanism.
Joint statement is expected at some point today with additional details.
Our take: Markets are rallying on the news – paced by gains in US equity futures. There is an element of surprise in the percentages, with most having expected an average US tariff rate on Chinese goods being anywhere from 50-80% as part of any accord.
However, this is really about the Trump team trimming the extremes of trade policy than an outright removal of trade barriers, so I’d expect this rally to have a short shelf life. True, this is a substantial “climbdown” from last month, but the offramp still leads the US economy to a worse exit point than where it was heading into the year.
b.) Key questions after the US/UK trade announcement: It’s been a few days and we haven’t had much time to put pen to paper on our thoughts on this. For those still interested in this largely symbolic announcement, you can find the details here, and here.
Does this establish a template for additional “deals” between the US and other countries? Probably not.
For goods, the UK is the US’ eighth largest goods trading partner, and one of the few countries that the US actually runs a trading surplus against. Both countries are mostly net debtors to the rest of the world.
In short, it’s much easier for the UK to accept a 10% baseline tariff in exchange for concessions in a few sectors given that trade between the two countries isn’t as comprehensive. I couldn’t see Canada, the EU or China accepting something akin to this.
Are there any hints of the overarching US trade strategy? Yes.
The US is willing to give on tariffs on steel/aluminum – and to a degree on autos – in exchange for purchase agreements and increased market access for US exporters. I suspect the degree of flexibility will depend upon who the US is negotiating with.
Are tariffs just a negotiating tactic then? Yes and no.
Trump is showing that he willing to cut some tariffs, but not give up on them completely. The US is not removing the 10% tariff baseline while at the same time it’s keeping the reciprocal tariff at 10%. Remember that since the US runs a goods trade surplus with the UK, the latter only pays the 10% baseline tariff. That implies that countries that run a trade surplus with the US should expect the floor to be 20% (baseline + reciprocal).
To put it bluntly – tariffs are here to stay and “10% is new 0%”.
c.) If I could distill the message further it’s this – markets have rallied primarily because Trump has been trimming the extremes of his trade policy. Not because the next level of US economic prosperity has been unlocked.
Once the short-term excitement is over, this points to further consolidation and/or downside risks until the Fed starts easing rates. And so far, the data doesn’t suggest that they should be in a hurry to do so. Nor does the Fed believe it needs to (see point 3c).
2.) Canada Notes
a.) The employment report for April was soft (to say the least). Among the notable points:
- The headline gain of +7.4k on the month masked a much worse backdrop. Remember that the federal election was in full swing, which meant an addition of temporary federal workers (+37k for public admin on the month).
- The unemployment rate (now at 6.9%) matched the prior high from November.
Offsetting both of those points – total hours worked increased by +0.4%. The latter portends to a positive print for April GDP.
As of now, the base case should be another rate cut in June from the BoC (this is the last employment report before then). However, we still do have April CPI and Q1 GDP ahead of then.
b.) Despite the soft employment report, I’m becoming a bit more optimistic when it comes to the Canadian macro backdrop.
- The data released so far is closer to the BoC’s more benign scenario (as per the April MPR)
- Yes, tariffs have gone higher on Canadian exports to the US, but the average effective tariff rate on Canadian goods is actually lower than pretty much everywhere else.
- Fiscal stimulus is on its way.
I’ll have more to say on this in the days ahead. But slowly – I expect market sentiment on CAD assets to improve at the margin.
3.) US Notes
a.) Did we learn much from the data released last week? Well, we have yet to see employment data respond in the way it needs to get the Fed moving on rate cuts.
But still, it was not lost on us that Q1 labor productivity came in negative for the first time since Summer 2022. At the same time, output for durables production also dropped while unit labor costs remained high.
It’s one quarter of course, so we won’t be caught making the mistake of extrapolation. But it is entirely possible that we’re getting to a point where compensation is too high relative to productivity in the US economy (see Chart 1 below). One item to watch in upcoming surveys is whether hours worked starts to dwindle – that is usually a sign that employers are likely to start paring jobs.
Chart 1 – US Nonfarm Labor Costs are Running Above Productivity
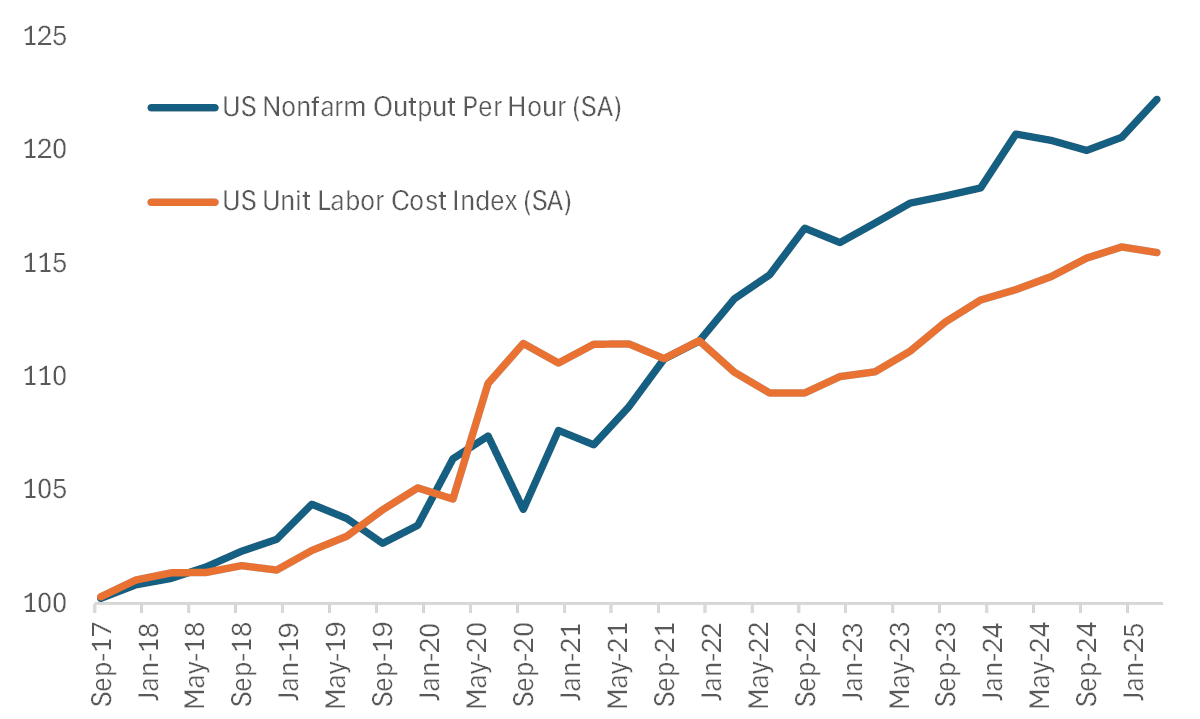
Source: BLS
b.) As the focus shifts towards tax cuts in the US – keep an eye on stories like this one.
To summarize, Congressional Republicans are struggling to find $1.5trln in spending cuts to fund Trump’s tax cut legislation (which includes new promises on top of rolling over the 2017 cuts) – so Trump is proposing a “tiny” tax hike on wealthy Americans. That could potentially mean allowing the 2017 cuts to expire for those earning at least $2.5mln per annum (or $5mln for couples).
This is important because it amplifies legislative risk – in that it could split House GOP members.
Even if it doesn’t happen, markets will be attuned to how exactly Trump’s tax agenda will be funded.
c.) In case you’re wondering how to calibrate the Federal Reserve going forward – I’ll repost the main takeaway from last week.
The path to rate cuts still hinge on a deterioration in the labour sector. And recent data (ADP and claims) imply there are some yellow flags – enough to maintain some degree of support for a rate cut as soon as July/September. My own feel is that September is more likely of the two.
However, the risk is that either inflation expectations become untethered from the Fed’s 2% goal (implying that the Fed will need to keep rates elevated for longer), or that the labor data remains strong enough to obviate the need for cuts. Both are bearish risks for equities on their own.
4.) Portfolio Strategy
a.) Chart 2 shows the year-to-date gross inflows and outflows by our own ETF roadmap category. A few interesting observations to make here
- First, the large amount of flows to the ultra-short category tells us that clients have been prioritizing liquidity amidst the heavy degree of macroeconomic volatility.
- Second, flows into corporate bond ETFs are surprising until we note that most of this has been in short corporates (or ZCS).
- Third, we’ve seen a pick-up in interest for global and emerging market equity tracking funds.
- Finally, investors have exited overweight positions in funds that track US equities.
To us, the flow out of ultra short-term funds is a risk to watch for.
Further stabilization of the broader macro backdrop implies that this can be deployed further out the risk spectrum. Markets have rallied primarily because Trump is trimming the extremes of his trade policy – but we’d caution against buying into further rallies based on “trade deals” like the US/UK agreement.
As for where those flow go? We suspect it’ll be recycled into the EAFE space – not least as markets become more tuned into the reality that while Trump may be moderating a bit on tariffs, they won’t be going away completely. It is this point that we expect to support the EAFE > US even more in the period ahead.
Chart 2 – Largest YTD Flows into BMO ETFs (by Roadmap Category)
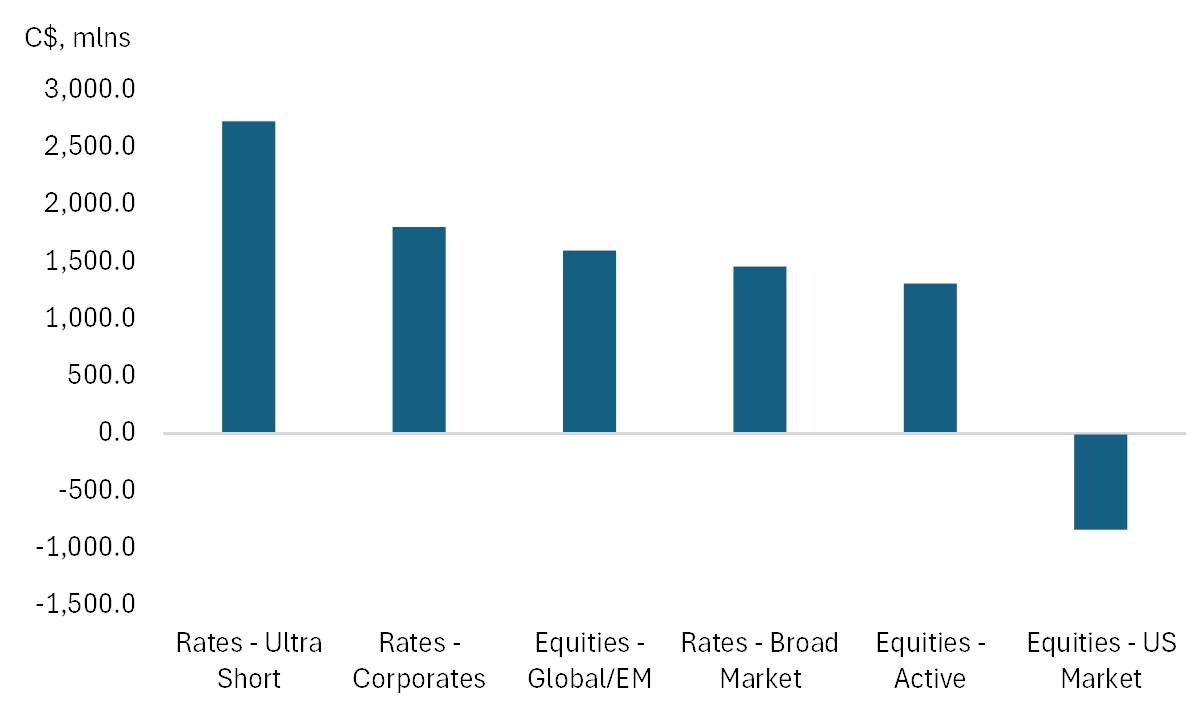
*As of May 9, 2025
Source: BMO GAM
b.) Other funds and strategies that we continue to like…
- Industrials (as a sector). Our own ZIN has performed fairly well over the past few weeks and we suspect this is due to expectations of fiscal stimulus here in Canada. It still feels like this theme has more room to run.
- Utilities (covered call). ZUT provides decent yield and some shelter from trade-related risks given its exposure to Canadian and US names.
- Gold + miners. This is a clarion call for ZGLD, and ZJG more than anything.
- EAFE > US (as a theme). Both Germany and Japan have outperformed the US so far this quarter. We see little reason to fade this momentum.