Weekly Basis Points - Following the Money Market
September 22, 2025
- Now that the Fed is easing again, the question is what will happen to the massive amount of money that is held in money market accounts.
- Yield sensitive investors may seek to move into dividend-oriented equity strategies or products, but that also equates to a move up the risk spectrum.
- There is a case to be made that some flow might end up in the front-end (2y-5y) of the UST curve, but we suspect that part of the curve is still vulnerable going forward.
- For now, we expect those flows to remain ‘sticky’ – which favours outperformance of the ultra-short end of the curve. We are adding ZUCM to our tactical portfolio.
As of September 17th, the Investment Company Institute (or ICI) estimates that there is US$7.28trln parked in American money market funds. That is twice the number that were held in such funds at the end of 2019 (US$3.6trln).
The “doubling” in flow is the result of two primary drivers. First, it is likely that a decent portion of the Covid stimulus checks that went out to US households found their way into savings and investment accounts that held short-term, liquid assets – including money market shares. Second (and more importantly), the Federal Reserve ended up raising short-term policy rates to their highest level in a generation. That meant that the liquidity and capital preservation appeal of money market funds was also augmented by higher yields. Those yields were above 5% for much of 2023 and 2024 – two of the highest years on record for inward flow.
Chart 1 – Total US Money Market Assets and the Fed Funds Rate
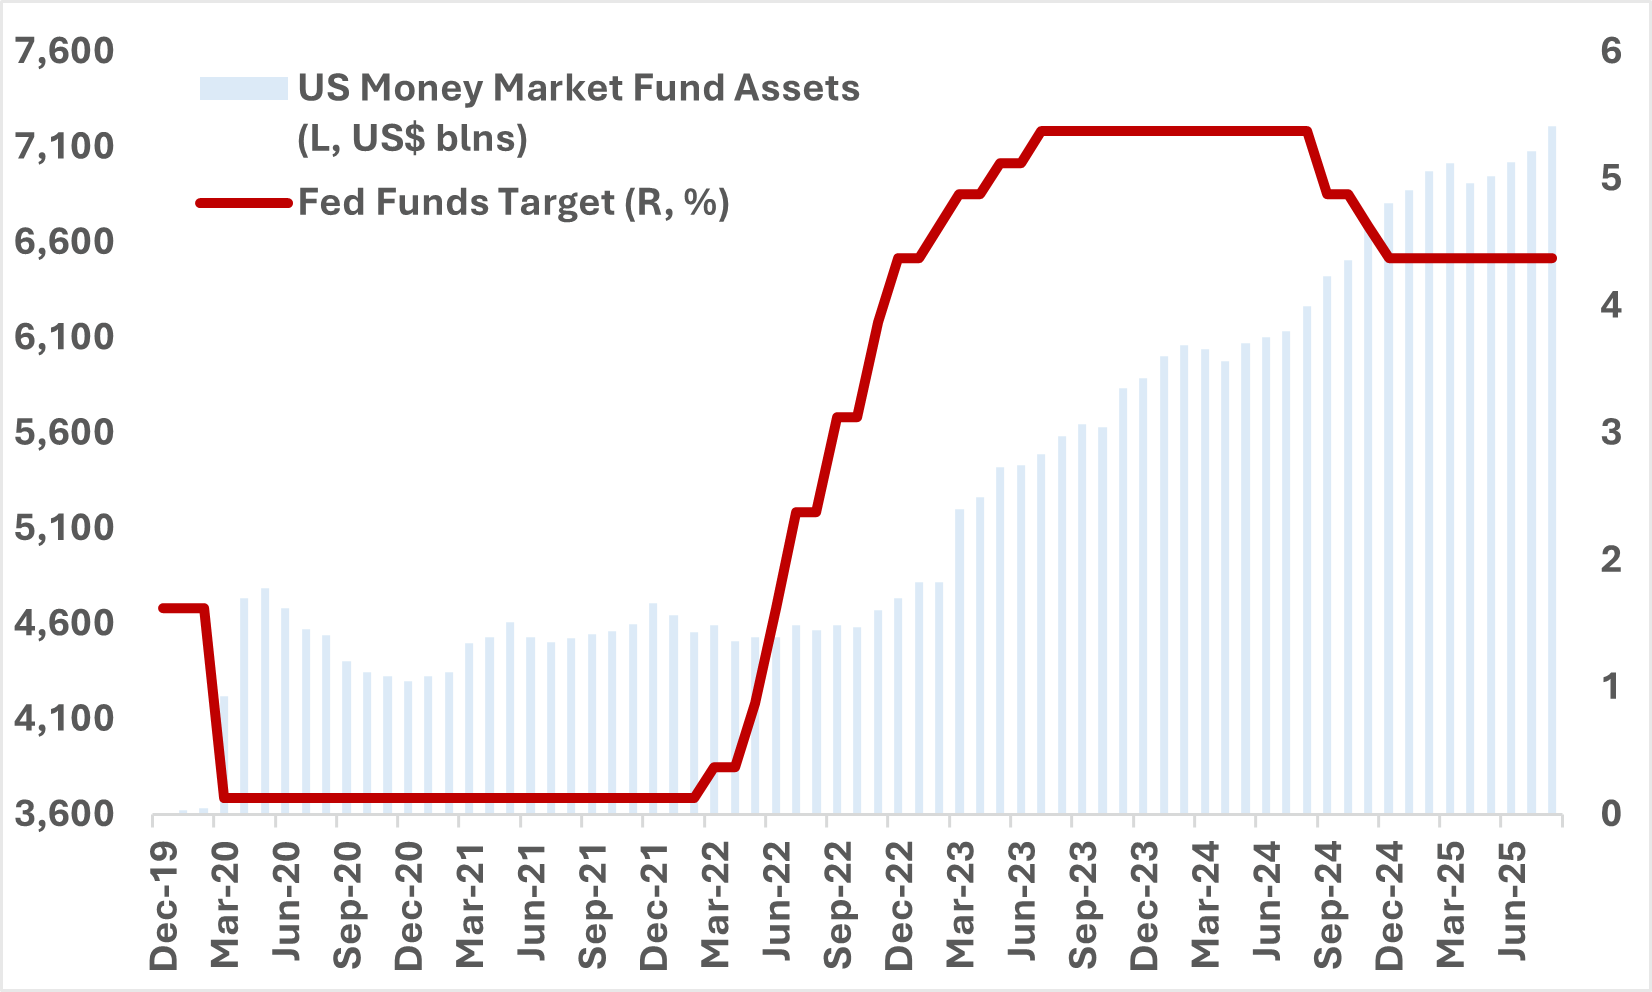
But with the FOMC re-starting its easing cycle, markets are now pricing in a terminal rate that is just below 3.00% in the next year. If the market is right, that will also mean lower yields for the ultra-short end and that money market funds will be reinvesting proceeds at lower rates. In theory, that should imply that yield-sensitive investors will look elsewhere and that inflows into money market funds may slow from here.
Where that marginal dollar will flow is the key. We understand there may be temptation to assume that dividend-focused equities should benefit but that also means a shift up in the risk spectrum for a lot of conservative investors. There is also a potential case to be made for a shift of that flow into the front-end of the US curve (2y-5y) which would mean an increase in duration risk for investors. However, there are two problems that we have with that view:
- First, the 3m/5y part of the UST curve is still inverted. Generally, this part of the curve should steepen as the Fed eases rates further from here (Chart 2) – which means that T-bill yields drop by more and funds that track those should outperform relative to those that track the 2y-5y part of the UST curve.
- Second, as mentioned above, the market is already pricing the Fed to reach its terminal rate by the end of next year. That tilts the risk towards higher coupon yields from here given the still strong US fundamental backdrop.
Chart 2 – The US 3m/5y Curve Will Usually Steepen When the Fed Eases
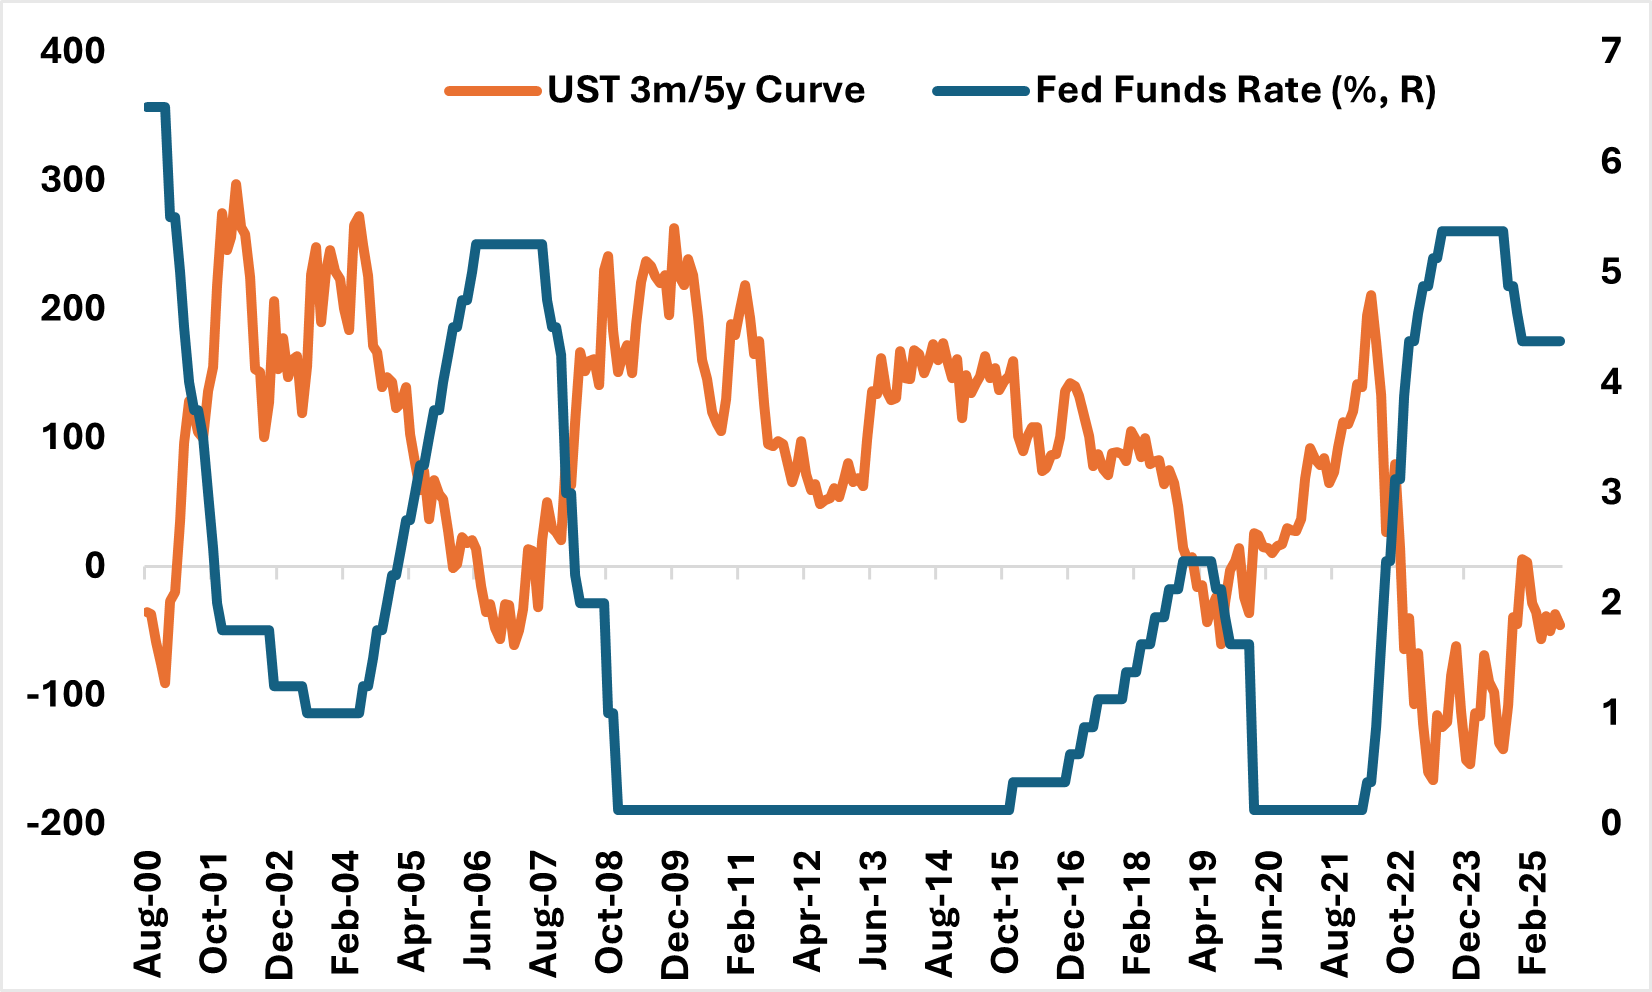
Source: Bloomberg, BMO GAM
Both of those points tell us that the 2y-5y part of the curve is still more vulnerable to the fundamentals relative to T-bills. As such, we don’t see a compelling case to be made for flows to migrate from money market funds to that part of the curve just yet. This could change if incoming US data tells us that the situation in the labor sector is worse than originally thought and that markets have to reprice Fed funds terminal lower. But we don’t think we’re there at this point.
Which leads us back to our question – where will that money flow if not towards money market assets? Unfortunately, there isn’t a clear answer to that just yet. Instead, it may still make sense for money market flows to remain sticky until there is a clearer sense of whether the markets need to reprice US fundamentals. Until then, we see a more compelling case for funds that track Ultra-shorts to outperform. And to be sure, we’ve added an allocation to ZUCM (BMO USD Cash Management ETF) to our tactical portfolio for that reason.
Tactical Positioning
New
- ZUCM (BMO USD Cash Management ETF)
Existing
- ZUQ (BMO MSCI USA High Quality Index ETF)
- ZGLD (BMO Gold Bullion ETF)
- ZWGD (BMO Covered Call Spread Gold Bullion ETF)
- ZWT (BMO Covered Call Technology ETF)
- ZAAA (BMO AAA CLO ETF)
Portfolio Strategy
After last week’s FOMC, US equities rallied to close out the week while rates backed up only modestly. There has been some enthusiasm for small caps, but as we wrote a few weeks ago, we think that enthusiasm is still premature given the restrictive nature of policy settings.
As ever, where we go from here will depend largely on incoming data. In the US, the week is marked with mostly second-tier data until the release of PCE on Friday. In particular, we’ll be eyeing the release of durables and capital goods orders for signs of a meaningful bounce given the recent turn in business sentiment. That should serve as a quick pulse check on where we are in the economic cycle as well.
In Canada, BoC Governor Macklem is speaking on Tuesday ahead of the release of monthly GDP on Friday. Given the proximity to last week, we don’t see much in the way of market moving potential from Macklem during his appearance this week.
For strategy, the only notable change from last week is that we’re only ‘slightly’ bearish fixed income. This better reflects the view that political risks in the US may continue to distort markets. As mentioned in the lead article this week, we feel that ETFs that track T-bills are still the best way to play Fed rate cuts in the here and now.
Asset Class |
View |
Notes |
Equities |
Slightly bullish |
|
Fixed Income |
Slightly bearish |
|
Alternatives |
Bullish |
|
FX |
Slightly bearish USD/CAD |
|