Weekly Basis Points - What Could Break the AI Trade
August 10, 2026
Summary points:
- We remain slightly bullish on U.S. equities, as strong earnings growth and a resilient economy continue to support markets. However, AI-related leverage has become an increasingly important risk worth monitoring.
- The biggest AI risk is not hyperscalers, but neoclouds such as CoreWeave. These firms use debt to finance expensive GPU purchases and rely on long-term compute commitments from frontier labs. If AI labs slow spending or reduce capacity commitments, neocloud balance sheets and upstream AI suppliers could face pressure.
- For now, the key indicators remain positive. CoreWeave’s debt-to-revenue-backlog ratio remains manageable, while OpenAI and Anthropic continue to show rapid user and revenue growth. This suggests AI demand is still absorbing infrastructure investment, supporting the view that the current AI buildout reflects commercial adoption rather than speculative excess.
As a shop, we remain slightly bullish on US equities from here. After all, the incredible growth in earnings and the still supportive economic backdrop (labor sector concerns aside, personal consumption and business spending remain very strong) imply that US stocks should remain supported. But the word “slightly” is doing some heavy lifting here – and it’s important to understand why.
For instance, a client of ours had an interesting question last week. Beyond geopolitics and the Fed, is there something else that investors should be watching as potential risks to equities going forward? That got us thinking.
Given AI’s growing importance to the macro outlook, that would be the first place to look. The easy answer there would be the sheer volume of bond issuance from the hyperscalers (Meta, Alphabet, Amazon and Microsoft) for data center construction. However, the scale of that issuance isn’t concerning at this point given the still robust balance sheets, diversified revenue streams, and the relatively low level of corporate indebtedness in the US. Also, all of the hyperscalers are involved in the distribution layer of AI – where margins should remain durable.
Instead, our concerns in the AI space come from two other sources. The first is with another group of firms in the ‘infrastructure layer’ – the neoclouds. Like hyperscalers, these firms are cloud providers built to rent GPUs for AI. But unlike hyperscalers (which provide many different services), neoclouds are mostly specialized on developing compute infrastructures and are much less diversified when it comes to revenue streams.
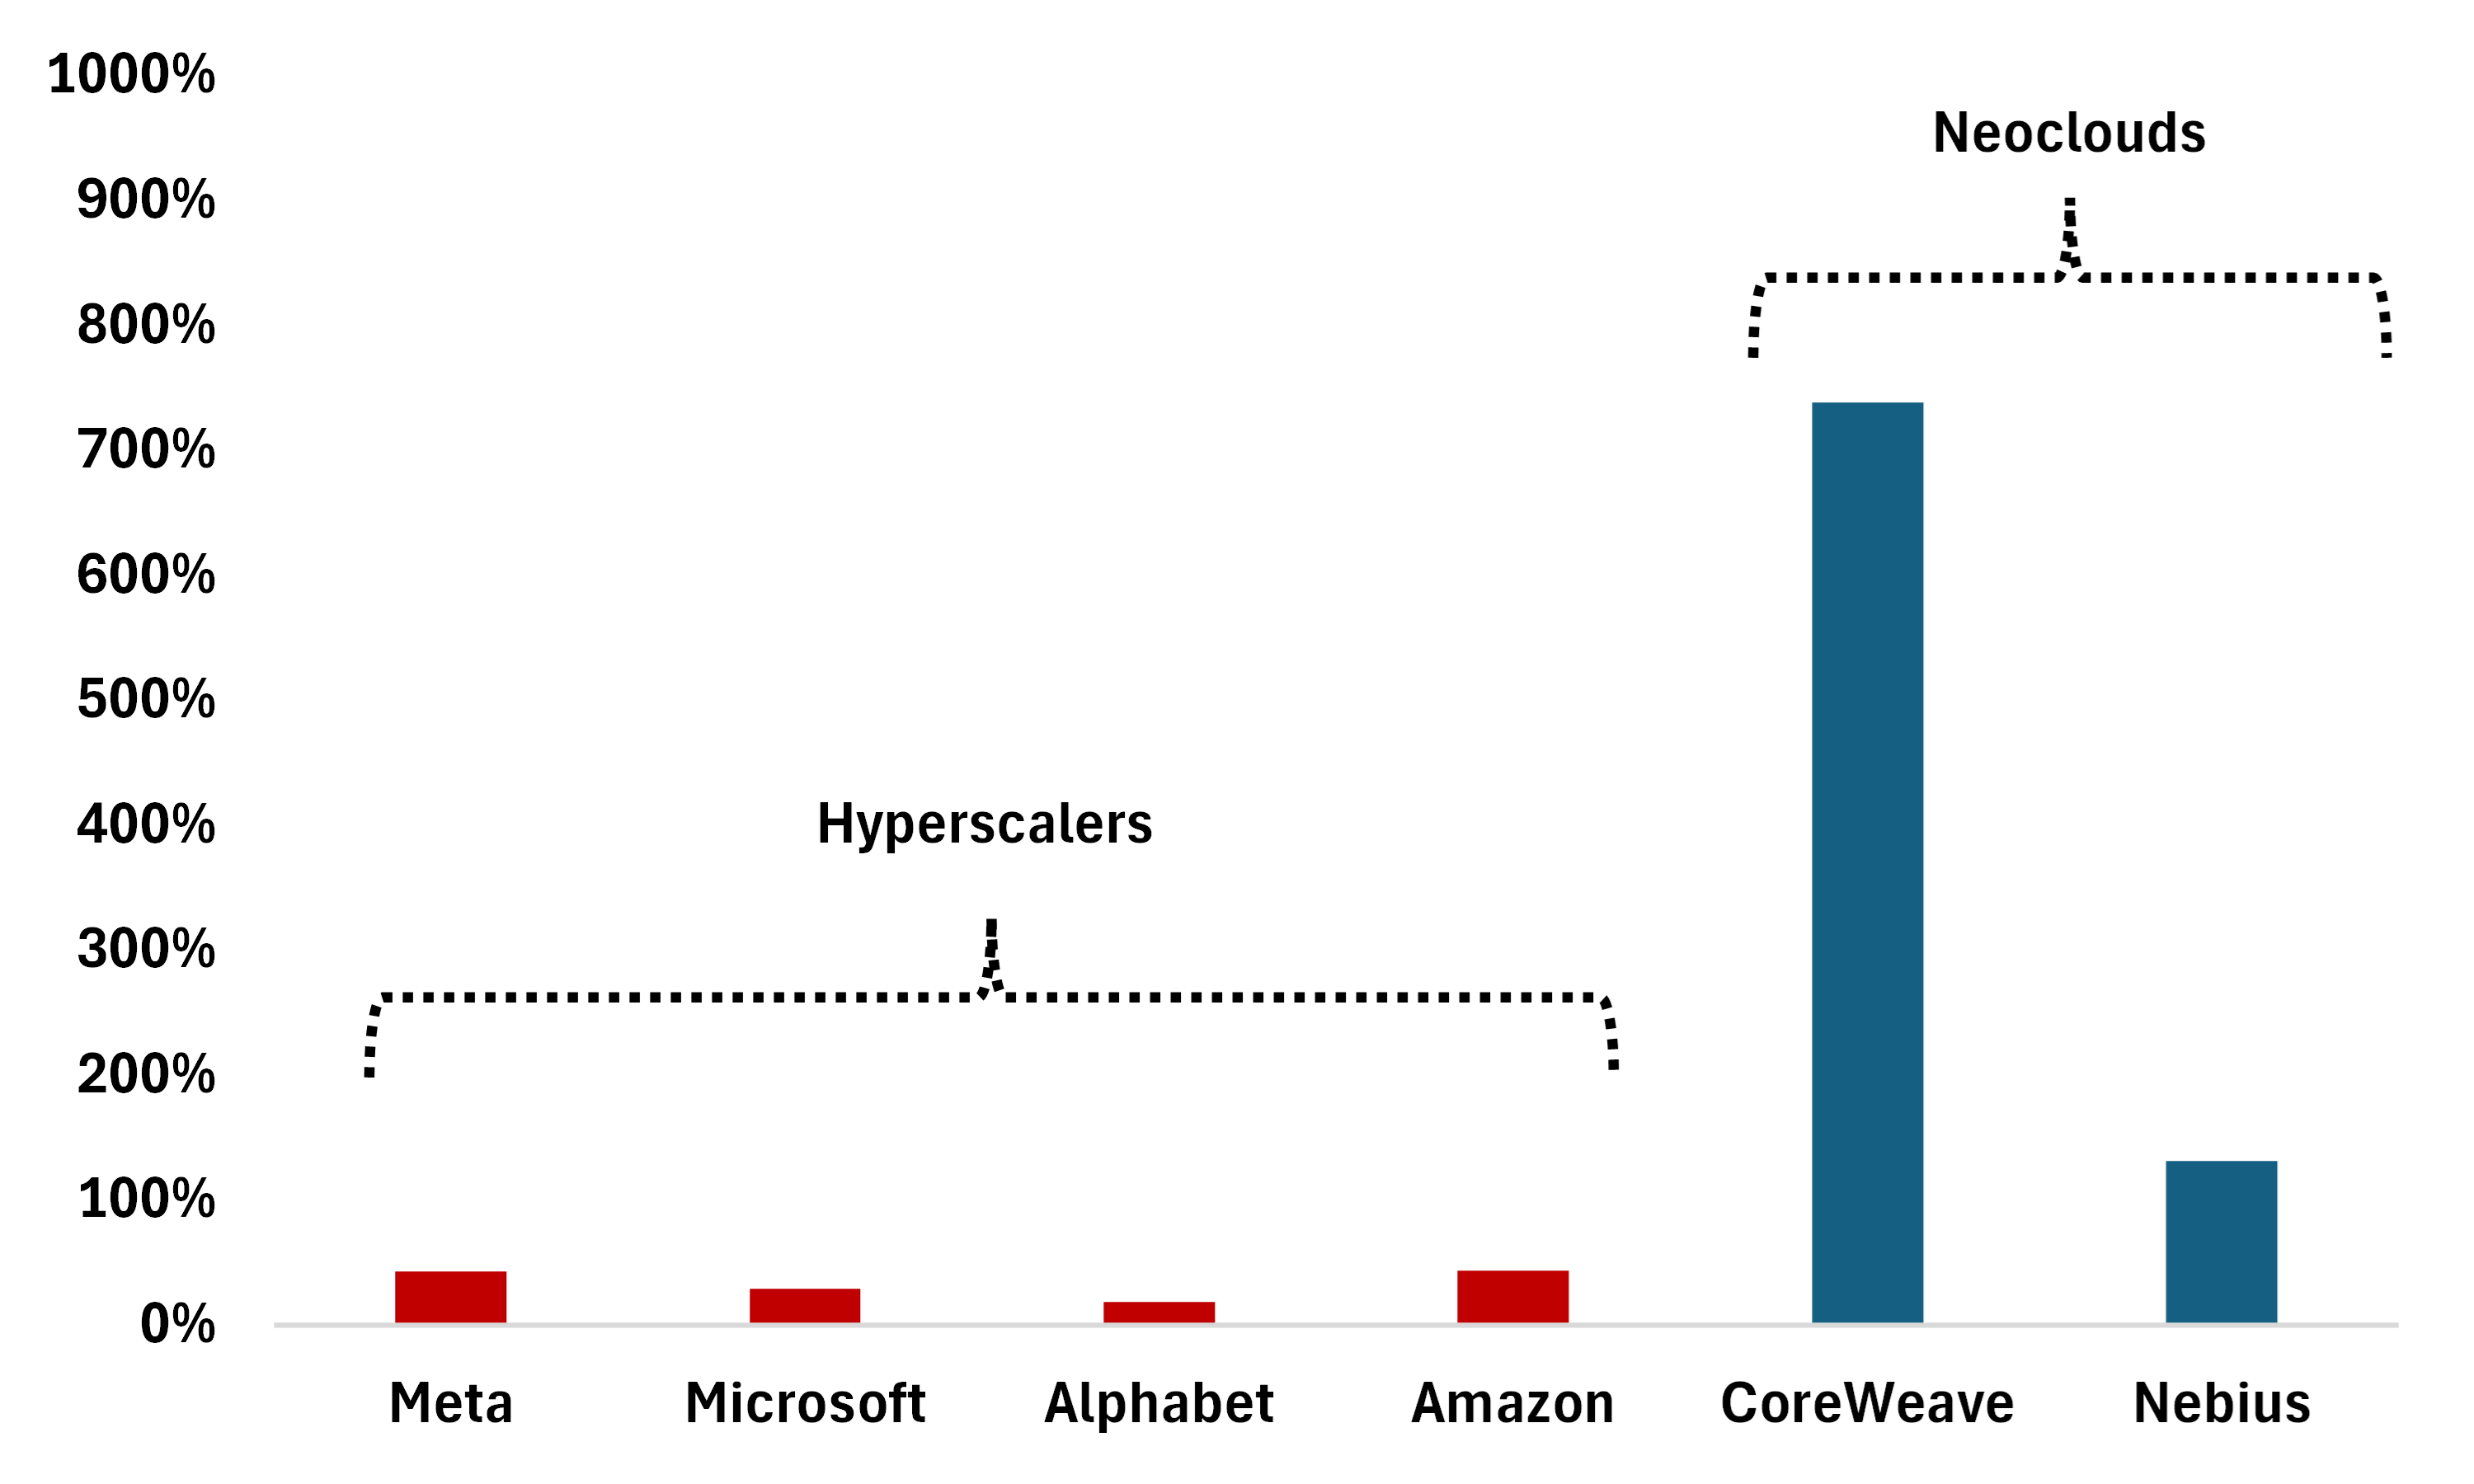
But in this environment, being specialized to this degree brings vulnerabilities. For instance, GPUs are incredibly expensive and neoclouds are more indebted relative to the multifaceted hyperscalers (Chart 1). The debt raised to finance GPU purchases is often supported by long-term take-or-pay agreements under which frontier labs reserve compute capacity in advance. In this financing arrangement, neocloud firms use these contracted payments to service debt – and if frontier labs reduce GPU demand, delay deployments, or fail to renew contracts, then neoclouds bear the balance sheet risk. That would also imply less demand for “upstream” AI activities as well – such as chip and HBM manufacturing.
Chart 1 – Gross Debt-to-Equity: Hyperscalers vs Neoclouds
Source: Bloomberg
That brings us to our second source of concern, the stability of revenue streams for frontier labs. The risk of commodification has grown thanks in large part to cheaper Chinese open weight models. If model providers are forced to compete primarily on price rather than capability, revenue growth could slow materially, reducing their willingness to commit to large-scale compute contracts. At the same time, increased token efficiency ultimately means that revenues for labs will decline unless total AI demand picks up.
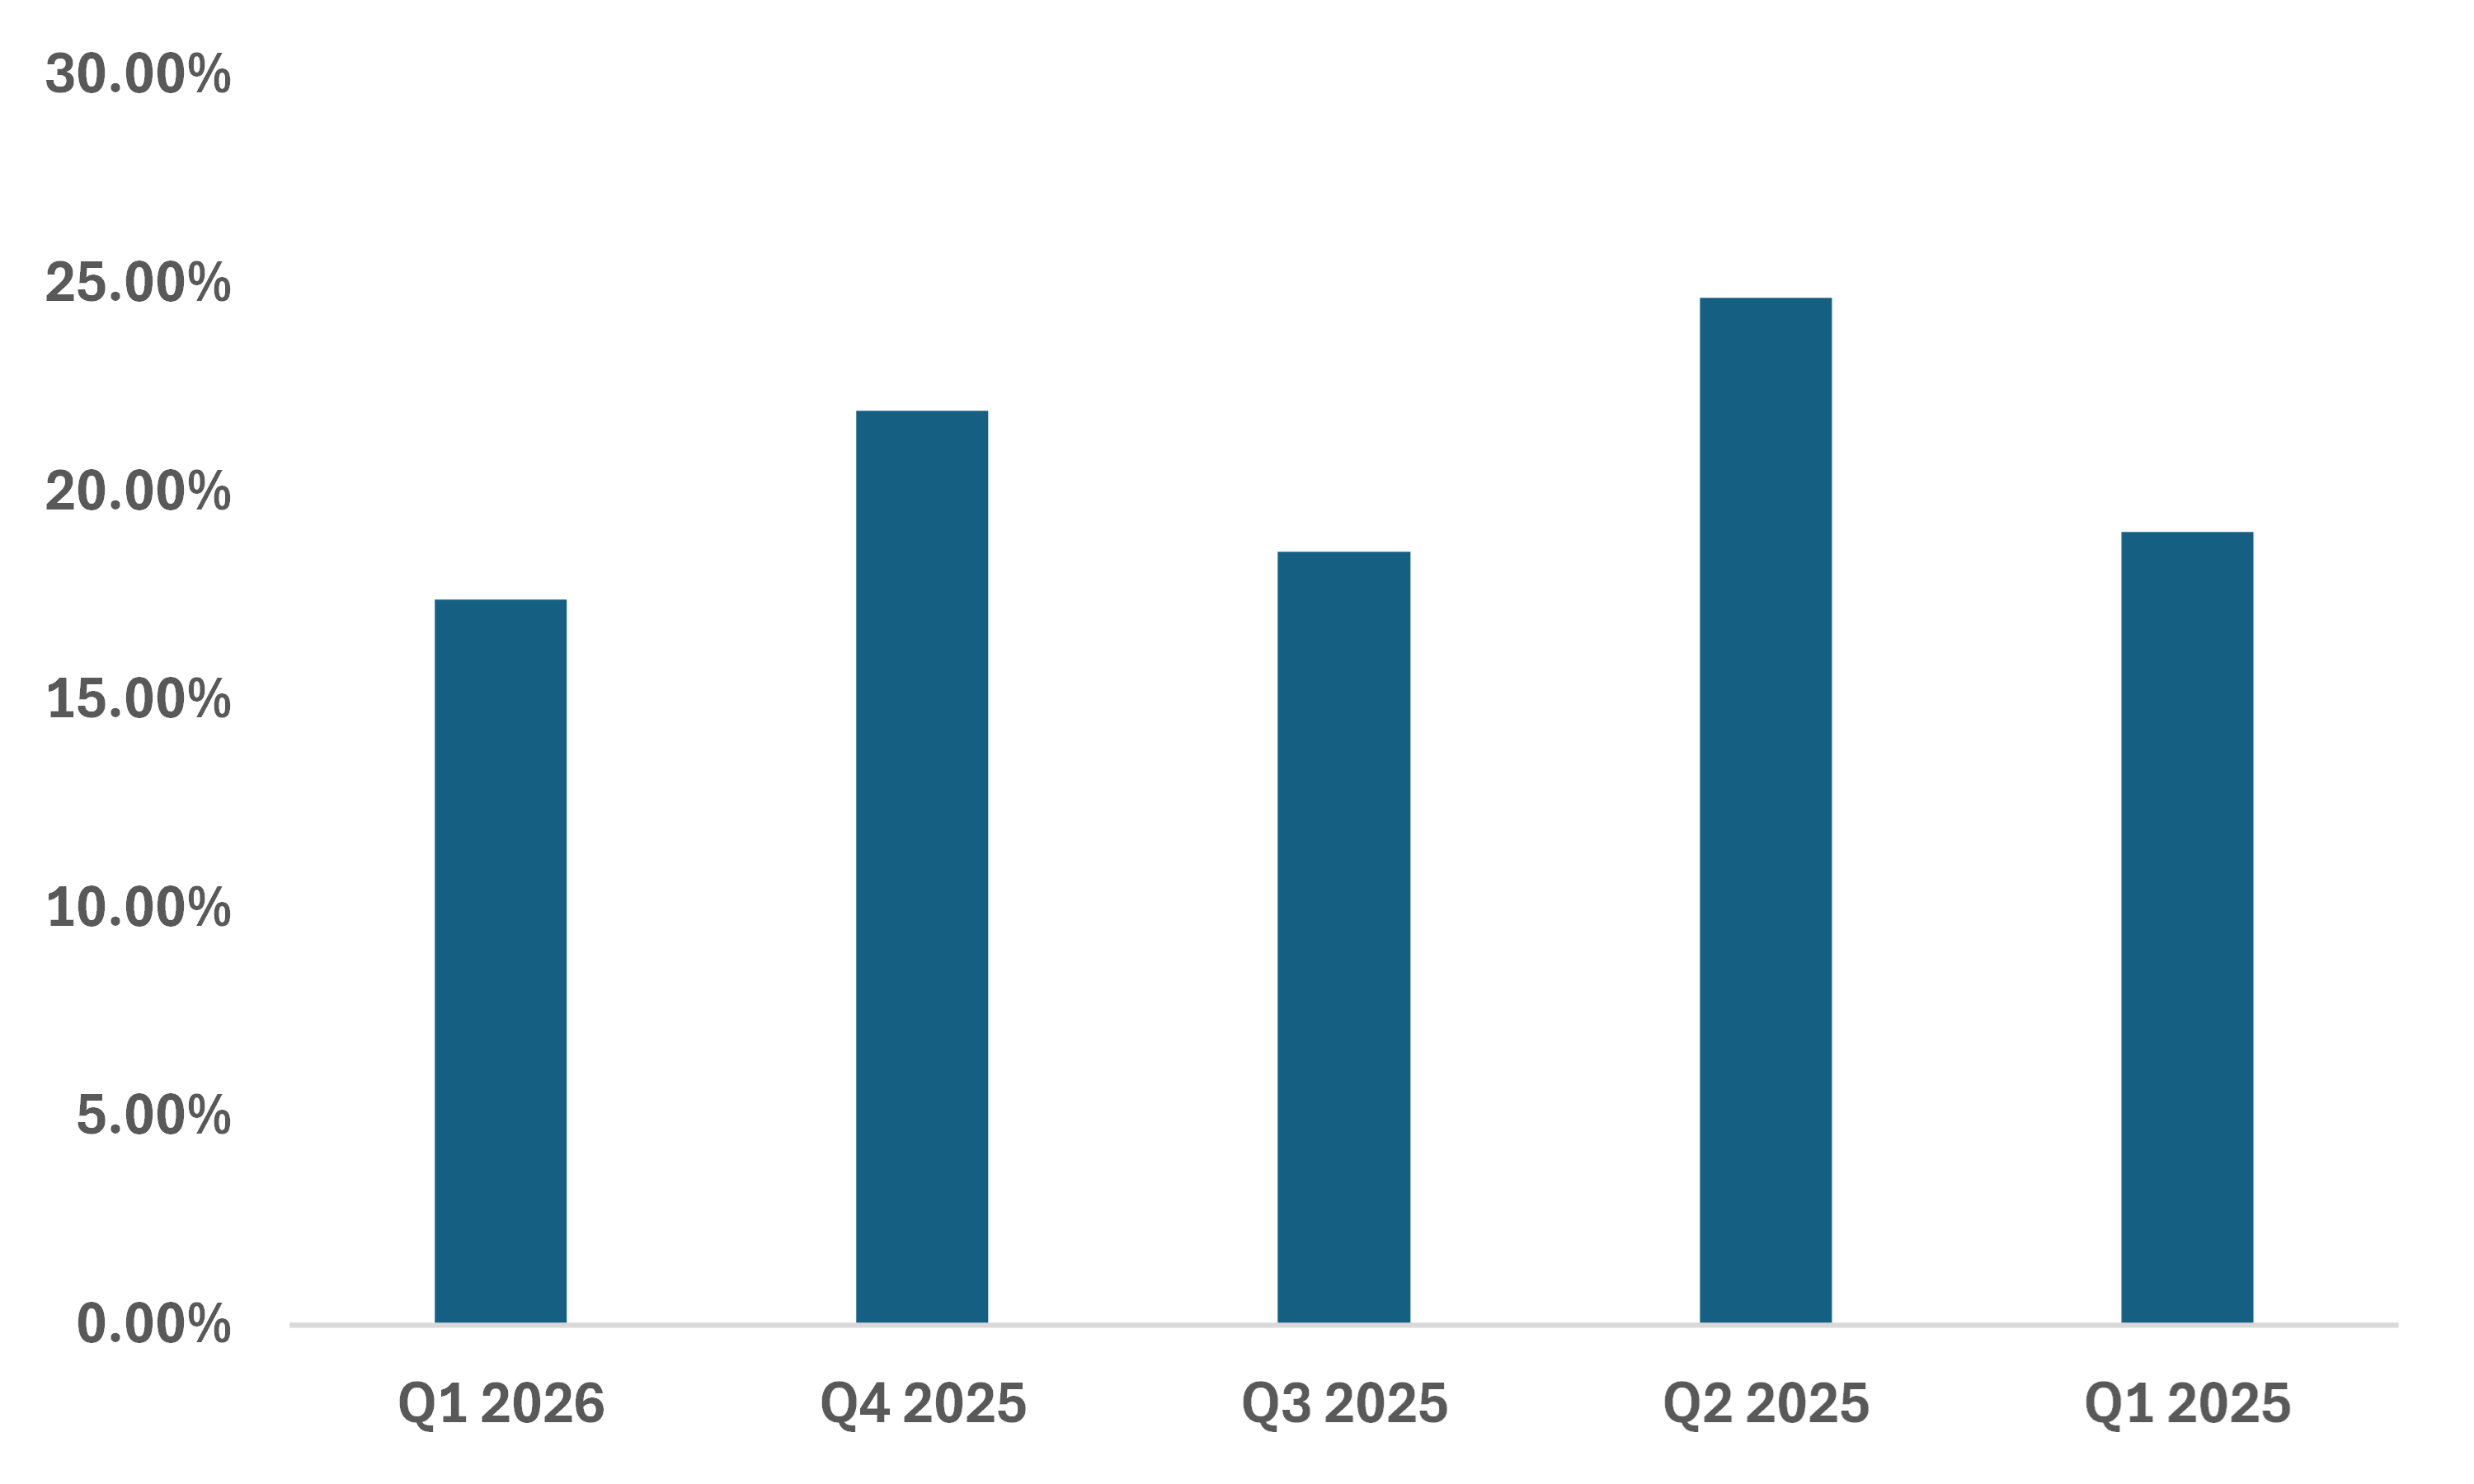
Both risks are worth staying on top of, and we’ll be keeping an eye on two important metrics going forward: the growth of net-debt to revenue backlog (for neoclouds) and the growth rate of AI usage relative to efficiency improvements (for frontier labs). For the former, Chart 2 shows that gross debt to revenue backlog has stayed within the 16-25% range for one of the larger neocloud firms (CoreWeave) – which seems manageable for now. For the latter, OpenAI’s weekly active users are said to have reached 1 billion this month while Anthropic’s annualized revenue run rate has increased by over 400% in the period between December 2025 and May 2026. Both of these imply that demand continues to grow faster than infrastructure investment, supporting the view that the current buildout in AI is being absorbed by real commercial usage.
All told, the key AI risk indicators remain supportive. Demand continues to outpace infrastructure expansion, suggesting that the current investment cycle is being absorbed by commercial adoption rather than speculative excess. Nevertheless, we’re staying cautious and “slightly” bullish given the scale of leverage growth.
Chart 2 – CoreWeave: Gross Debt/Revenue Backlog is Fine for Now
Source: Bloomberg
Macro Regime Call
Current macro regime: Reflation – stronger than expected growth + stickier inflation pressure
Policy regime: Neutral/Hawkish (Monetary) and Neutral/Dovish (Fiscal)
Market regime: Cautiously bullish
Risks to call:
- Demand for AI slows considerably.
- Geopolitics lead to another commodity shock.
- Inflation pressures deepen.
Please see ‘Portfolio Strategy’ section below for more.
Portfolio Strategy for This Week
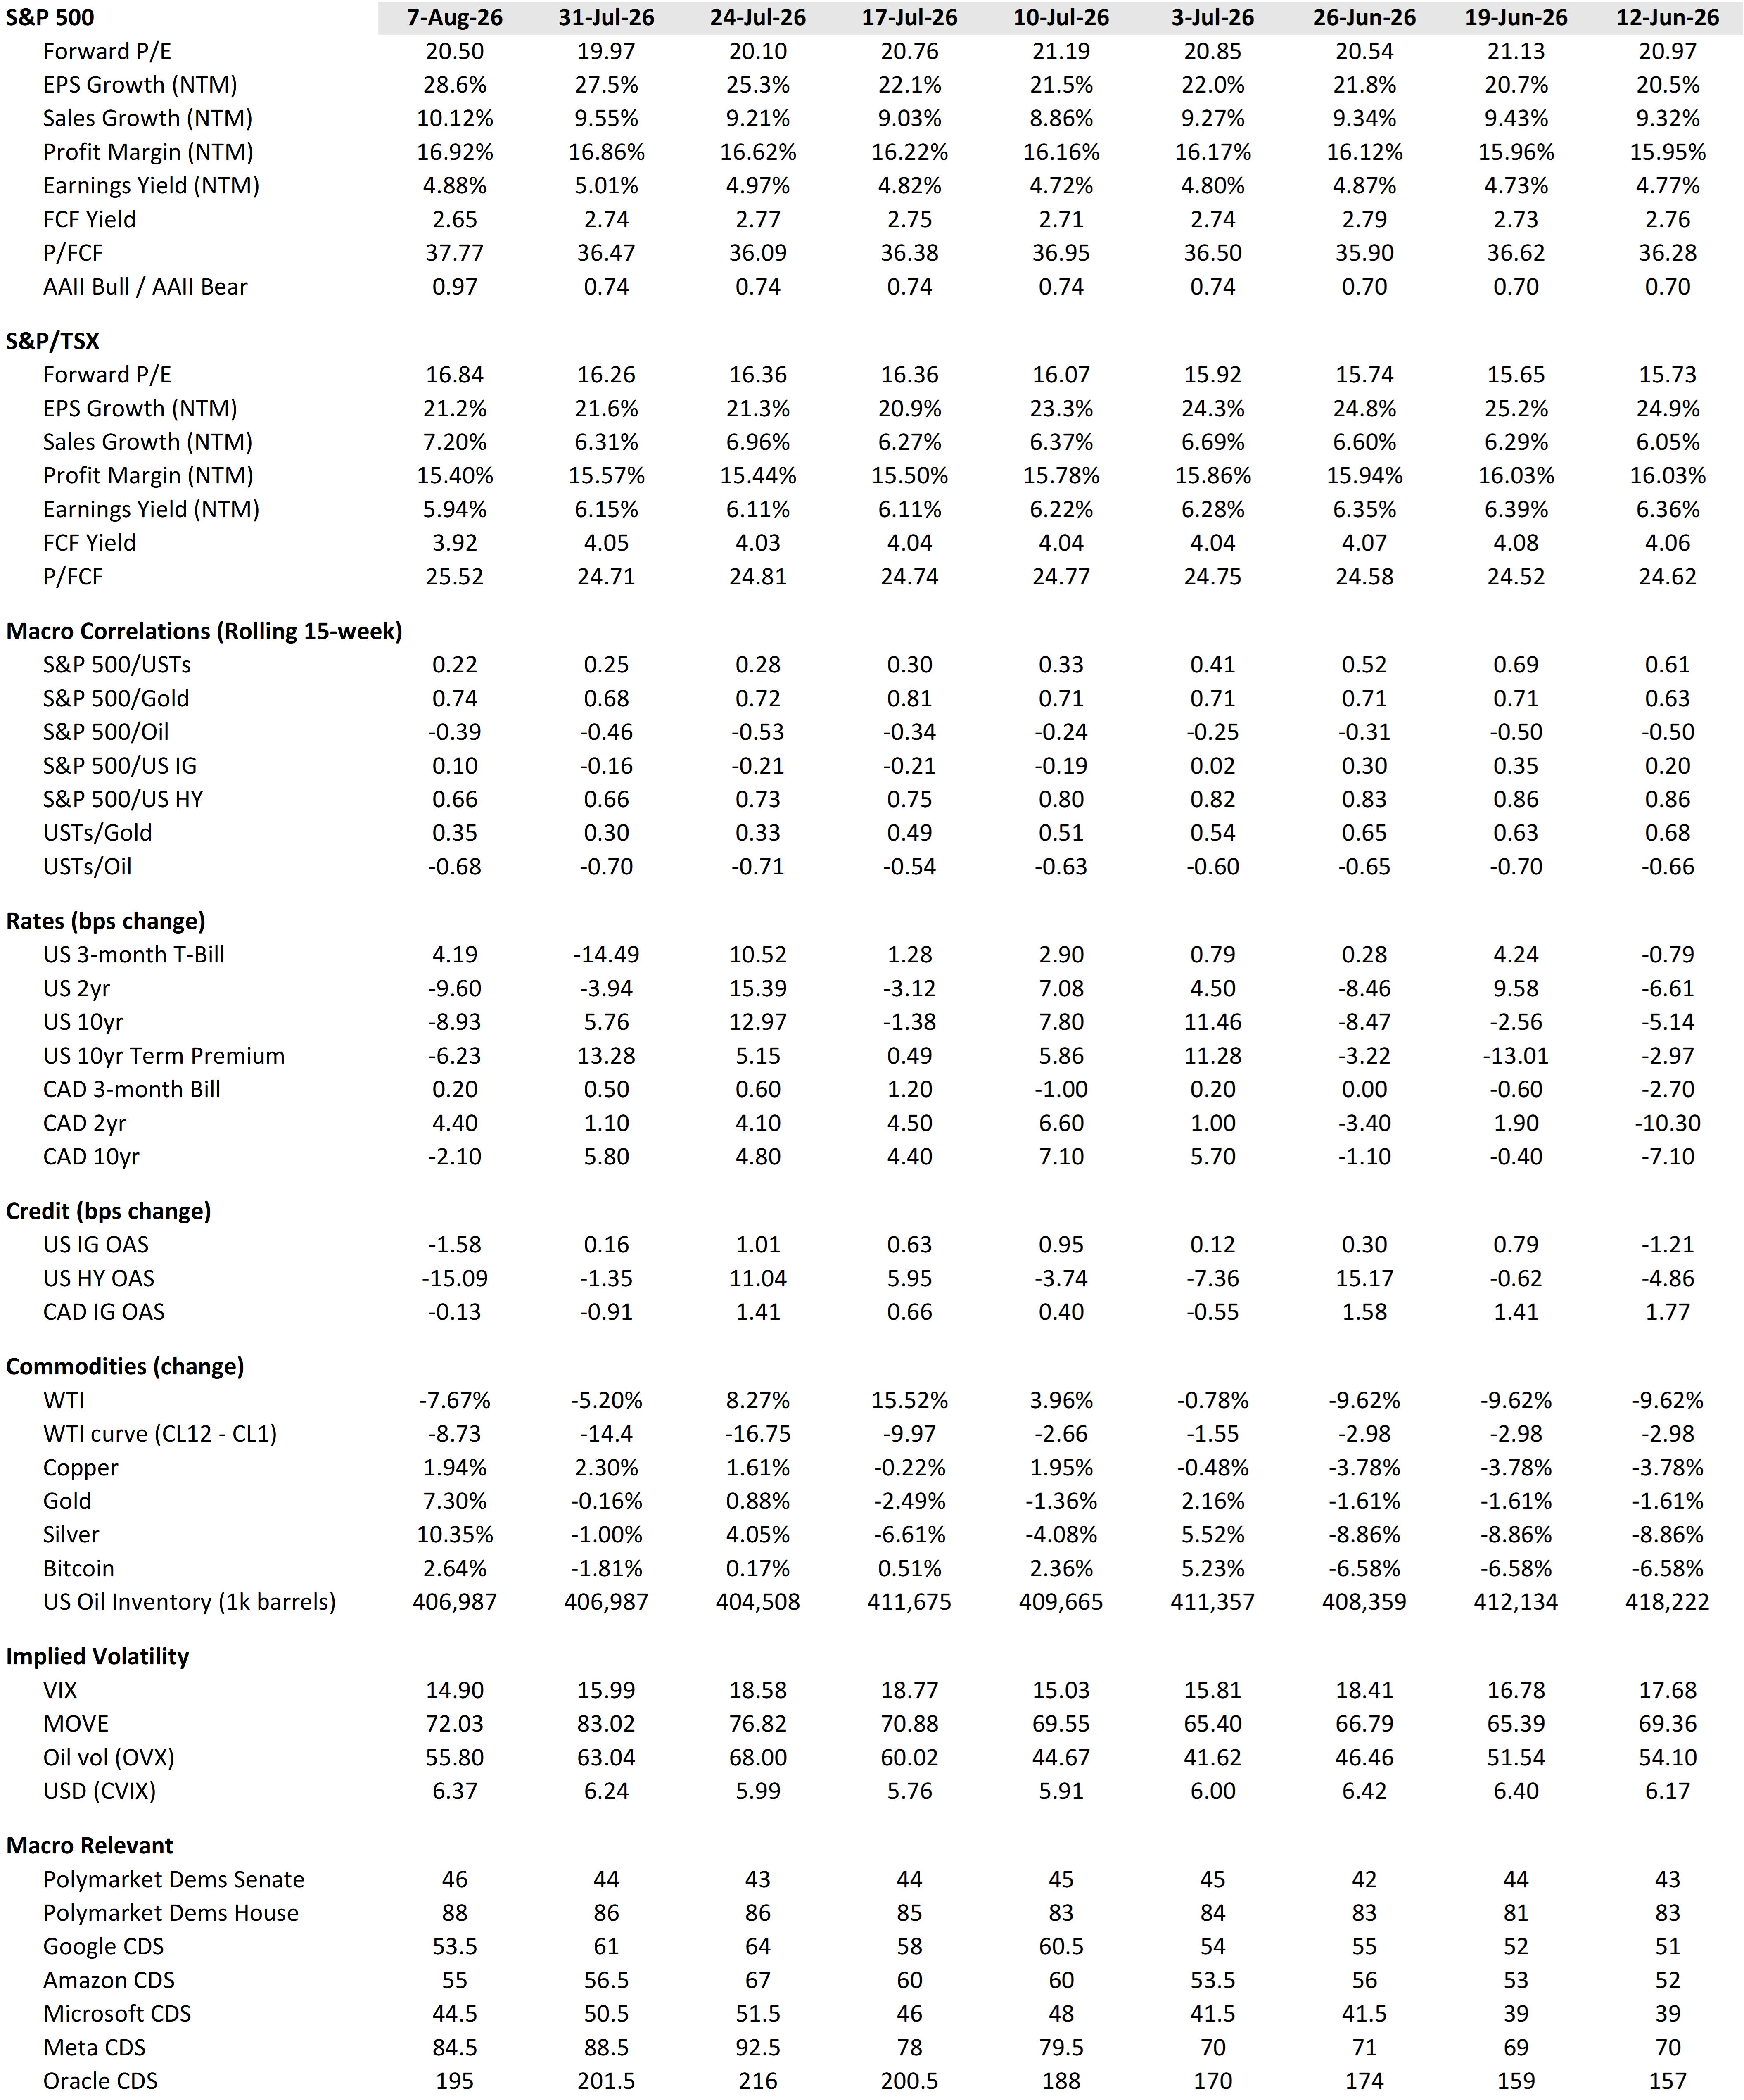
a.) US CPI: The negative nonfarms print from Friday caught many off-guard (more on that below) – which means that the market is likely placing greater weight on this week’s July CPI reading. The street is expecting a +0.1% m/m rise (or +3.4% y/y) in the headline. However, the core reading is expected to be firmer than last month – especially in the electronics category.
Remember that we still have another nonfarms print and a CPI print ahead of the next FOMC – so this print won’t be the arbiter of what happens at the September Fed meeting.
b.) Thoughts on the US/CAD employment numbers: A few things to flag…
- The US release was less than stellar – and not just because the headline came in negative. The unemployment rate dropped to 4.1% for the wrong reasons. Instead of an uptick in labor demand, the drop was largely due to a drop in the number of re-entrants to the labor force (retirees aren’t coming back, neither are parents after raising kids, or people after illnesses). Sure, the labor market is “tight”, but it’s not dynamic – something that is reflected in the soft wages numbers as well.
- The drop in re-entrants has been a notable trend since the fall. That suggests that labor demand is not as strong as the U/E rate reading suggests. This is the sort of thing that Warsh should lean on when it comes to messaging as opposed to the “the market does its thing” stuff.
- By contrast, the CAD number was solid. Employment up in the core age group and in mostly pro-cyclical sectors. One could quibble on the hourly wage front – which was done from July, but that is a very volatile gauge that I don’t put much weight on. Three straight months of solid reports (jobs added + U/E rate lower). My read on this is that firms are becoming more comfortable with respect to the trade situation in the US. This has been a notable drag on hiring and spending for quarters now.
c.) Market observations:
- Equities: Despite our constructive view, it’s hard to look past just how much good news is baked into US equities right now. Forward earnings growth is projected to be 28% over the next 12 months (which is the highest outside of a recession in decades). That earnings growth is being driven by elevated expectations for sales growth as well. This doesn’t feel like an environment where multiples will expand – so its up to earnings surprises (yet again) for additional upside.
- Gold: Looks to have formed a base just above the US$4000/oz mark last week. Part of this could reflect an uptick in ETF demand (see our flows note from Friday), or genuine concerns with the direction of monetary policy and possible USD debasement.
- Correlations: The concern with gold here is that correlations to equities remain high – which negates the diversification allure of the yellow metal. Instead, investment grade bonds and USTs are becoming less coupled with stocks.
- Top performers last week: ZGD, ZJG, ZMT, ZGLD, and ZXLK
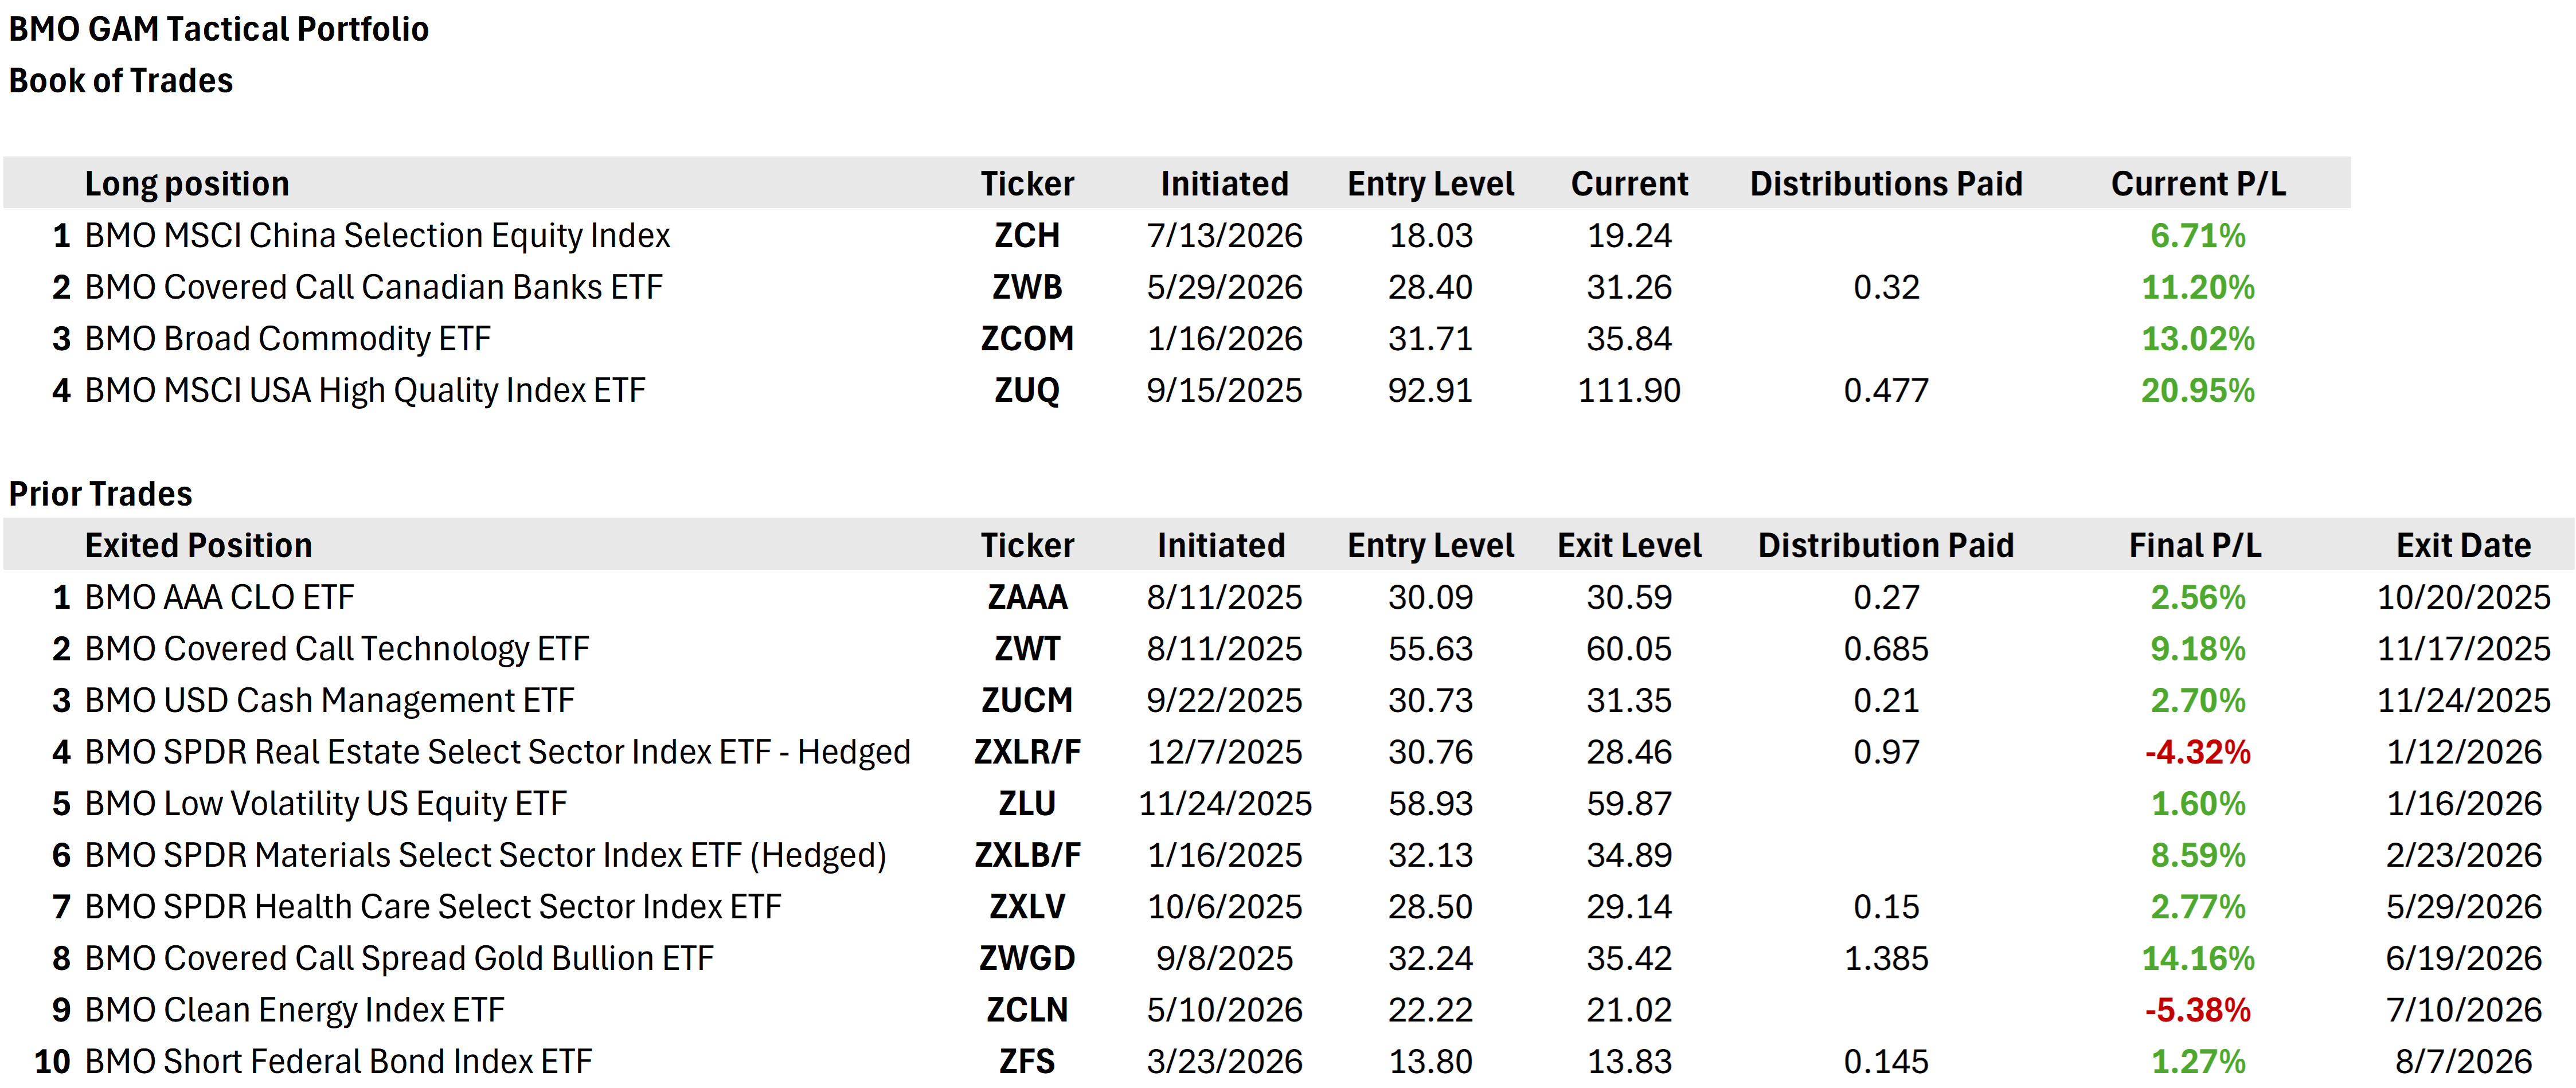
d.) Book of Trades: We’re taking profit on our short ZFS position. Given the strength in recent CAD data, we think the original rationale for the trade (that the market was pricing the BoC too aggressively) has run its course. We’re booking a modest +1.27% profit on the trade.
Updated Performance of our Portfolios
Table 1 – BMO Macro Regime Model Portfolio Performance

Table 2 – BMO Tax Efficient Model Portfolio Performance

Source: BMO GAM
Weekly Macro Table