Weekly Basis Points - What ‘Raiders of the Lost Ark’ Tells Us About the FOMC
November 24, 2025
- There’s a good chance the market is misreading the Fed. US swaps pricing implies multiple Fed cuts through 2026, but strong growth (~4% Q3 nowcast) and inflation near 3% suggest a limited need for aggressive easing.
- Our own feel is that the short-term US neutral rate is higher. That suggests that the Fed funds rate stays higher for longer.
- Portfolio Implications: Position defensively— we favor quality/low-volatility equities, Healthcare and Staples; expect USD strength and pressure on the UST front-end.
I rewatched the classic film ‘Raiders of the Lost Ark’ over the weekend. And because I don’t have anything better to think about these days, I couldn’t help but draw a mental comparison between market participants expecting the Fed to cut rates aggressively to Indiana Jones running towards the boulder in the opening scene.
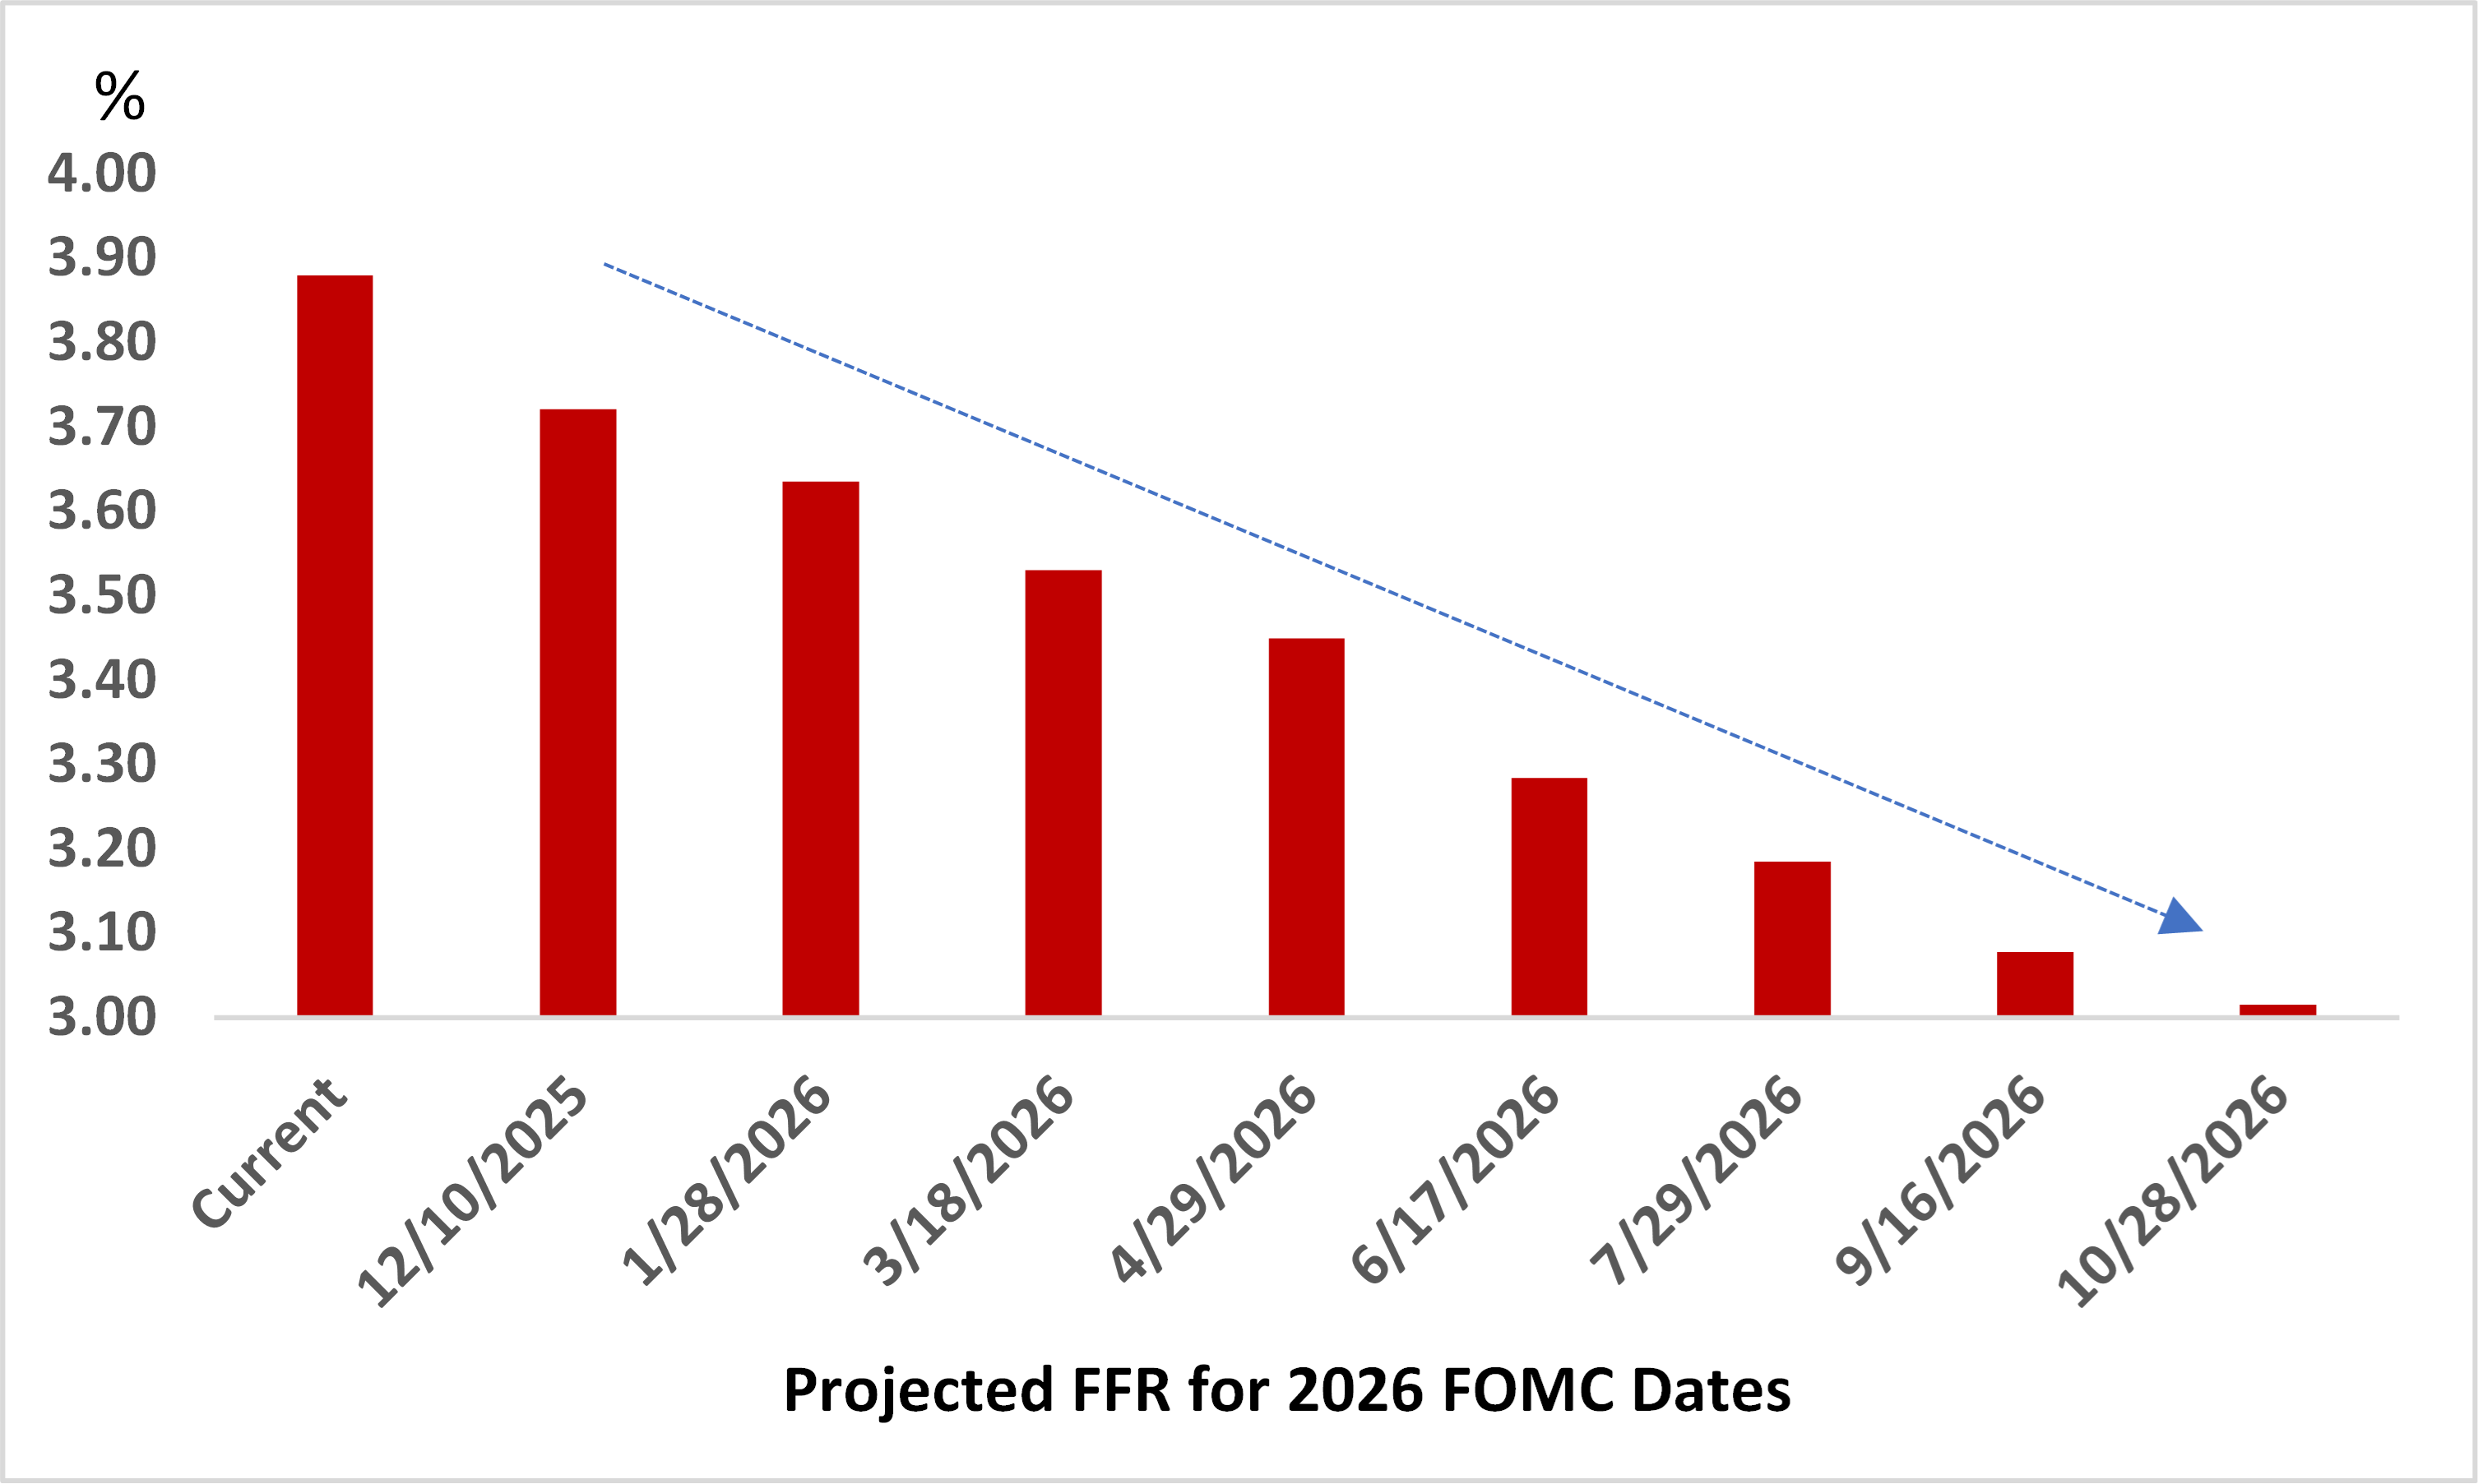
Indeed, if we examine current pricing for the FOMC in the swaps market, there is a 63% chance that the Fed will cut by 25bps at the December meeting. What’s more is that the market expects the Fed to continue to gradually ease throughout 2026 to take the Fed funds rate below the 3.0% level by the end of next year (from an effective rate of 3.9% now). Stop counting on your fingers, folks – that equates to four more cuts from here (see Chart 1).
Chart 1 – Market Implied Fed Funds Rates for 2026 FOMC Dates
But if you look at the body of evidence presented in the data so far, it’s not so clear that the Fed should be easing by that much.
While we won’t have a preliminary estimate for Q3 growth until December, current nowcast trackers have it coming in at just above 4%. If true, that would mean that the US economy has averaged just over 2% growth (Q/Q annualized) over the past four quarters. Certainly, we can attribute a fair chunk of that to AI-related capex, but the available retail sales data also tells us that consumer spending also played a key role in driving that growth. Economic growth at that clip shouldn’t be something that concerns the Fed.
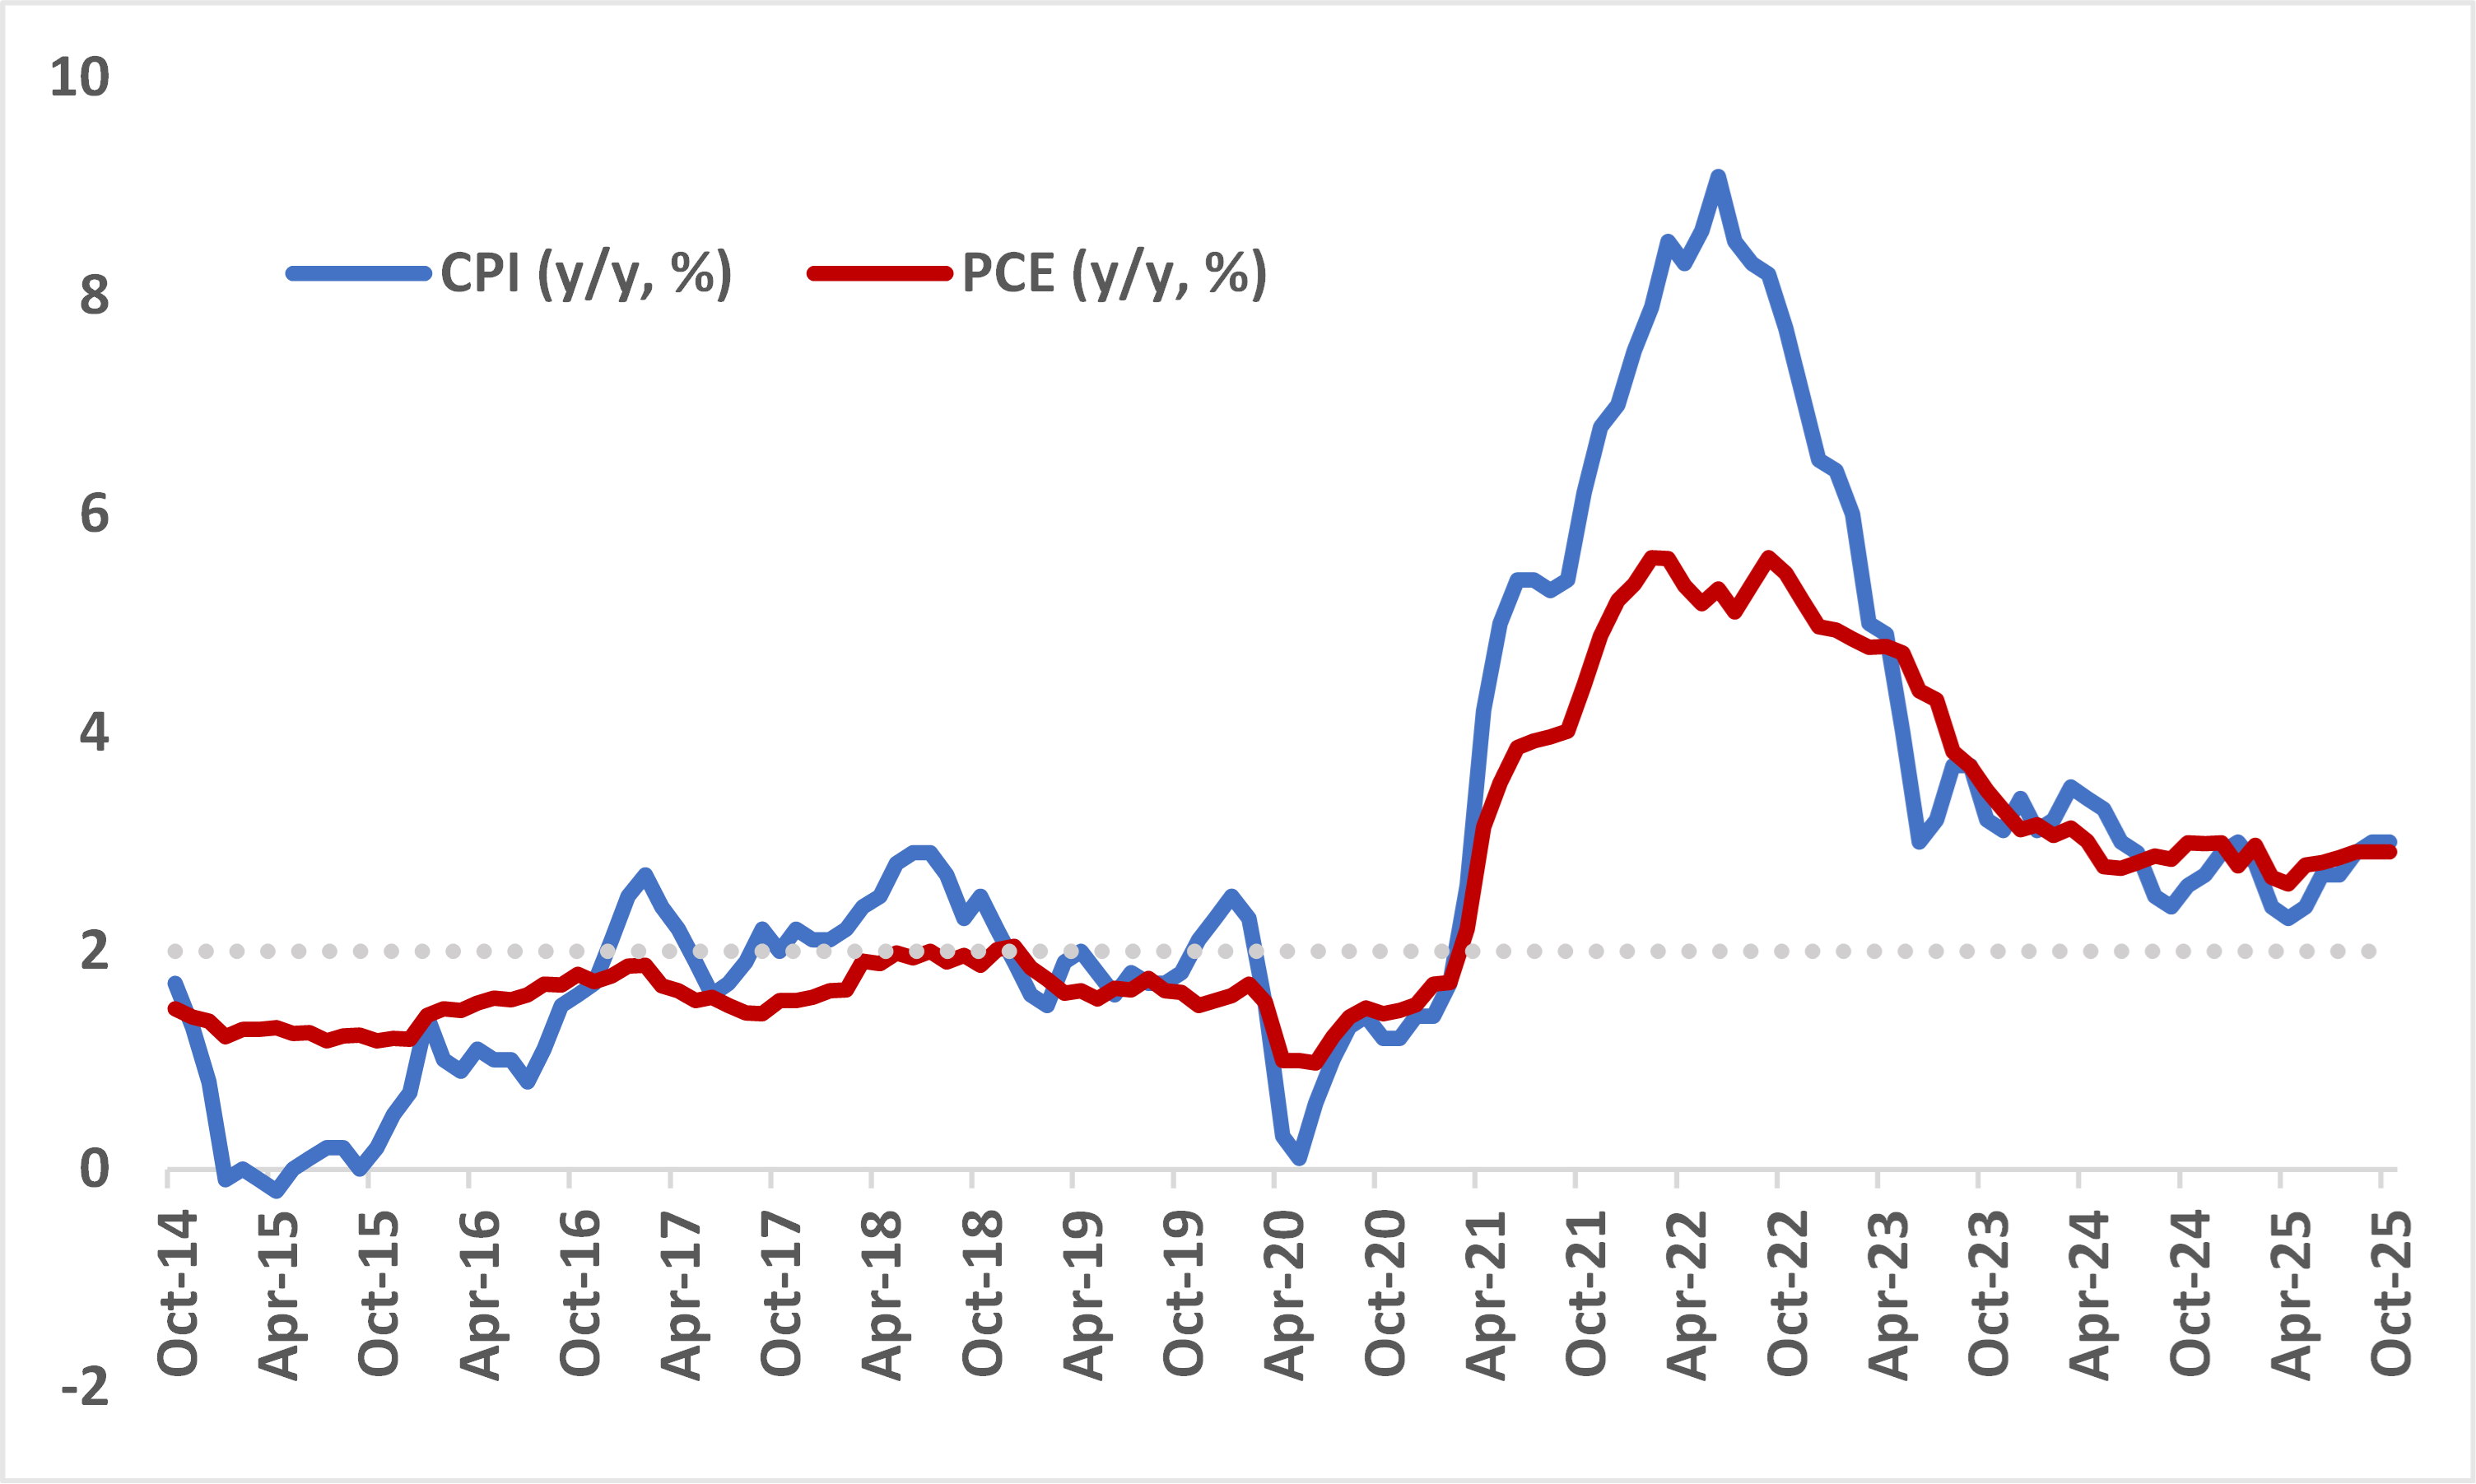
The Bureau of Labor Statistics did cancel the release of the October CPI print on Friday, but it’s unlikely that would have provided definitive proof that the Fed is making progress on it’s inflation mandate. Both CPI and PCE are currently tracking closer to 3% as opposed to the 2% target (Chart 2). Also, household expectations of longer-term inflation are still a bit too high for comfort. The textbook would suggest that the Fed needs to keep rates on hold at this point.
Chart 2 – Both CPI and PCE are Still Well Above the Fed’s Price Objective
We find is that arguments in favour of Fed rate cuts in 2026 lean heavily on two things: first, that the labor market is showing signs of duress, and second, that politics will inevitably encroach on decision-making.
On the first point, we’ll concede that the labor market is showing signs of strain (the unemployment rate is trending higher after all). However, the updated claims data that we’re still far from a point where slack is building materially in the labor market. At the very least, this implies that the disinflationary impulse from a softer labor market will be slower than what many expect. On the second point, remember that Trump replacing Powell with someone more politically aligned will still represent just one vote out of 12. The Fed deliberates by majority and a Fed Chair has been outvoted before.
So what does all of this mean? It tells us that the nominal neutral rate in the short-term is likely higher than what many think. If that is the case, then current monetary policy conditions are likely not as restrictive and there’s little reason to expect the Fed to cut by much more going forward.
And to be fair, it does feel like the equity market is picking up on this point. A Fed that is less likely to ease may mean additional headwinds for broad risk assets. If we are correct – then the tactical path forward is clear - tilt your portfolios to be a bit more defensive as we ride out this wave of caution. That will mean the following:
- Quality and low vol outperform as strategies in the coming period (+ZUQ and +ZLU).
- Healthcare and Staples should continue to shine (+ZXLV and +ZXLP).
- The US dollar rallies (trim your hedges, please).
- The front-end of the UST curve should come under pressure in the near-term.
Tying this back to our intro, an infamous pop-culture joke is that Indiana Jones is actually irrelevant to the outcome of the story of ‘Raiders of the Lost Ark’. In the end, the bad guys ended up finding the Ark anyway and were still destroyed while the hero was tied up. That’s an apt takeaway for anyone that wants to be too activist in a period where the market is likely misreading the Fed.
Portfolio Strategy
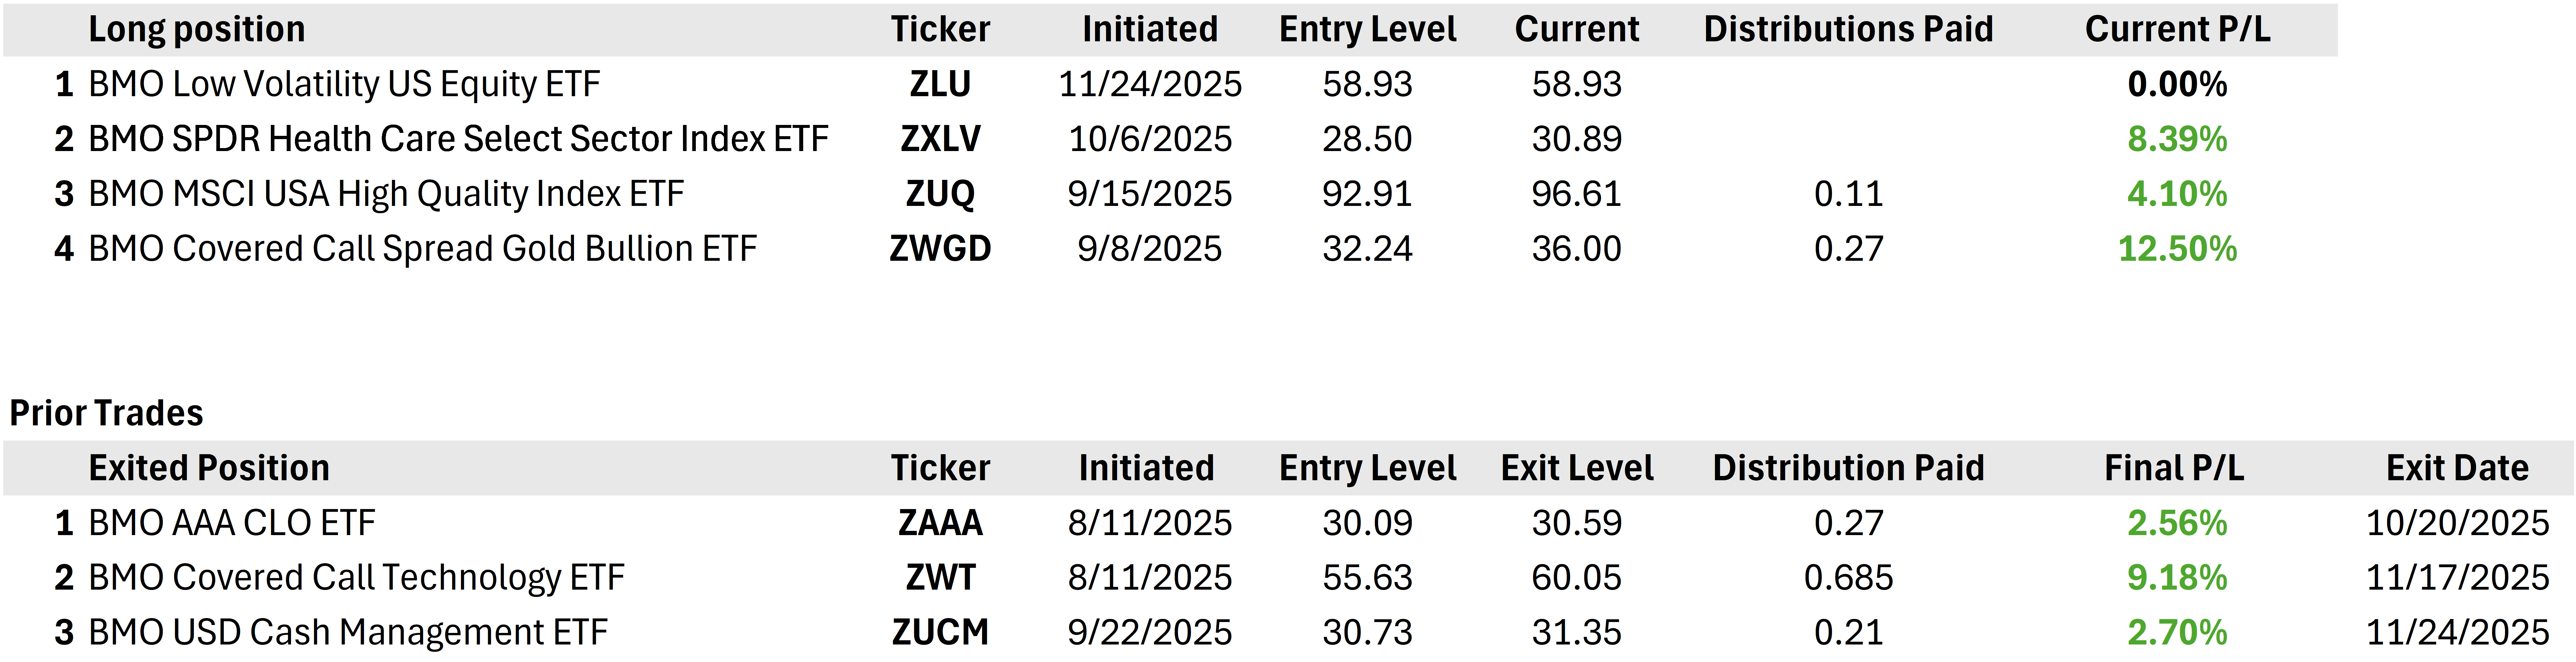
In our tactical portfolio, we are taking profit on our position in ZUCM (+2.7%). At the same time, we are initiating a long position in ZLU (see Book of Trades below).
Book of Trades
In the US, the week is truncated given the Thanksgiving holiday on Thursday and Black Friday. Ahead of then, we’ll get a deluge of backloaded data particularly focused on the housing sector.
Housing starts and permits are out today followed by price indices and pending sales data tomorrow. Concurrently, we’ll also get the September prints for retail sales and PPI alongside jobless claims data later in the week. All of this will be informative as it will give us a clue on the health of the household sector in the US. With all the focus on AI – market participants appear to be forgetting that household spending is still running at a decent clip.
In Canada, it’s a sparse week for important data until the release of the Q3 GDP on Friday (alongside the September print). Some of the sharper minds on Bay Street are expecting a return back to positive growth in Q3, but not enough to reduce the slack that has built up in the real economy. Indeed, a +0.5%-0.7% annualized growth figure would be constructive but would still mean that less than half of the Q2 -1.6% decline was offset.
When the print is released, pay particular attention to whether September GDP was strong and whether the estimate for October is indicating momentum towards Q4. That should endorse the Bank’s view that policy settings are about right.
Balanced Portfolio
Current Weight |
Benchmark |
||
Fixed Income |
20% |
30% |
Underweight |
|
5% |
15% |
|
|
15% |
15% |
|
Equities |
64% |
60% |
Overweight |
|
25% |
25% |
|
|
17% |
25% |
|
|
22% |
10% |
|
Alts/Hybrids |
20% |
10% |
Overweight |
Asset Class |
View |
Notes |
Equities |
Slightly bullish |
|
Fixed Income |
Slightly bearish |
|
Alternatives |
Bullish |
|
FX |
Neutral |
|