Weekly Basis Points - What Stagflation Means for Your Portfolio
August 18, 2025
Here’s a question that is open to debate, but we’ll ask it anyway - what is the one economic backdrop that is most concerning for a central banker?
No, it’s not a recession or a depression. The solution to either of those is intuitive enough – stimulate the economy by lowering interest rates and/or by increasing the size of the central bank’s balance sheet. It’s also not periods of excess demand – which is characterized by strong growth and high inflation. The remedy there is to ensure that financial conditions remain tight enough to prevent elevated inflation from becoming embedded in expectations.
Instead, we suspect that if we polled enough central bankers, the vast majority would answer ‘stagflation’. For those that may not be as familiar, this is a backdrop that is characterized by slower real activity, a rising unemployment rate and a general increase in consumer prices. For central bankers, a period of stagflation means the need to prioritize one of two competing issues – either stable prices or stable growth.
The path that the central banker chooses matters for markets and for investors.
If the central banker elects to prioritize economic growth, then this would mean loosening monetary policy conditions. For instance, in response to weak credit demand, the Fed could cut rates to engender easier access to credit for firms which would help them invest and hire more. However, that pickup in activity would also portend to a further rise in prices – compounding the issue of the lack of stability in inflation.
On the flip side, the central banker could elect to keep rates elevated or hike them further to address the issue of rising prices. But that would mean that credit access becomes tighter, and that firms become more reluctant to invest and hire – which would (in turn) compound the issue of falling real activity and higher unemployment.
Why are we bringing this up? Because there are growing risks that the US economy is about to enter a period of mild stagflation. For instance, last week’s CPI and PPI prints suggest that the Fed’s progress on curbing inflationary pressures had stalled. At the same time, the more recent Nonfarms numbers suggest that there are cracks appearing in the US labor market.
Despite all this, markets are pricing the Fed to cut three more times in 2025 and a few more in 2026 to take the terminal rate to 3.00%. At the margin, this would imply that the market feels that the Fed will prioritize growth risks. Implicitly, that also corresponds to even less progress on its inflation mandate. As such, we’ve seen inflation expectations rise (yet again) in the Michigan survey.
So then, how should our readers position their portfolios in advance of such an event?
Luckily for us, we do have the benefit of hindsight. Indeed, we can look back at prior periods of ‘stagflation’ to gauge how each asset class behaved to come up with a gameplan. Of course, defining when a period of stagflation begins or ends is tricky, so we’ll rely on an easy-to-understand heuristic that is simple enough for our readers to understand. For instance, we’ll look back on prior periods when the unemployment rate rose by at least 0.5% over the prior 12 months and when core inflation (ex-food/energy) was above 2.5%. Chart 1 shows those periods overlaid on both the US unemployment rate and core inflation going back 50 years.
Chart 1 – Prior Periods of Stagflation in the US
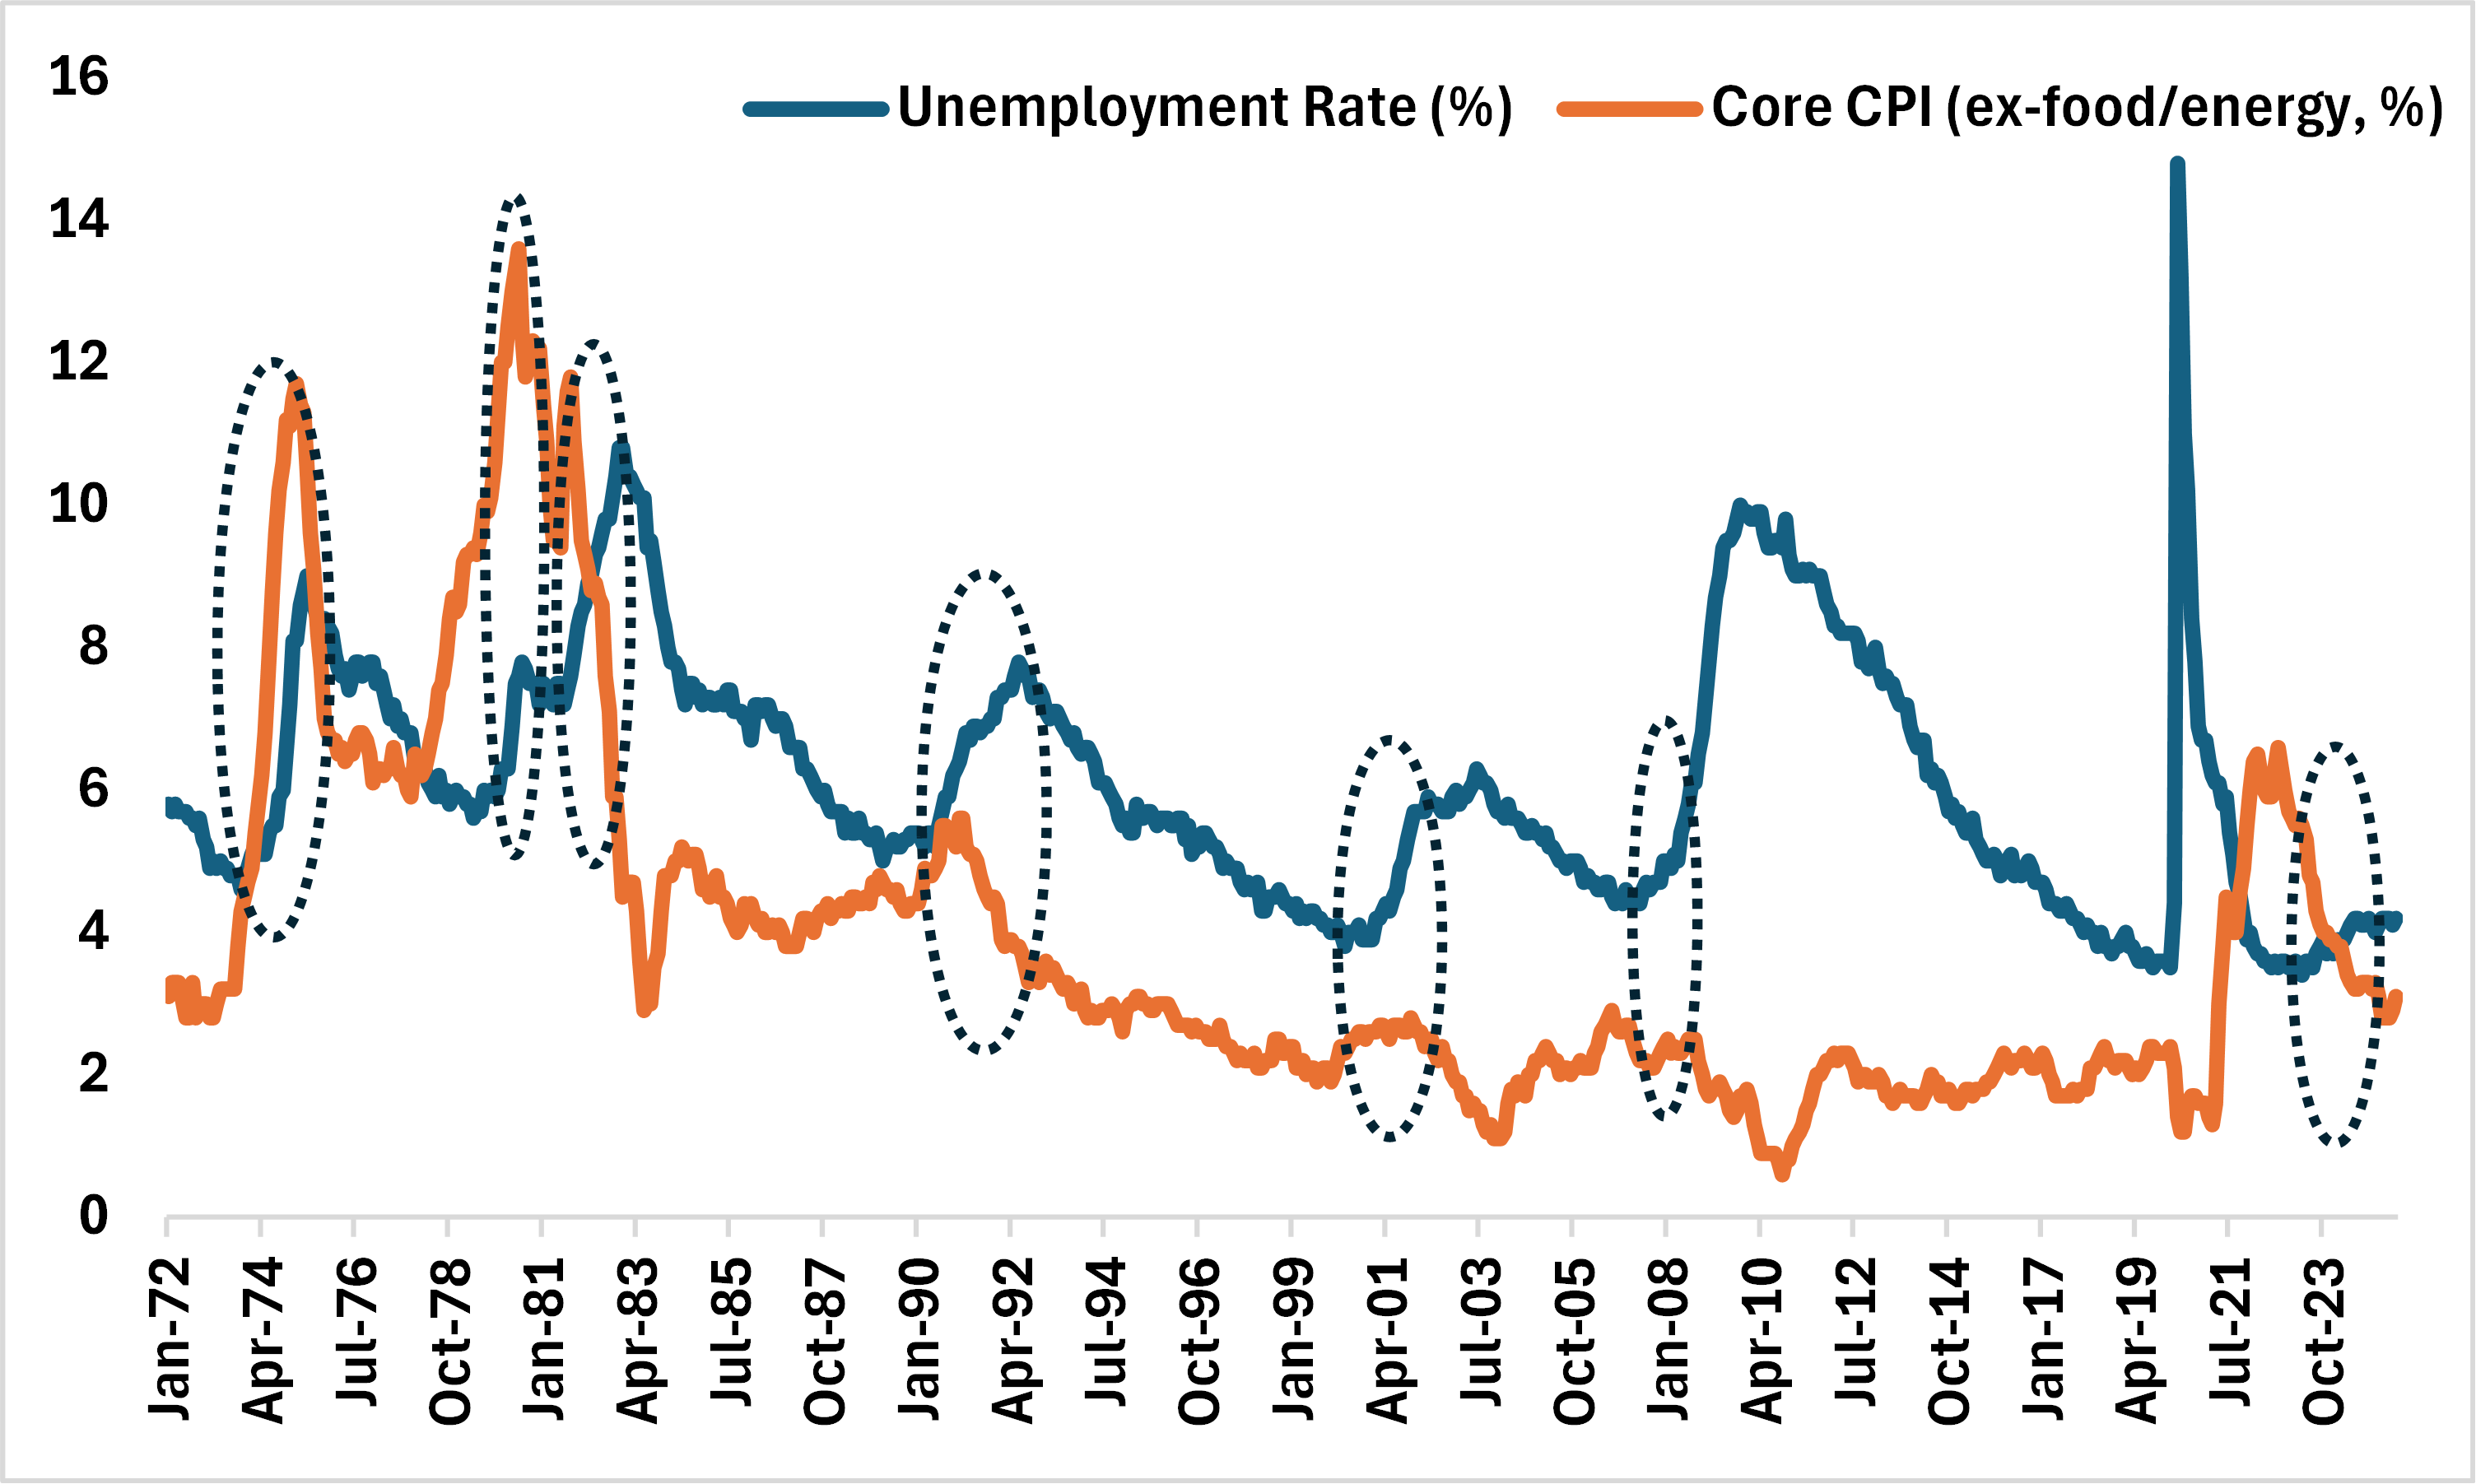
*The dotted circles in the above chart corresponds to periods where the unemployment rate rose by 0.5% over 12 months on a rolling basis and where core CPI was above 2.5%
Source: BLS, BMO GAM
In our analysis, we find that for each time the economy entered a period of stagflation – the S&P 500 declined. The average drawdown corresponded to about 15.7% over an average 4.5 months. For most of those periods, over the time it took for the S&P 500 to bottom out, we found that Gold did a much better job of preserving its value – with an average of drawdown of about 4.8%.
Admittedly, the one observation that we were surprised to see was the outperformance of indices that tracked US Treasuries over those same periods. We’d chalk that up to structural factors (namely, the 40-year bullish market for bonds) that are far less a tailwind these days. For example, the last observation period is 2024 – and bonds underperformed relative to Gold.
For US Treasuries, the other complication is where we are in terms of the monetary cycle. While the Fed is expected to ease rates (supportive for the front-end), the long-end is likely to remain pinned and/or defensive given the rise in inflation expectations.
Table 1 – Performance of the S&P 500 During Prior Periods of Stagflation
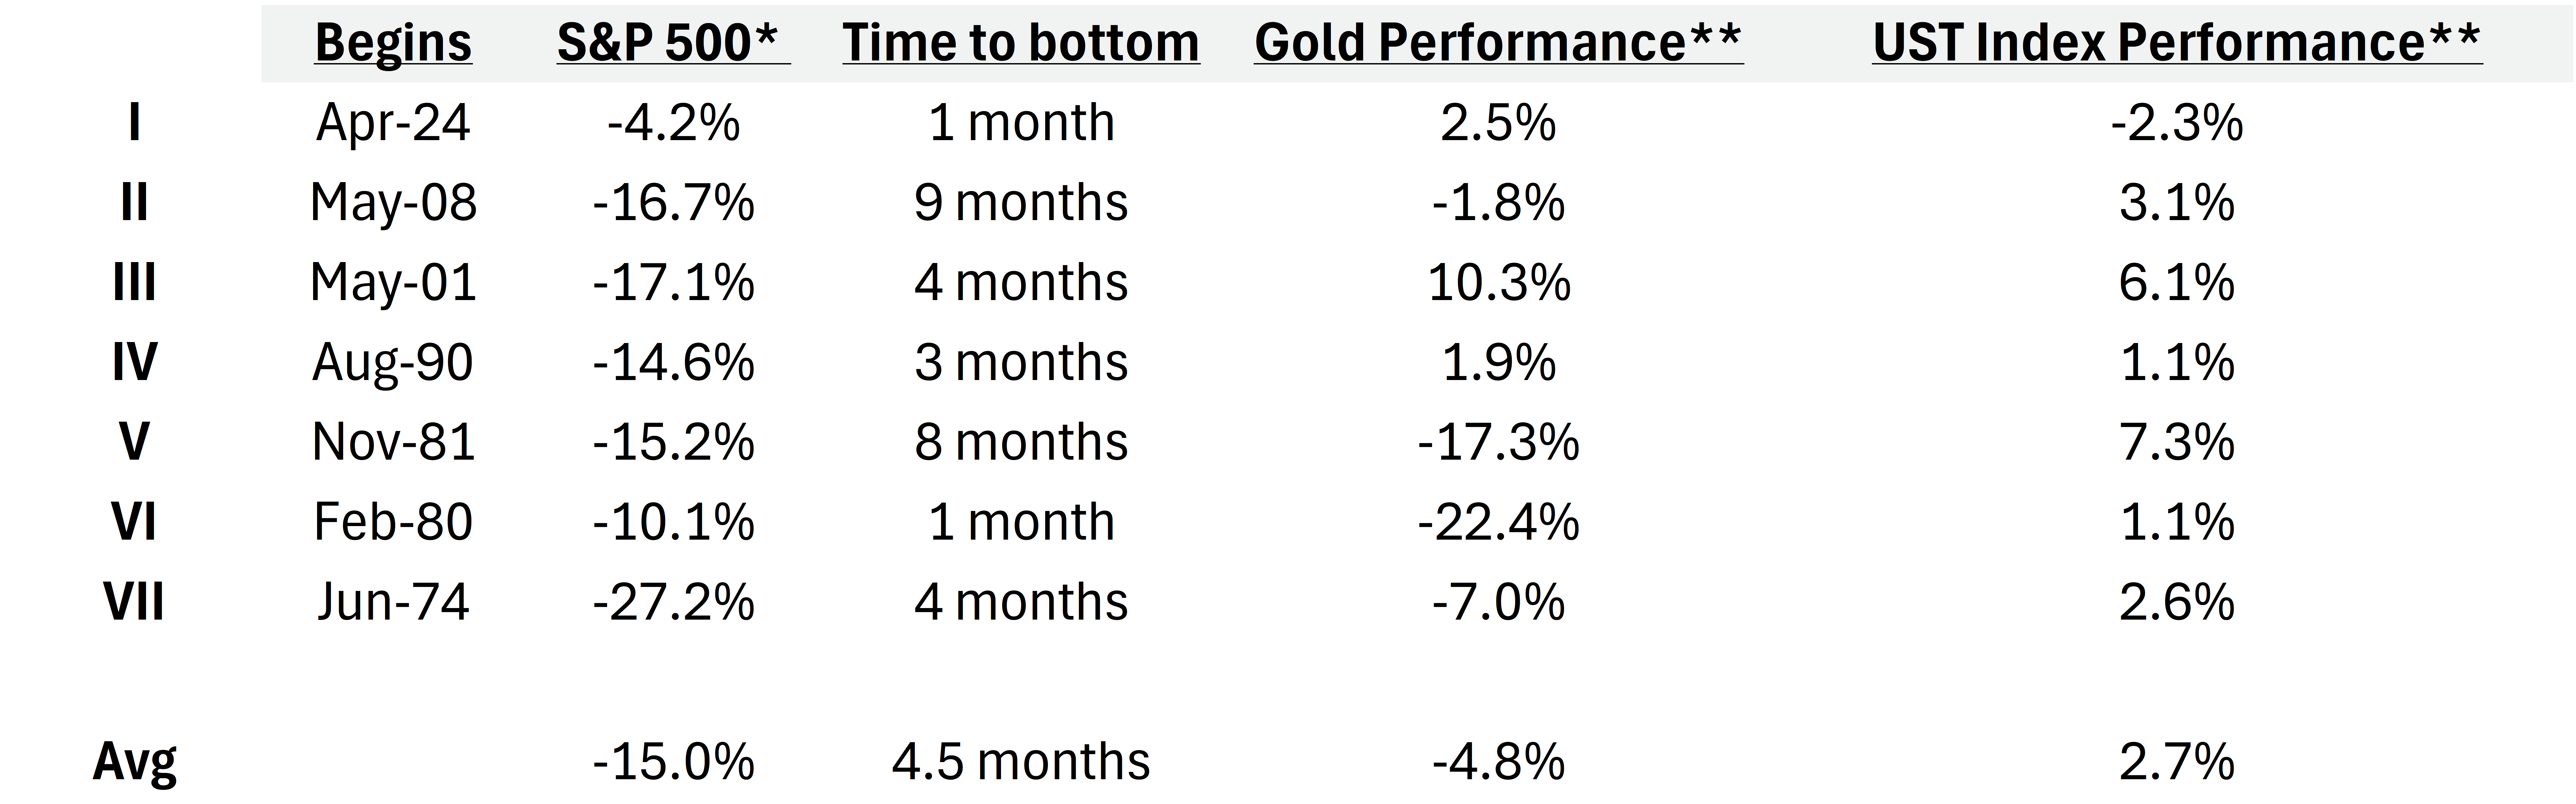
*The above table looks at the performance of the S&P 500 from the start of prior periods that we identify as ‘stagflation’ to where the index bottomed out.
**The performance of Gold and UST Index is also observed over that same timeframe.
Source: Bloomberg, BMO GAM
What do we take away from this? A few things…
- Though periods of stagflation can differ in terms of intensity, they usually result in risk-off markets (lower US equities).
- Gold does a better job of preserving its value relative to equities.
- Bonds have, surprisingly, held in relatively well – though we’d be less inclined to believe that this will be the case going forward.
However, this is just a risk to monitor for now. Even by the standards of our own heuristic we’d still need to see the unemployment rate rise by a bit more before the current backdrop would be consistent with a technical stagflation episode. Nevertheless, if we do start to see more signs of weakness in the US labor market, it would be prudent to shift some allocation away from our US equity exposure and towards alts.
Indeed, this is consistent with our view that alternatives and hybrids are much better diversification instruments at this point than bonds.
Tactical ETFs that we like…
- ZXLV (BMO SPDR Health Care Select Sector Index ETF): True, pharmaceutical tariffs are likely to come at some point, but we feel that there has been a lot priced in already. The fundamentals still look decent and pricing is cheap.
- From last week..
- ZAAA (BMO AAA CLO ETF)
- ZWT (BMO Covered Call Technology ETF)
Portfolio Strategy:
a.) We still continue to favour Equities and Alts over Fixed Income.
- Equities: While we are wary of near-term stagflation risks, we remain neutral in our balanced ETF portfolio. Indeed, our optimism on the fundamentals (earnings) is tempered to a degree by extant valuation and sentiment. Within this space, we continue to favour US large caps (tech, communications, financials and utilities) and like augmenting that with increased exposure to EM.
- Fixed Income: We’re underweight this asset class in our balanced portfolio. We continue to optimize for ‘high yield + short duration’ with preference for sub-sovereign exposure.
- Alts/Cash: We continue to like gold and infrastructure as diversifiers.
b.) Current holdings (balanced portfolio):
Fixed income
- ZDB (BMO Discount Bond Index ETF)
- ZBI (BMO Canadian Bank Income Index ETF)
- ZTS (BMO Short-Term US Treasury Bond Index ETF)
Equities
- ZUQ (BMO MSCI USA High Quality Index ETF)
- ZLB (BMO Low Volatility Canadian Equity ETF)
- ZLI (BMO Low Volatility International Equity ETF)
- ZIN (BMO Equal Weight Industrials Index ETF)
- ZEM (BMO MSCI Emerging Markets Index ETF)
Alts/Non-traditional Hybrids
- ZLSU (BMO Long Short US Equity ETF)
- ZLSC (BMO Long Short Canadian Equity ETF)
- ZWGD (BMO Covered Call Spread Gold Bullion ETF)
- ZGI (BMO Global Infrastructure Index ETF)
c.) Views
Asset Class |
View |
Notes |
Equities |
Slightly bullish |
|
Fixed Income |
Slightly bearish |
|
Alternatives |
Slightly bullish |
|
FX (CAD) |
Neutral |
|
Region |
View |
Notes |
Canada |
Neutral |
|
US |
Neutral |
|
EAFE |
Neutral |
|
EM (China) |
Neutral |
|
EM (ex-China) |
Neutral |
|