7 Strategies to Easily Integrate Factor ETFs
Implementations that family offices and investment counselors can use to tap into the benefits of Factor-based ETFs


What the research says
In a previous issue of THE VAULT, my colleague Mark Webster offered a detailed background on the various types of factors. Building on that foundation, this report will deliver an actionable guide for implementing Factor-based ETFs in portfolios.
Much research has been published on this topic since Nobel laureates Eugene Fama and Kenneth French famously identified the three factors that explained the sources of investment returns (1992). The initial ground-breaking insights were that relative size and value were crucial to performance. A recent paper published in the CFA Institute’s Financial Analysts’ Journal, “Risk Management and Optimal Combination of Equity Market Factors,” examined 54 years of data and found that weighting factors inversely to their (60-day) standard deviations could substantially improve portfolio results (versus portfolios of equally weighted or overlapping factors).1
Factors were once limited to managers who had the resources to conduct sophisticated screening to identify and to monitor desirable Factor advantages. ETFs have made factors accessible to all investors, providing targeted exposure that is low cost, transparent, liquid and scalable. For those family offices and investment counsellors seeking to construct more robust, deliberate portfolios, Factor ETFs can be very good compliments to core equity strategies.
The following provides insight into several ways family office and investment counsel practitioners are using factor ETFs to build more robust portfolios:
1) Based on an investment objective
Part of the beauty of using ETFs to obtain factor exposures is that the screening rules are transparent, consistent and easy to understand. This allows investors to position portfolios according to specific investment criteria. For example:

It should be stated that, looking back at 20+ years of data from MSCI, the two factors that tended to experience higher levels of risk were Enhanced Value and Dividend, in that order. In order to avoid some of the pitfalls of each factor, we feel strongly that these two methodologies must be engineered to omit companies that are cheap for a reason.
This is, for example, why our proprietary Dividend methodology does not simply screen for dividend yields. Dividend sustainability is assessed using 5 years of operating cash flows, weeding out companies using acquisitions, investment income or debt to maintain otherwise unsustainable dividend policies. In addition, we eliminate companies whose debt is below investment grade, and companies with price momentum in the bottom 10%.
Our Enhanced Value indexes, built by MSCI, use multiple valuation metrics to help avoid catching the proverbial falling knife. These indexes screen for low P/E and low P/B, which are traditional “value” metrics, but also low enterprise value (EV)/Operating Cash Flow, which disqualifies companies that are highly leveraged.
2) As a strategic market cycle overlay
Factor performance can vary on different macro drivers, and rotating through them across the cycle can help manage risk and add alpha to a portfolio. For example, Low Volatility and Quality strategies are most likely to outperform at the end of a market cycle, when asset prices are declining, whereas the Value factor is pro-cyclical, demonstrating stronger returns in a rapidly rising market Over the past year, Quality was the best performing overall, while Value and Small Cap shone later on as the vaccines began to roll out and the economic recovery took hold.

Sector Rotation

Factor Rotation

3) Pairing with an index
Not all factors exposures need to stand alone; you can always split the ticket with the broad index to tilt the portfolio toward a specific objective. In the example below, we show how an investor can use Quality and Low Volatility strategies in conjunction with broad market indexes, to tilt the portfolio toward a defensive growth posture.
Core & Satellite Blended Portfolios
Late Cycle Defensive Factor Rotation

4) Pairing with active strategies
Similar to the above scenario, you may already have a sizeable allocation to an active manager that is working well. However, if the PM’s mandate is broader than any one factor, layering ETFs over the core portfolio can add a specific tilt that either reflects a long-term belief in that factor, or a need to be more tactical across the cycle. In such cases, ETFs offer cost-efficiencies and a chance to diversify manager exposure.
5) Replacement for active strategies
Conversely, an active manager may be underperforming and require replacing within the portfolio. Perhaps the PM has failed to add value, or their management fees are too high – in either case, ETFs offer a low-cost alternative to providing targeted factor exposure.
6) As a multi-factor portfolio
Rather than investing in one particular style, investors can choose to combine multiple factors into a single portfolio. This can be done either as an equally weighted set of factors, or via a barbell approach where Value and Quality sit on opposing ends of the risk-return spectrum. Based on 22 years of data from MSCI, the former approach was the second-best performing strategy behind a pure play on Enhanced Value.2
The second method (the barbell) provides exposure to the “physical economy” through Value. However, it’s important to note that Value had been in the doldrums for several years before its resurgence last November, when the reopening trade was kicked off by Pfizer’s vaccine success. Having that exposure on one end of the barbell strategy gives investors upside participation should the economic boom continue from here. As a counterweight, the portfolio would hold a Quality exposure to non-cyclical, well-capitalized companies, if the fourth coronavirus wave roils markets.
MSCI Factor Index Performance Heat Map
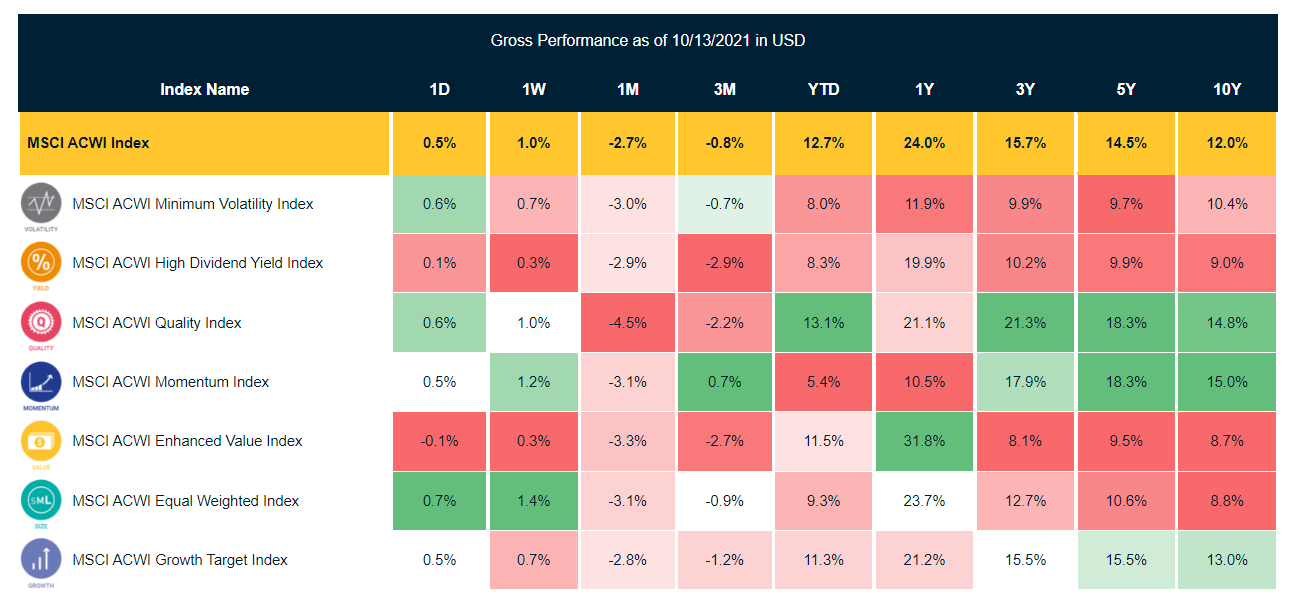
Source: MSCI, as of October 13, 2021. Click here for more information.
Go deeper into US Equity Factor ETFs. Download a Morningstar report comparing BMO ETFs on volatility, drawdowns, absolute performance and more. DOWNLOAD
7) Consider the source of family wealth
Investment counselors and family offices dealing with a high-net-worth clientele are accustomed to ensuring that their clients’ portfolios are diversified beyond their initial source of wealth. For example, if a family’s wealth was earned and is concentrated in the financial sector, the practitioner should seek to diversify the portfolio by adding complementary exposures. Because the Quality factor uses low leverage as a key screening metric, it tends to provide very minimal exposure to the financial sector – making it an excellent complement for this particular family.
Conversely, for a family whose source of wealth is the technology sector, Quality factor ETFs could result in too much exposure to the sector overall. (Quality tends to have higher IT exposure because of the high return on equity and low leverage metrics). In this case, Low Volatility may be more complementary as it tends to be heavier in utilities and consumer staples – two sectors with the lowest correlation to technology.
When analyzing Factor ETFs for portfolio inclusion, inherent sector biases should be examined.
To help you with your due diligence on this, the following links provide a visual overview of how the factor exposures compare to the respective broad market indexes in each geographic region:
Canadian Equity ETF Breakdown >
Deciding on Factor Suitability
Ultimately, the overwhelming consensus of academic research and empirical data is that factors – balanced by risk management, of course – are crucial to optimizing performance across the market cycle. Regardless of which of the above implementation strategies most closely reflects your portfolio management needs and processes, one thing is for certain: ETFs have democratized access to factors, bringing practitioners easy, cost-efficient tools to use in their client portfolios.
| Factor | Description | Methodology |
|---|---|---|
| Low Volatility | -Uses Beta as its risk measure. Competing methodologies use either Standard Deviation or Minimum Variance, both of which measure idiosyncratic risks. Beta provides a more stable measurement over time and also measures market sensitivity, which is better for modelling macro risks; -Sector and Security concentration limits are used to ensure the portfolio is diversified and does not assume any unintended, and potentially unrewarded risks. | BMO Low Volatility Strategy > |
| Dividend | BMO proprietary methodology: -Identify Sustainable Dividend Growers, companies which demonstrate an ability to raise their dividend and maintain it from Core Operational Earnings. This eliminates companies which use debt, investment income or acquisitions to pay dividends; -Sector and Security concentration limits are used to ensure the portfolio is diversified and does not assume any unintended, and potentially unrewarded risks. | BMO Dividend ETF Whitepaper > |
| Quality | MSCI Factor methodology: -Identifies companies displaying High Return on Equity, Stable Earnings Growth and Low Debt-to-Equity (Leverage); -Compared to the parent Index, the Quality Factor Index reduces volatility while generating attractive returns. | Quality ETF Whitepaper > |
| Enhanced Value | MSCI Factor methodology: -Identifies companies with Low Price to Forward Earnings, Low Price-to-Book and Low Enterprise Value-to-Cash Flow from Operations. Forward Earnings are used to reveal companies which may be mispriced. Low enterprise Value-to-Cash Flow from Operations is used to minimize Value traps which may occur in highly leveraged companies; -Exposure is Sector-neutral and captures 30% of the Market Capitalization of the Parent Index (50% in Canada). | BMO Value ETFs Whitepaper > |
| Size | S&P Dow Jones for Small & Mid Capitalization Indices / SolActive for Equal Weight Sector Indices: -S&P Dow Jones uses an Earnings screen to ensure all constituents in the Small & Mid Cap Indices have positive earnings over the previous four Quarter. This acts as a Quality screen, indicating management has exercised a positive influence on investor Capital; SolActive is used for Equal Weight Sector exposures. Equal Weight is a worthy approach because it forces diversification across the portfolio, minimizing significant security and portfolio concentration risks which occur in market capitalization or market capped sector Indices | S&P 400, S&P 500, S&P 600 Methodology > |
To learn more about our Factors ETFs, or other ideas to optimize your portfolios, reach out to your BMO ETF Specialist.
2 MSCI Inc. historical frequency of outperformance of MSCI World Factor Indexes; gross returns in USD from December 1999 to December 2020.
Disclosures:
Any statement that necessarily depends on future events may be a forward-looking statement. Forward-looking statements are not guarantees of performance. They involve risks, uncertainties and assumptions. Although such statements are based on assumptions that are believed to be reasonable, there can be no assurance that actual results will not differ materially from expectations. Investors are cautioned not to rely unduly on any forward-looking statements. In connection with any forward-looking statements, investors should carefully consider the areas of risk described in the most recent simplified prospectus.
The viewpoints expressed by the authors represents their assessment of the markets at the time of publication. Those views are subject to change without notice at any time without any kind of notice. The information provided herein does not constitute a solicitation of an offer to buy, or an offer to sell securities nor should the information be relied upon as investment advice. Past performance is no guarantee of future results. The statistics in this update are based on information believed to be reliable but not guaranteed.
This article is for information purposes. The information contained herein is not, and should not be construed as, investment, tax or legal advice to any party. Investments should be evaluated relative to the individual’s investment objectives and professional advice should be obtained with respect to any circumstance.
The BMO ETFs or securities referred to herein are not sponsored, endorsed or promoted by MSCI Inc. (“MSCI”), and MSCI bears no liability with respect to any such BMO ETFs or securities or any index on which such BMO ETFs or securities are based. The prospectus of the BMO ETFs contains a more detailed description of the limited relationship MSCI has with BMO Asset Management Inc. and any related BMO ETFs.
Commissions, management fees and expenses all may be associated with investments in exchange traded funds. Please read the ETF Facts or prospectus before investing. The indicated rates of return are the historical annual compounded total returns including changes in unit value and reinvestment of all dividends or distributions and do not take into account sales, redemption, distribution or optional charges or income taxes payable by any unitholder that would have reduced returns. Exchange traded funds are not guaranteed, their values change frequently and past performance may not be repeated.
For a summary of the risks of an investment in the BMO ETFs, please see the specific risks set out in the prospectus. BMO ETFs trade like stocks, fluctuate in market value and may trade at a discount to their net asset value, which may increase the risk of loss. Distributions are not guaranteed and are subject to change and/or elimination.
BMO ETFs are managed by BMO Asset Management Inc., which is an investment fund manager and a portfolio manager, and a separate legal entity from Bank of Montreal.
®/™Registered trade-marks/trade-mark of Bank of Montreal, used under licence.