The Quality Factor Shines Amidst the Artificial Intelligence Boom

The Quality Factor Shines Amidst the Artificial Intelligence Boom
The BMO MSCI Quality Index ETF suite (ZGQ, ZUQ and ZEQ) focuses on investing in high quality companies, defined by high return on equity, stable earnings that are less influenced by business cycles, and strong balance sheets with low leverage. Given these criteria, the composition of the Global and USA Quality indexes has been tilted towards the ‘Magnificent Seven’ – high quality growth names in tech such as Apple, Microsoft, and Meta — companies that are cash-rich, earnings growth machines. On the other hand, the sector composition is more balanced in Europe.
Funds
BMO MSCI All Country World High Quality Index ETF (Ticker: ZGQ)
BMO MSCI USA High Quality Index ETF (Ticker: ZUQ)
BMO MSCI Europe High Quality Hedged to CAD Index ETF (Ticker: ZEQ)
Quality Factor Features
- Long-term growth: Quality companies typically have low earnings variability, high margins and loyal consumer bases, giving them the capacity to invest heavily in growth projects and research and development.
- Reliable earnings: The Factor selects securities with solid fundamentals, stable earnings, and robust balance sheets, which can provide resilience during high market volatility.
- Lower risk profile: Despite being concentrated in more volatile sectors like Information Technology, the Quality Factor maintains lower risk profiles than Technology sector funds alone. The BMO Quality suite can also be seen as a ‘Medium’ risk method of accessing companies with high growth potential in popular sectors like Information Technology that would be otherwise rated ‘High’ risk on a standalone basis.
Quality Valuations Were Less Influenced by Long-Term Bond Yields in 2023
Because of its significant weighting in the Information Technology sector, the Quality suite did tremendously well in 2023. The surge in large-cap tech stocks — powered by investor optimism towards an artificial intelligence boom — helped the Quality factor outperform the broader benchmarks.
The ‘higher for longer’ mantra surrounding interest rates led to a surge in long-term yields that brought down the valuations of many other sectors in 2023, especially Utilities and Real Estate. Those sectors in particular can possess high leverage and have moderate earnings growth potential, two characteristics that Quality excludes.
ZGQ vs. MSCI ACWI Index
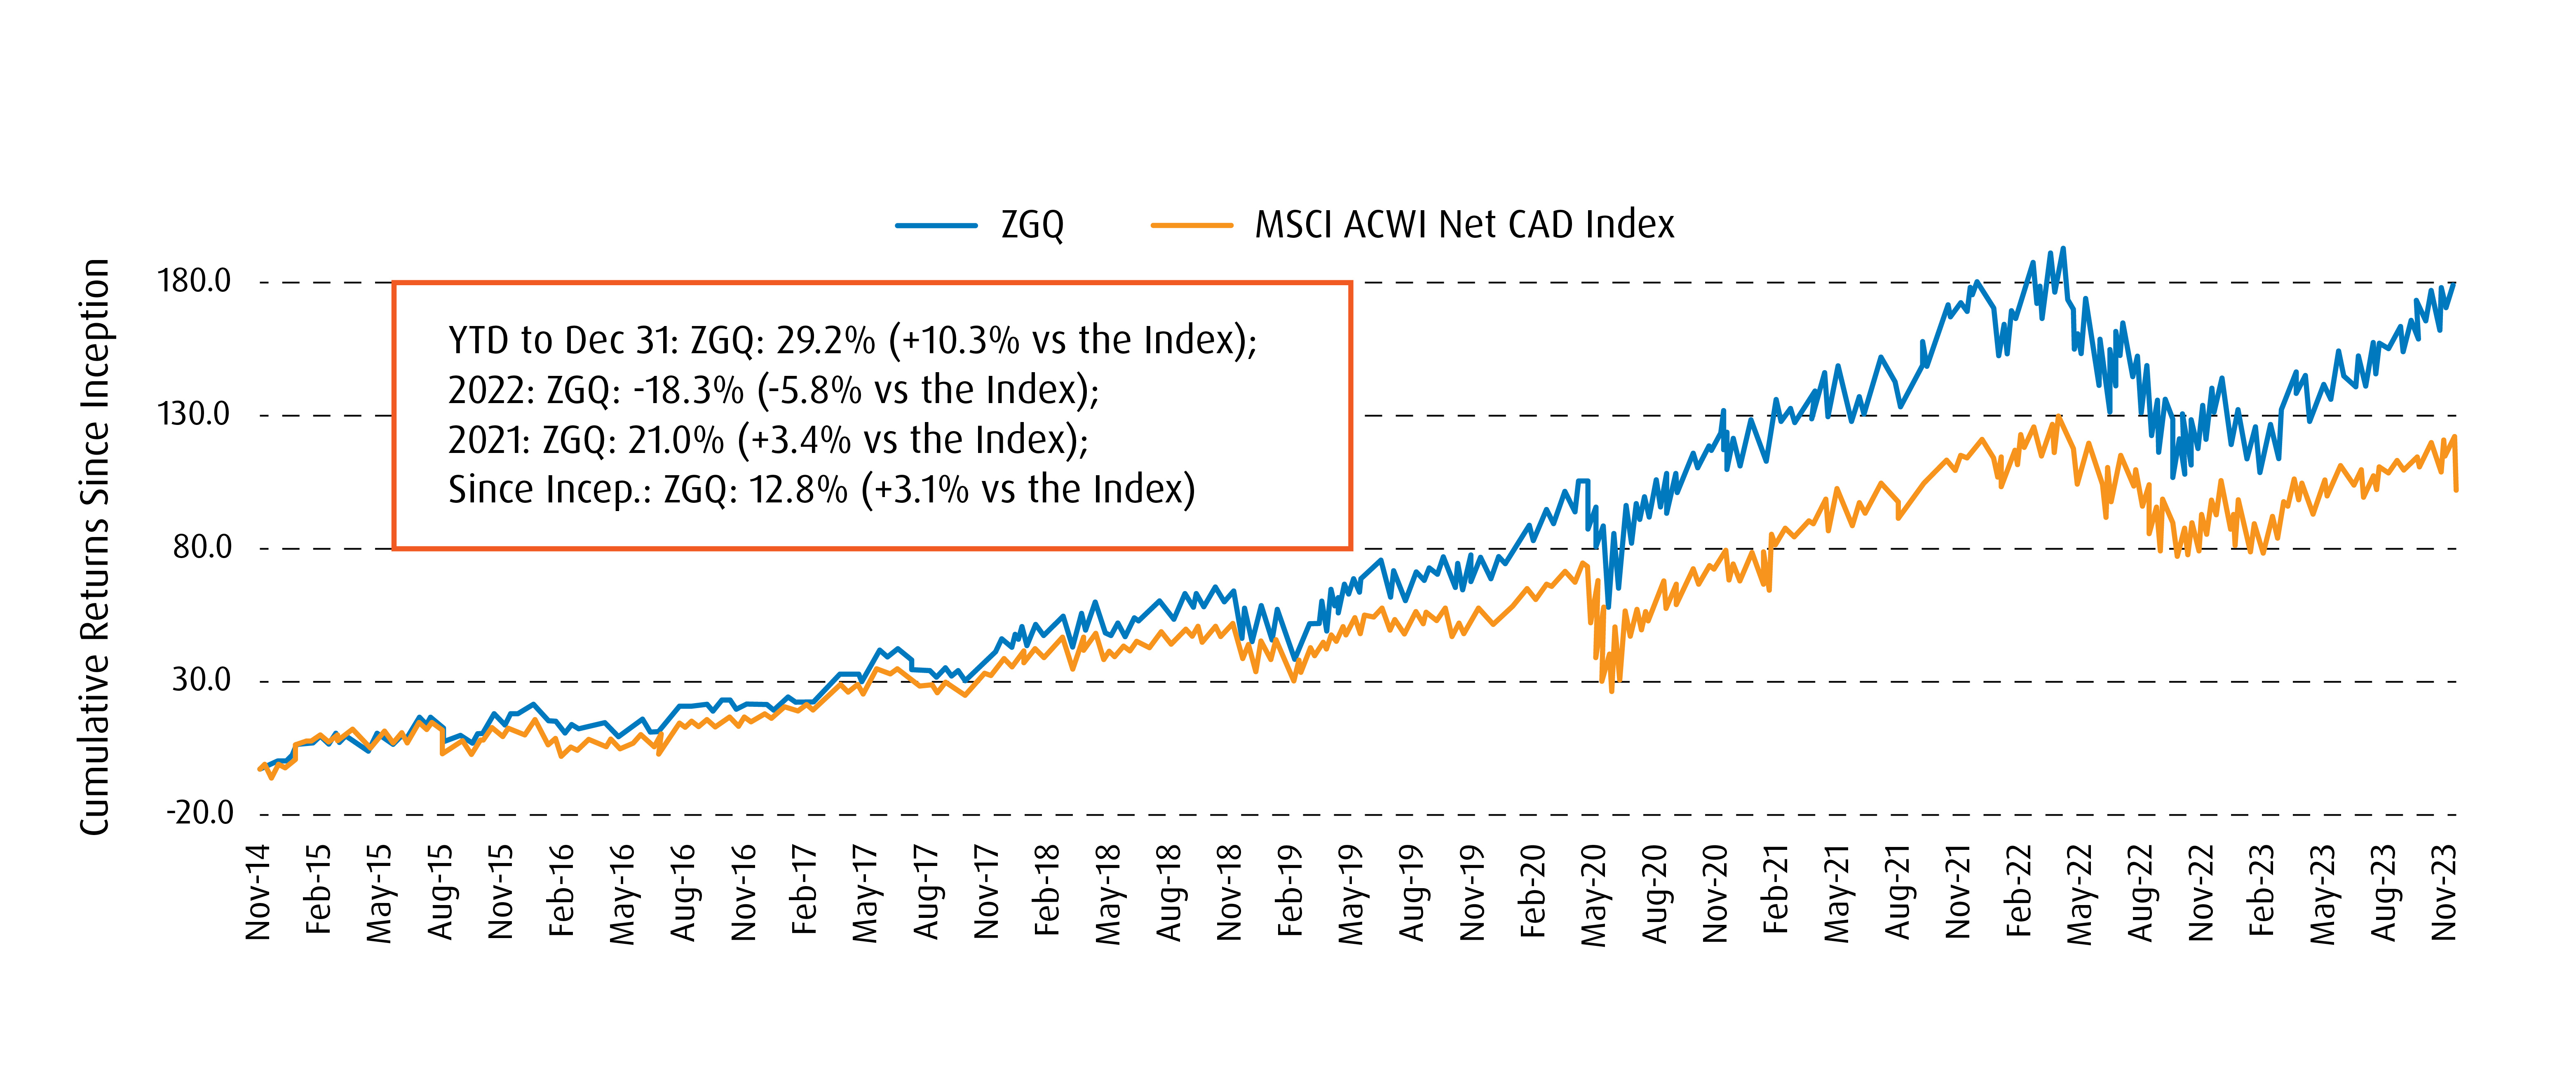
A comparison of the BMO MSCI All Country World High Quality Index ETF (ticker: ZGQ) clearly shows the relative outperformance that Quality experienced over the broader market.
ZUQ vs. MSCI USA Index
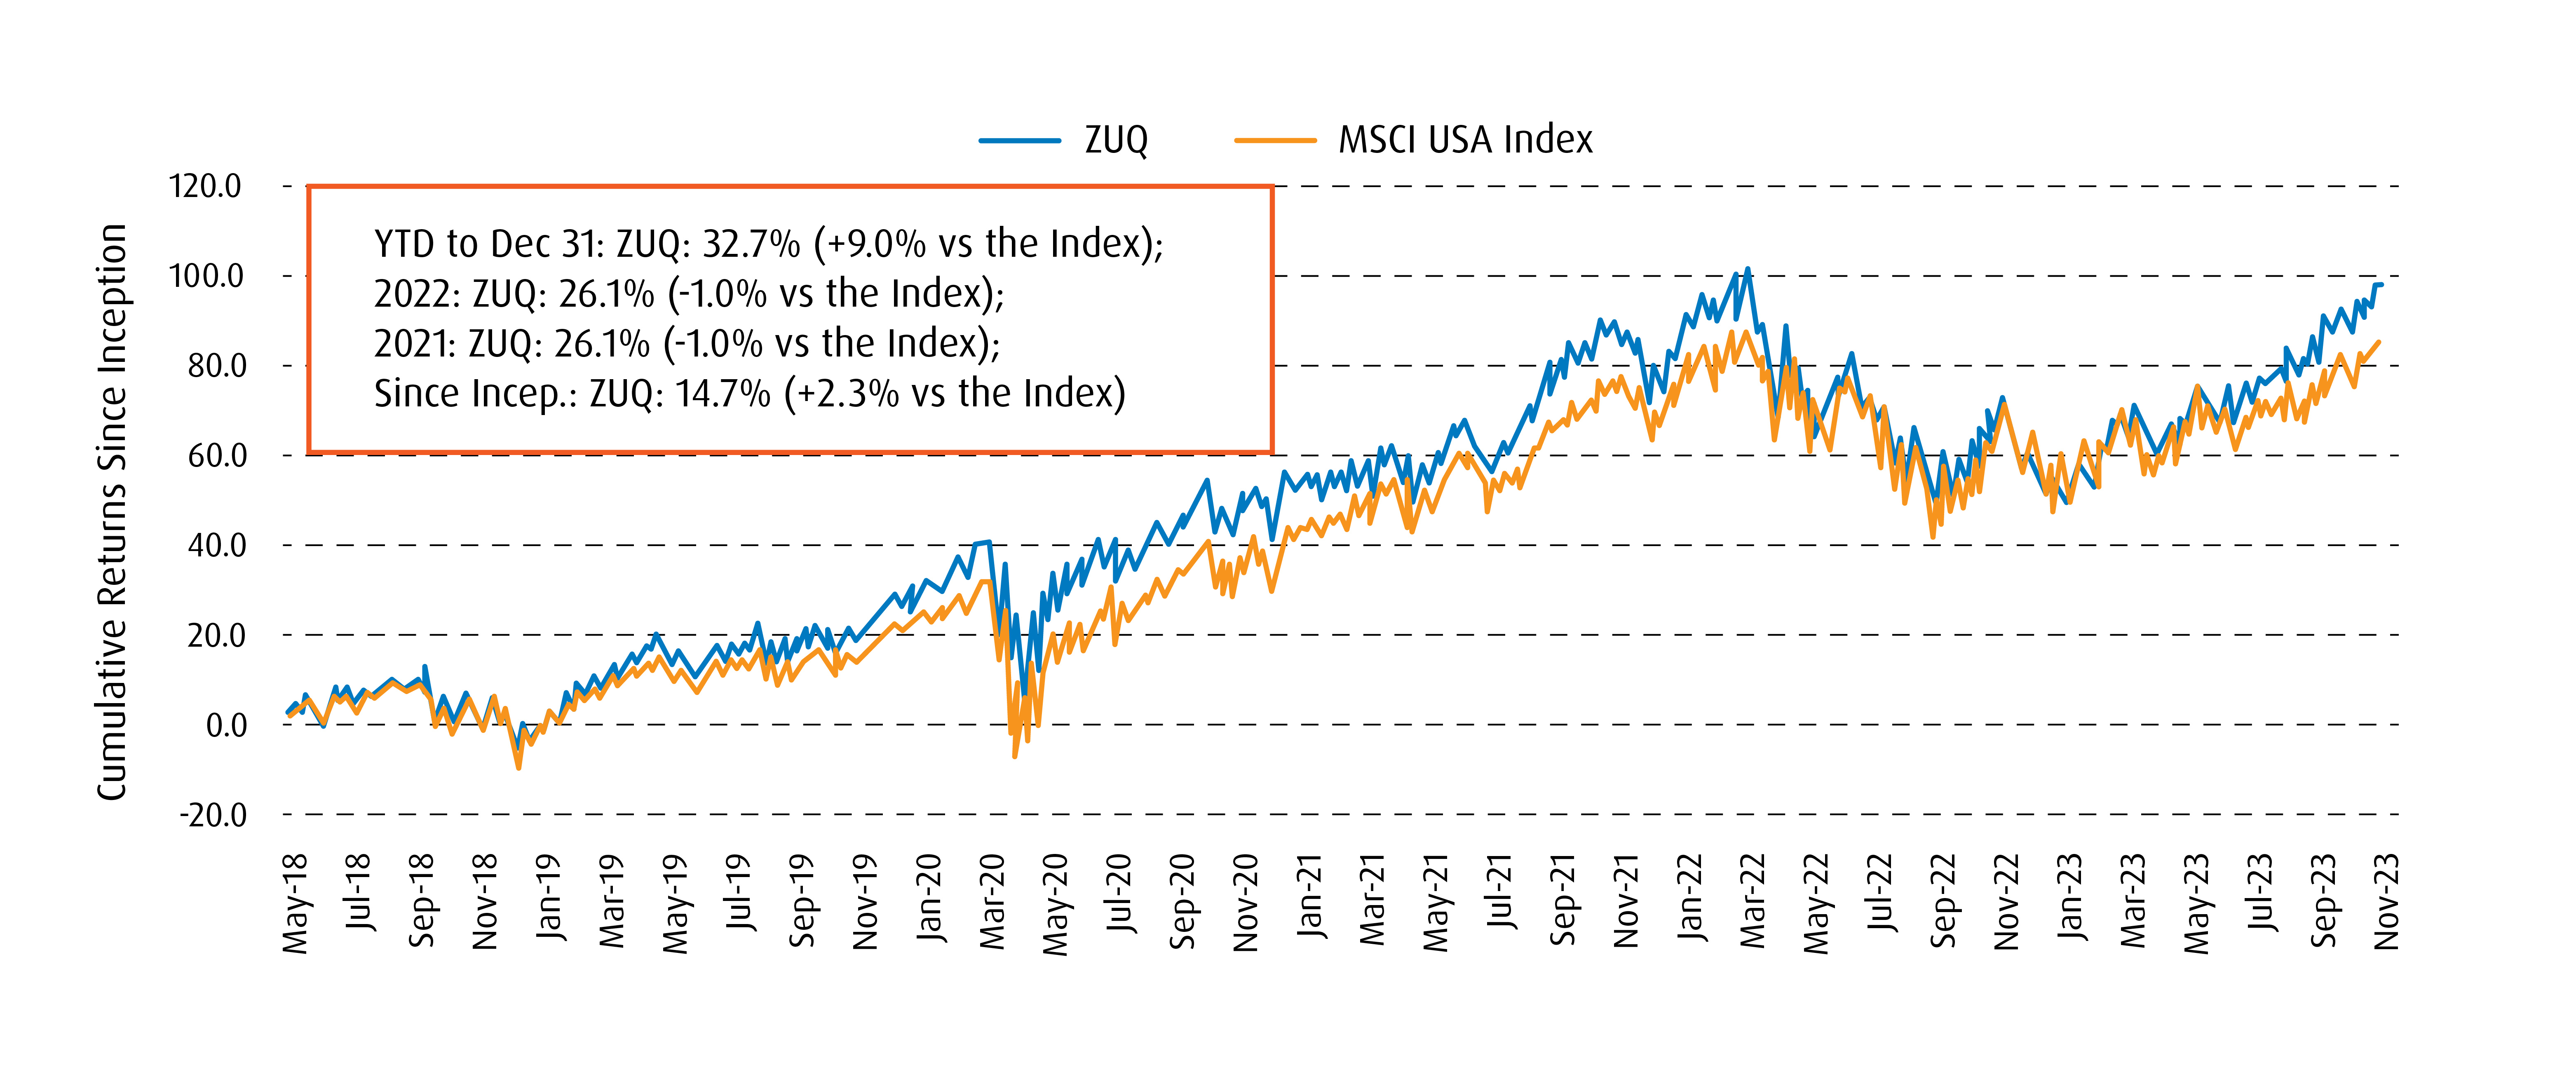
U.S.-based Quality similarly outgrew the wider market, as well, with the BMO MSCI USA High Quality Index ETF (ticker: ZUQ) outpacing the MSCI USA Index.
ZEQ vs. MSCI Europe Index
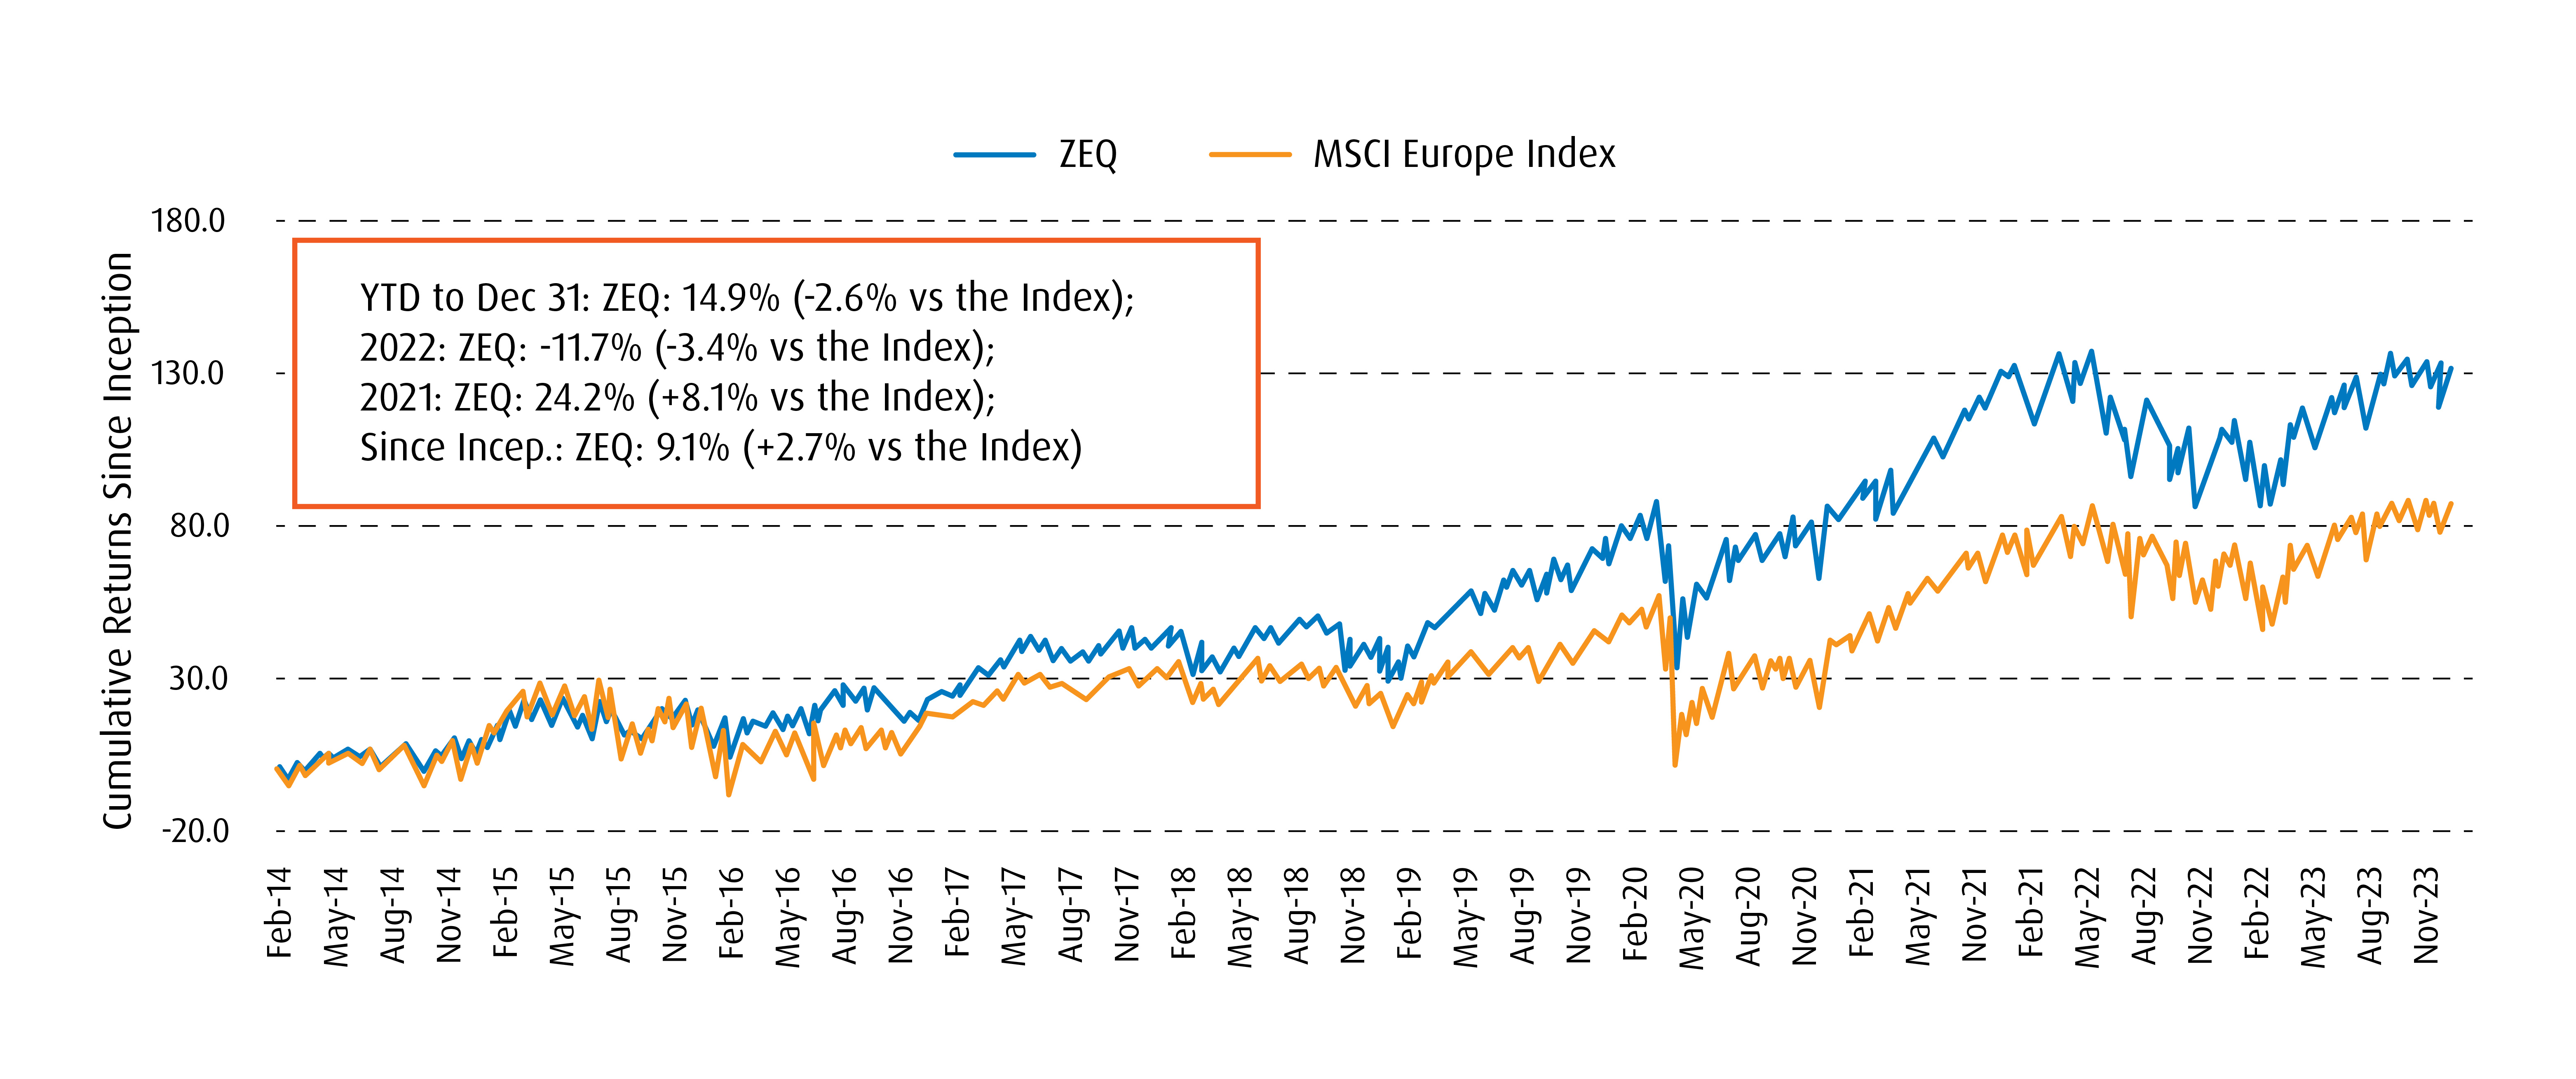
And again, Quality’s relative outperformance versus the broader market can be seen in Europe, where the BMO MSCI Europe High Quality Hedged to CAD Index ETF (Ticker: ZEQ) holds a long-term outperformance advantage.
Positioned for Long-Term Success
Quality is poised to thrive as large-cap technology names continue to play a pivotal role in the AI boom, and align with the Factor’s focus on stable earnings and robust financial health. In the evolving tech landscape, companies emphasizing innovation and efficiency, key features of Quality, are well-positioned for growth.
Additionally, in a high interest rate environment, the Quality factor also gains prominence by virtue of low leverage. As interest rates stay higher than historical norms, these companies are better able to weather economic uncertainties while continuing to invest in crucial research and development activities to grow.
Thus, investors prioritizing stability, risk management and strong financial fundamentals will find the BMO MSCI Quality Index ETFs – ZGQ, ZUQ and ZEQ – appealing for the long haul.
1 Standard performance data:
1-Yr |
3-Yr |
5-Yr |
10-Yr |
Since Inception |
|
ZGQ |
27.59% |
10.00% |
15.00% |
- |
13.45% |
2 Standard performance data:
1-Yr |
3-Yr |
5-Yr |
10-Yr |
Since Inception |
|
ZUQ |
33.71% |
13.74% |
16.94% |
- |
15.68% |
3 Standard performance data:
1-Yr |
3-Yr |
5-Yr |
10-Yr |
Since Inception |
|
ZEQ |
9.15% |
9.09% |
11.49% |
9.54% |
9.54% |
Disclosure:
Advisor Use Only.
Commissions, management fees and expenses all may be associated with investments in exchange traded funds. Please read the ETF Facts or prospectus of the BMO ETFs before investing. The indicated rates of return are the historical annual compounded total returns including changes in unit value and reinvestment of all dividends or distributions and do not take into account sales, redemption, distribution or optional charges or income taxes payable by any unitholder that would have reduced returns. Exchange traded funds are not guaranteed, their values change frequently and past performance may not be repeated.
For a summary of the risks of an investment in the BMO ETFs, please see the specific risks set out in the BMO ETF’s prospectus. BMO ETFs trade like stocks, fluctuate in market value and may trade at a discount to their net asset value, which may increase the risk of loss. Distributions are not guaranteed and are subject to change and/or elimination.
BMO ETFs are managed by BMO Asset Management Inc., which is an investment fund manager and a portfolio manager, and a separate legal entity from Bank of Montreal.
The BMO ETFs or securities referred to herein are not sponsored, endorsed or promoted by MSCI Inc. (“MSCI”), and MSCI bears no liability with respect to any such BMO ETFs or securities or any index on which such BMO ETFs or securities are based. The prospectus of the BMO ETFs contains a more detailed description of the limited relationship MSCI has with BMO Asset Management Inc. and any related BMO ETFs.
Any statement that necessarily depends on future events may be a forward-looking statement. Forward-looking statements are not guarantees of performance. They involve risks, uncertainties and assumptions. Although such statements are based on assumptions that are believed to be reasonable, there can be no assurance that actual results will not differ materially from expectations. Investors are cautioned not to rely unduly on any forward-looking statements. In connection with any forward-looking statements, investors should carefully consider the areas of risk described in the most recent simplified prospectus.
The viewpoints expressed by the Portfolio Manager represents their assessment of the markets at the time of publication. Those views are subject to change without notice at any time without any kind of notice. The information provided herein does not constitute a solicitation of an offer to buy, or an offer to sell securities nor should the information be relied upon as investment advice. Past performance is no guarantee of future results. This communication is intended for informational purposes only.
The communication is for information purposes. The information contained herein is not, and should not be construed as, investment, tax or legal advice to any party. Particular investments and/or trading strategies should be evaluated relative to the individual’s investment objectives and professional advice should be obtained with respect to any circumstance.
Risk tolerance measures the degree of uncertainty that an investor can handle regarding fluctuations in the value of their portfolio. The amount of risk associated with any particular investment depends largely on your own personal circumstances including your time horizon, liquidity needs, portfolio size, income, investment knowledge and attitude toward price fluctuations. Investors should consult their financial advisor before making a decision as to whether this Fund is a suitable investment for them.
BMO Global Asset Management is a brand name under which BMO Asset Management Inc. and BMO Investments Inc. operate.
®/TM Registered trademarks/trademark of Bank of Montreal, used under licence.