A Bull Case for Equal Weight: Earnings Momentum is Broadening Out
A long position equal-weight in U.S. equity cuts reliance on a small group of names needing to remain perfect. And as AI-related technologies diffuse into other sectors, there’s a strong case for broader earnings growth this year.


- U.S. equity markets are highly concentrated, with a handful of mega‑caps driving most of the S&P 500’s returns and risk.
- This concentration makes the index more fragile, as even small disappointments from the largest names can disproportionately move the market.
- Equal‑weight U.S. indices offer a compelling alternative, benefiting from broader earnings momentum, sector rotation, and a shift toward wider market participation moving deeper into 2026.
Early February marks the arrival of Groundhog Day, which makes fitting yet another reminder of how concentrated U.S. equity markets have become. That’s exactly the theme this note is focused on — along with a potential solution for clients who remain concerned about such risk.
Market concentration has been doing much of the heavy lifting for some time now. As shown in Chart 1, the combined weight of the top two sectors in the S&P 500 has climbed to over 45% — the highest level since the early 2000s. Today, Technology and Communications Services firms dominate the index, and if we dig deeper, the“Mag 7” have accounted for between 40 – 60% of the S&P 500’s total returns since 2022.
Chart 1 – S&P 500: Contribution Weights of the Top Two Sectors Since 1990
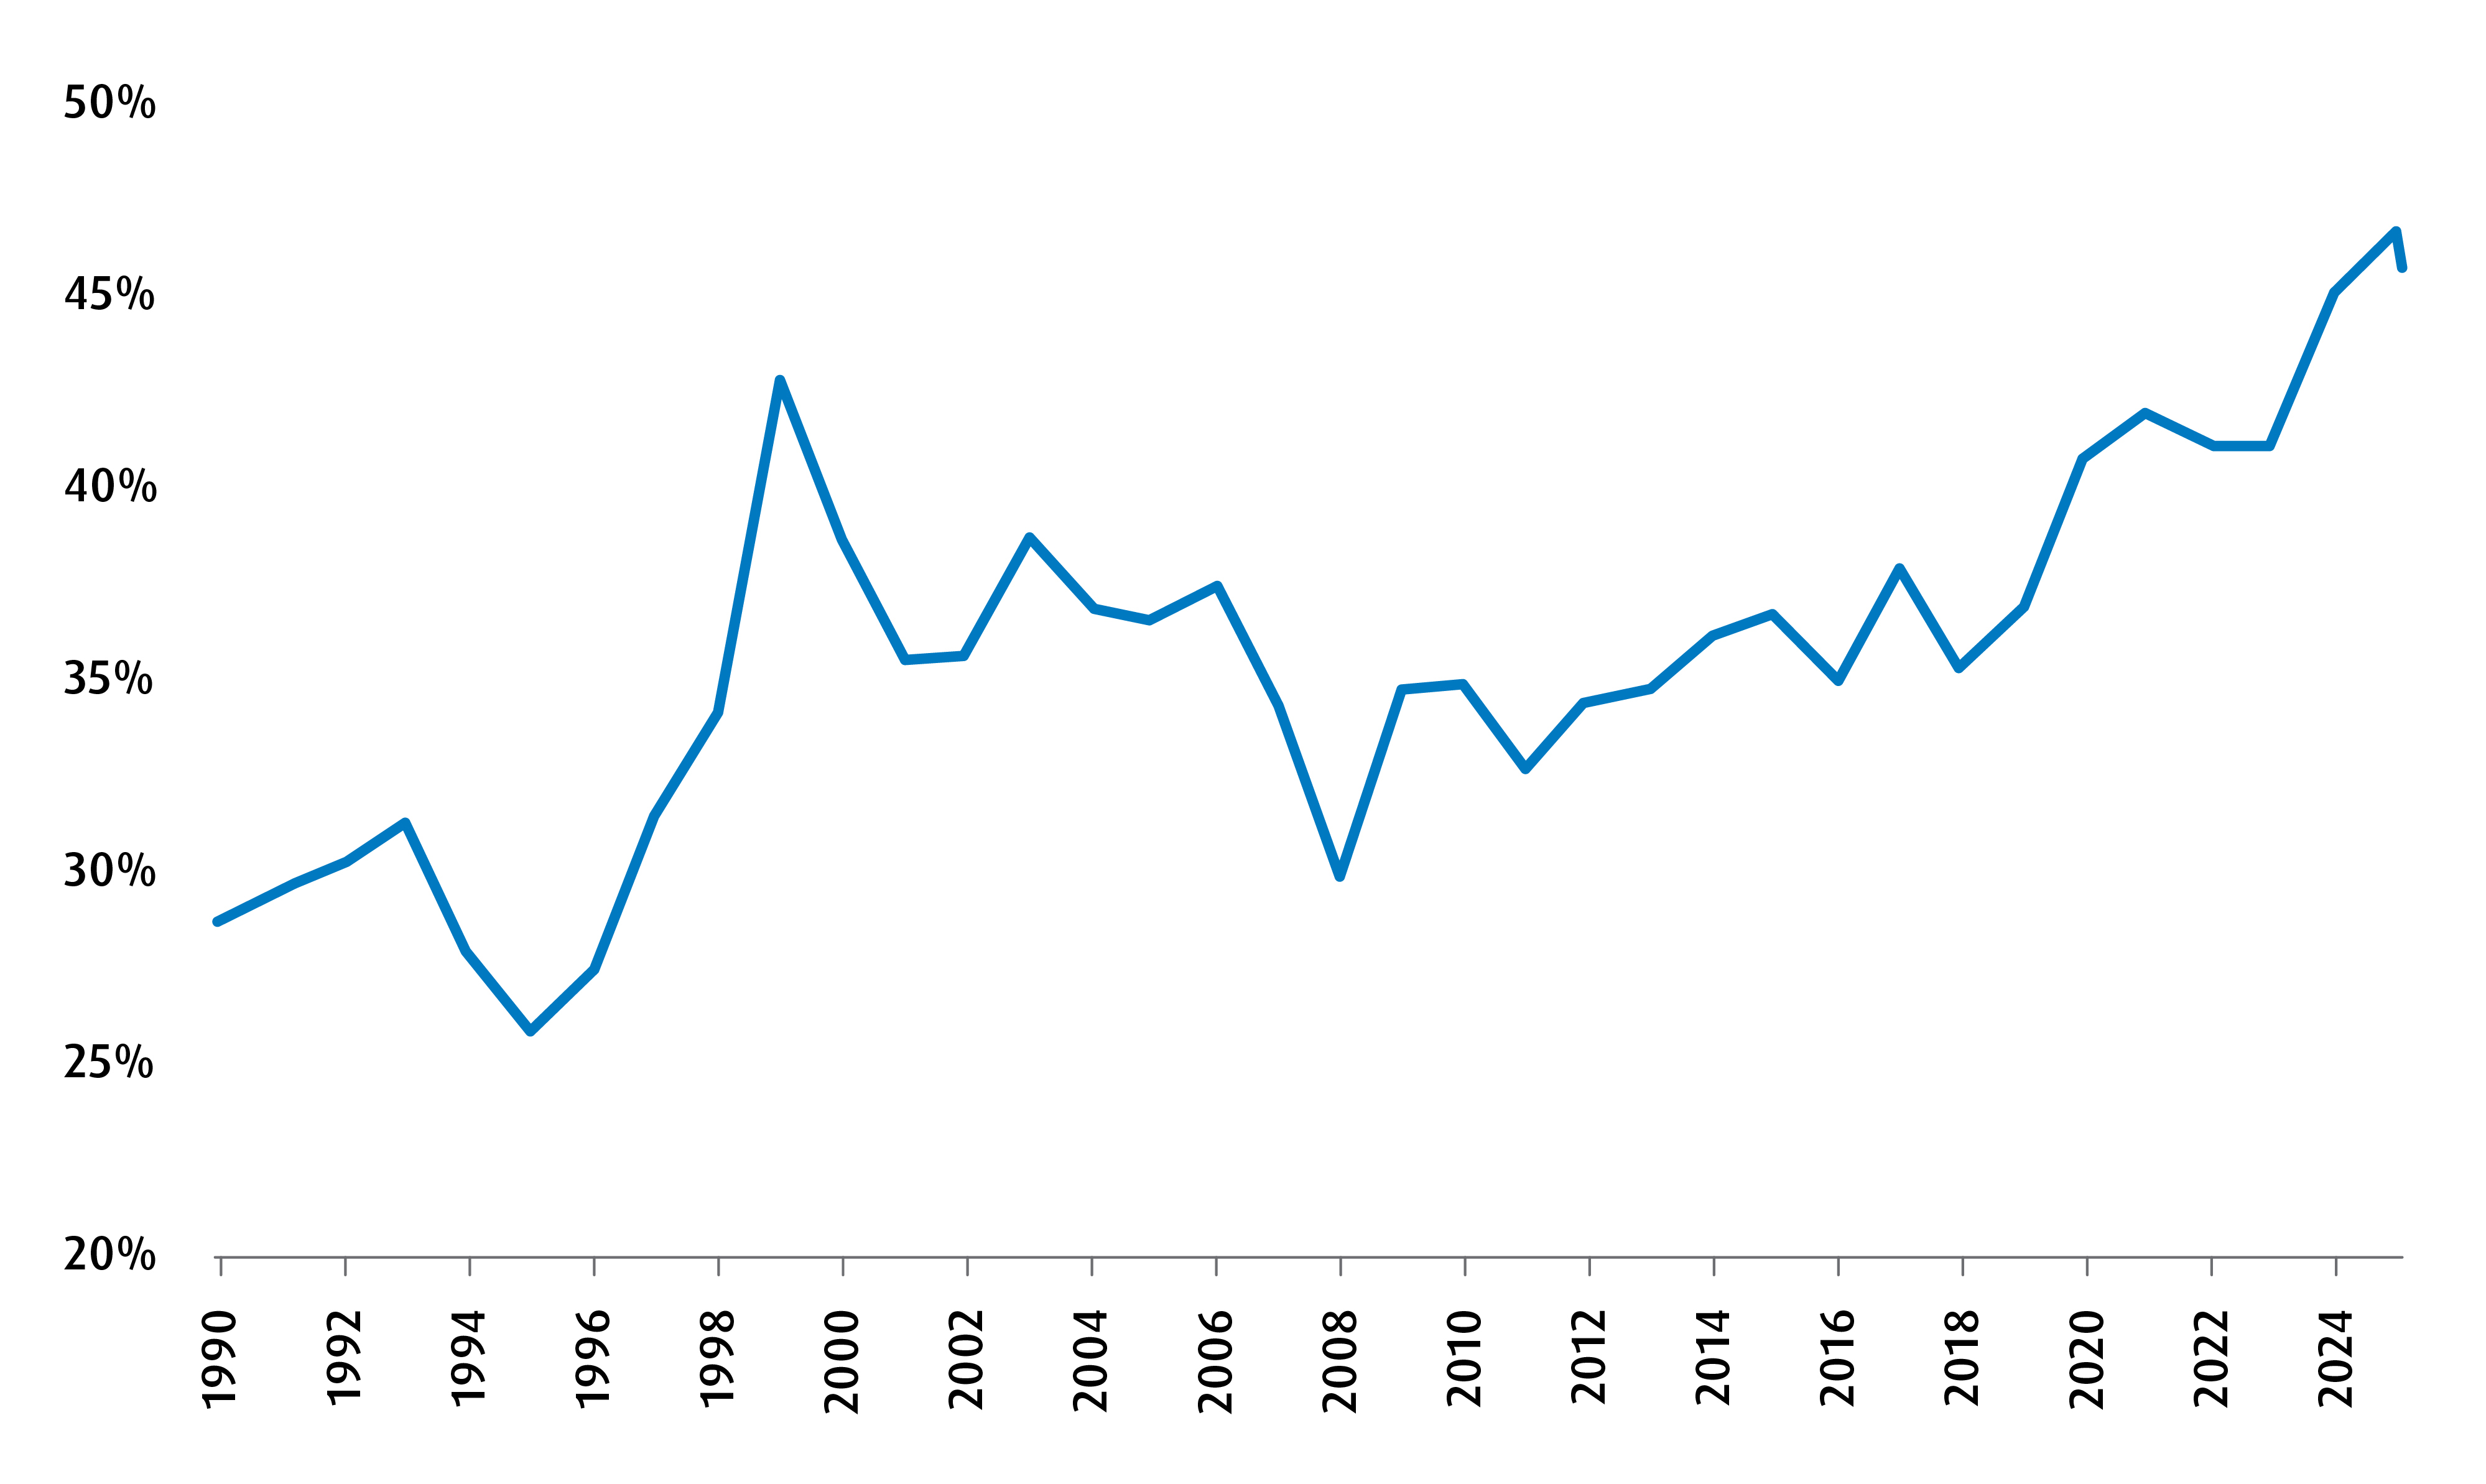
Given these figures, it’s fair to say the S&P 500 is no longer a broad market index. Instead, it’s become a handful of mega-cap stocks with an index attached.
The unhappy byproduct of this, of course, is that risks have become concentrated, as well. Take some of the most recent earnings releases, especially Microsoft’s. Despite beating expectations on both earnings and revenue, the stock sold off. Many attributed the reaction to rising AI‑related capital expenditures and the lack of a clear path to long-run profitability from those investments. With so much optimism already priced in, markets are now rewarding growth with lower risk — not increased spending and uncertainty. How else do we explain another potential quarter of double-digit earnings growth and only a +1.4% year-to-date return for the S&P 500?
This is one reason — among many — why we see greater potential in equal‑weighted U.S. equity indices versus market‑cap‑weighted ones. A long position in equal weight is effectively a bet that the average stock will do just fine, rather than a reliance on a small group of names needing to remain perfect. And as AI‑related technologies diffuse into other sectors, there’s a strong case for broader earnings momentum compared with what we’ve seen in recent years. That should support a rotation in market leadership away from Tech and Communications Services.
Are there other ways to play a“broadening out” of leadership in U.S. equities? Sure. Some may look at small- andmid-cap indices potentially. However, what concerns us about long positions in further down the cap spectrum that it wouldn’t be consistent with where we are in the U.S. macro cycle. We’d expect smalls/mids to outperform in the initial phases of a recovery after a slowdown – not in the late stages (which is where we’d surmise we are right now). The appeal of equal weight gauges is that they are less dependent on the phase of the cycle and more of a pure play on concentration risk.
From a sector standpoint, a shift toward equal weight also increases exposure to areas we are constructive on — such as Materials and Health Care — while reducing overweight exposure to Tech and Consumer Discretionary.
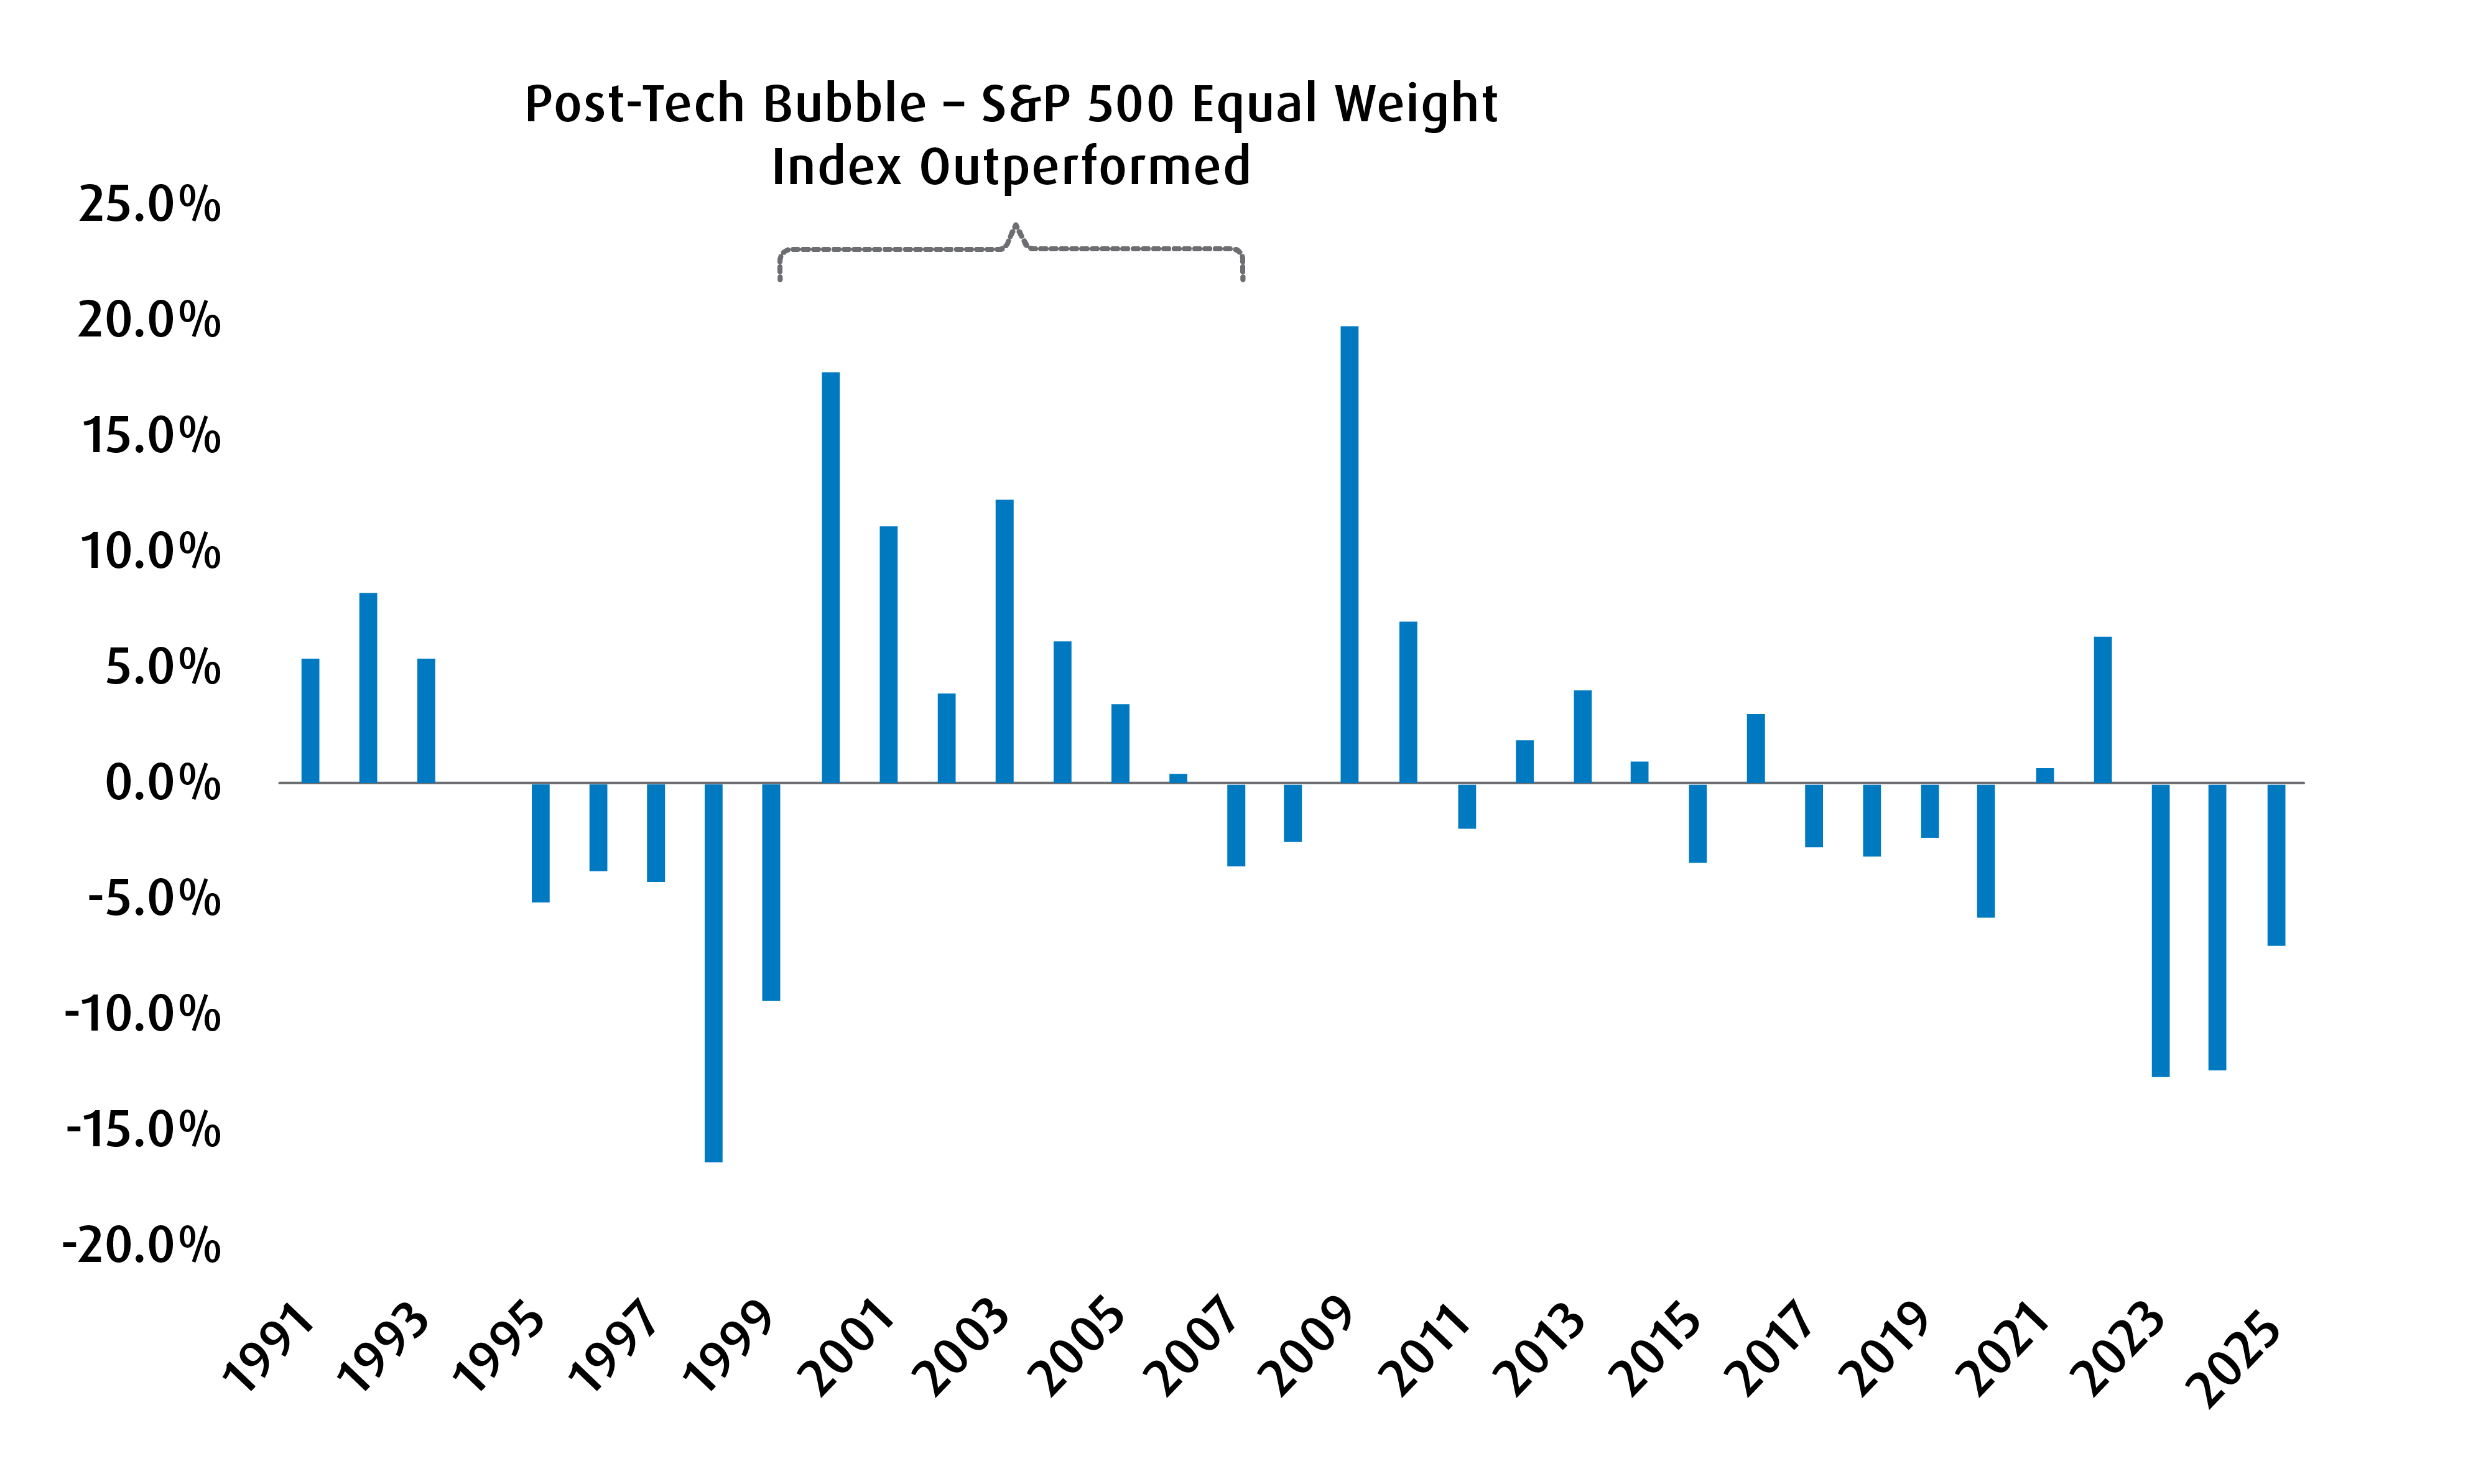
In terms of historical precedent, Chart 2 helps frame expectations. In the years following the tech bubble, earnings momentum broadened, market leadership expanded, and U.S. equal‑weight indices outperformed. All of this aligns well with a key theme we’ve highlighted in our recent work: broader participation and leadership in U.S. equities in 2026.
Chart 2 – S&P 500: Equal Weight Index Returns – Market Cap Weighted
For an allocation that expresses the above view, the new ZEQL delivers balanced U.S. equity exposure with equal weight across the U.S. market.
See here for more:
- The BMO MSCI USA Equal Weight Index ETF (Ticker: ZEQL)
For more market insights and commentary from BMO ETFs, please visit and bookmark Basis Points.
Disclaimers
For advisor use only.
This article is for information purposes only. The information contained herein is not, and should not be construed as investment, tax or legal advice to any party. Particular investments and/or trading strategies should be evaluated relative to the individual’s investment objectives and professional advice should be obtained with respect to any circumstance.
Any statement that necessarily depends on future events may be a forward-looking statement. Forward-looking statements are not guarantees of performance. They involve risks, uncertainties and assumptions. Although such statements are based on assumptions that are believed to be reasonable, there can be no assurance that actual results will not differ materially from expectations. Investors are cautioned not to rely unduly on any forward-looking statements. In connection with any forward-looking statements, investors should carefully consider the areas of risk described in the most recent prospectus.
The viewpoints expressed by the author represent their assessment of the markets at the time of publication. Those views are subject to change without notice at any time. The information provided herein does not constitute a solicitation of an offer to buy, or an offer to sell securities nor should the information be relied upon as investment advice. Past performance is no guarantee of future results. This communication is intended for informational purposes only.
The S&P 500 Index is an unmanaged index of 500 common stocks that is generally considered representative of the U.S. stock market. The index is heavily weighted toward stocks with large market capitalizations and represents approximately two-thirds of the total market value of all domestic common stocks.
The S&P 500 Index figures do not reflect any fees, expenses or taxes. An investor should consider investment objectives, risks, fees and expenses before investing.
You cannot invest directly in an index.
Commissions, management fees and expenses all may be associated with investments in exchange-traded funds. Please read the ETF Facts or prospectus of the BMO ETFs before investing. Exchange-traded funds are not guaranteed, their values change frequently and past performance may not be repeated.
For a summary of the risks of an investment in the BMO ETFs, please see the specific risks set out in the prospectus. BMO ETFs trade like stocks, fluctuate in market value and may trade at a discount to their net asset value, which may increase the risk of loss. Distributions are not guaranteed and are subject to change and/or elimination.
BMO ETFs are managed and administered by BMO Asset Management Inc., an investment fund manager and a portfolio manager, and a separate legal entity from Bank of Montreal.
BMO Global Asset Management is a brand name under which BMO Asset Management Inc. and BMO Investments Inc. operate.
“BMO (M-bar roundel symbol)” is a registered trademark of Bank of Montreal, used under licence.