Fixed Income Strategy Report (Q3 2025)
All prices, returns and portfolio weights are as of market close on June 30, 2025, unless otherwise indicated.


U.S. rates should outperform on a relative basis
- As the global trade paradigm shifts, countries are reassessing old economic configurations.
- Consider, that with the United States retreating from free trade, developed market economies can now expect the contribution from net trade to economic growth to decline in the coming years. Indeed, those same economies will now need to chart a different course as the degree of access to U.S. markets has changed dramatically.
- Additionally, the U.S. has sent signals that any geopolitical security guarantees could be more conditional than they have been.
- For these countries, one antidote to the new reality is to commit to increased spending and wider budget deficits. Several developed market economies have already taken steps in this direction by announcing massive spending programs aimed at boosting infrastructure and defense output.
- Germany and the U.K. are among the more notable examples, while Canadian PM Mark Carney was also elected in late April on a platform promising a heavy degree of spending on infrastructure and defense.
- NATO allies have also agreed to a new defense spending target of 5% of GDP.
- For the most part, these spending programs won’t have revenue offsets. This suggests wider budget deficits – with the takeaway being more bond issuance and supply that the rates markets will have to absorb. Indeed, we expect this to remain an important theme for several quarters to come.
- Meanwhile, in the U.S., the focus remains on the passage of the “One Big, Beautiful Bill” which will ensure that the Trump tax cuts from 2017 are extended instead of being allowed to expire at the end of this year, while also introducing new tax cuts and spending initiatives. Projections from the Congressional Budget Office suggest that debt could grow from 100% of GDP to 124% by 2034.
- The Treasury’s ‘Quarterly Refunding Announcement’ suggests that issuance should remain consistent for the coming quarters. Nevertheless, the expectation is that coupon issuance should rise into late-2025 and early 2026.
- However, there is a good chance that the supply/demand profile will look a bit different in the U.S. relative to other countries. The reason for this is that we expect that the Fed may need to ease a bit more than the market expects. At the same time, most developed market central banks are close to the end of their easing cycles (with the exception of Japan).
- The less advantageous supply/demand backdrop implies fixed income as an asset class might struggle. However, we do see scope for U.S. rates to outperform in the period ahead. As such, we have made some changes to our portfolio that reflect our more optimistic slant towards the U.S. – including establishing a new core position in ZUAG.F (BMO US Aggregate Bond Index ETF – hedged, for currency risk) as well as a new tactical position in ZAAA.F (BMO AAA CLO ETF – hedged, for currency risk).
- On the currency front, while we acknowledge near-term risks that the USD could rally as investors are short, we still expect the CAD to outperform in the coming quarters. As such, our preference is to hedge our U.S. rates exposure on a go-forward basis.
Fixed Income model portfolio
ETF Name |
Ticker |
Weight |
Duration |
YTM* |
Mgmt Fee |
Exposure |
Position |
|
BMO Discount Bond Index ETF |
ZDB |
5.0% |
7.12 |
3.40% |
0.09% |
Canada |
Core |
|
BMO Laddered Preferred Share Index ETF |
ZPR |
20.0% |
3.05 |
6.65% |
0.45% |
Canada |
Core |
|
BMO Canadian Bank Income Index ETF |
ZBI |
15.0% |
2.13 |
4.08% |
0.25% |
Canada |
Core |
|
BMO Short-Term US TIPS Index |
ZTIP |
15.0% |
2.35 |
4.06% |
0.20% |
United States |
Non-Traditional |
|
BMO US Aggregate Bond Index ETF (Hedged Units) |
ZUAG.F |
25.0% |
6.05 |
4.63% |
0.25% |
United States |
Core |
|
BMO AAA CLO ETF (Hedged Units) |
ZAAA.F |
20.0% |
0.13 |
5.35% |
0.20% |
United States |
Non-Traditional |
|
Total Portfolio |
100.0% |
3.18 |
4.95% |
0.26% |
BMO Global Asset Management. For illustrative purposes only. The information contained herein is not, and should not be construed as, investment, tax or legal advice to any party. These are not recommendations to buy or sell any particular security. Particular investments and/or trading strategies should be evaluated relative to the individual’s risk profile and investment objectives. Professional advice should be obtained with respect to any circumstance.
* Weighted average yield to maturity: The market value-weighted average yield to maturity includes coupon payments and any capital gain or loss that the investor will realize by holding the bonds to maturity.
Source: Bloomberg, BMO Asset Management Inc., as of June 30, 2025.
Performance (%)
Ticker |
Year-to-date |
1-month |
3-month |
6-month |
1-year |
3-year |
5-year |
10-year |
Since inception |
Inception date |
ZDB |
1.38 |
0.01 |
-0.62 |
1.38 |
6.00 |
4.24 |
-0.46 |
1.75 |
2.30 |
02/10/14 |
ZPR |
8.03 |
2.98 |
5.78 |
8.03 |
18.50 |
9.87 |
12.93 |
4.99 |
2.98 |
11/14/12 |
ZBI |
2.44 |
0.62 |
1.29 |
2.44 |
7.71 |
6.23 |
- |
- |
3.90 |
02/07/22 |
ZTIP |
-1.49 |
-0.29 |
-4.47 |
-1.49 |
5.92 |
5.83 |
- |
- |
5.09 |
01/20/21 |
ZUAG.F |
3.16 |
1.36 |
0.75 |
3.16 |
4.36 |
- |
- |
- |
1.91 |
01/23/23 |
ZAAA.F |
Returns are not available as there is less than one year’s performance data. |
04/30/25 |
||||||||
Source: Bloomberg, as of June 30, 2025. Past Performance is not indicative of future results.
Credit Summary
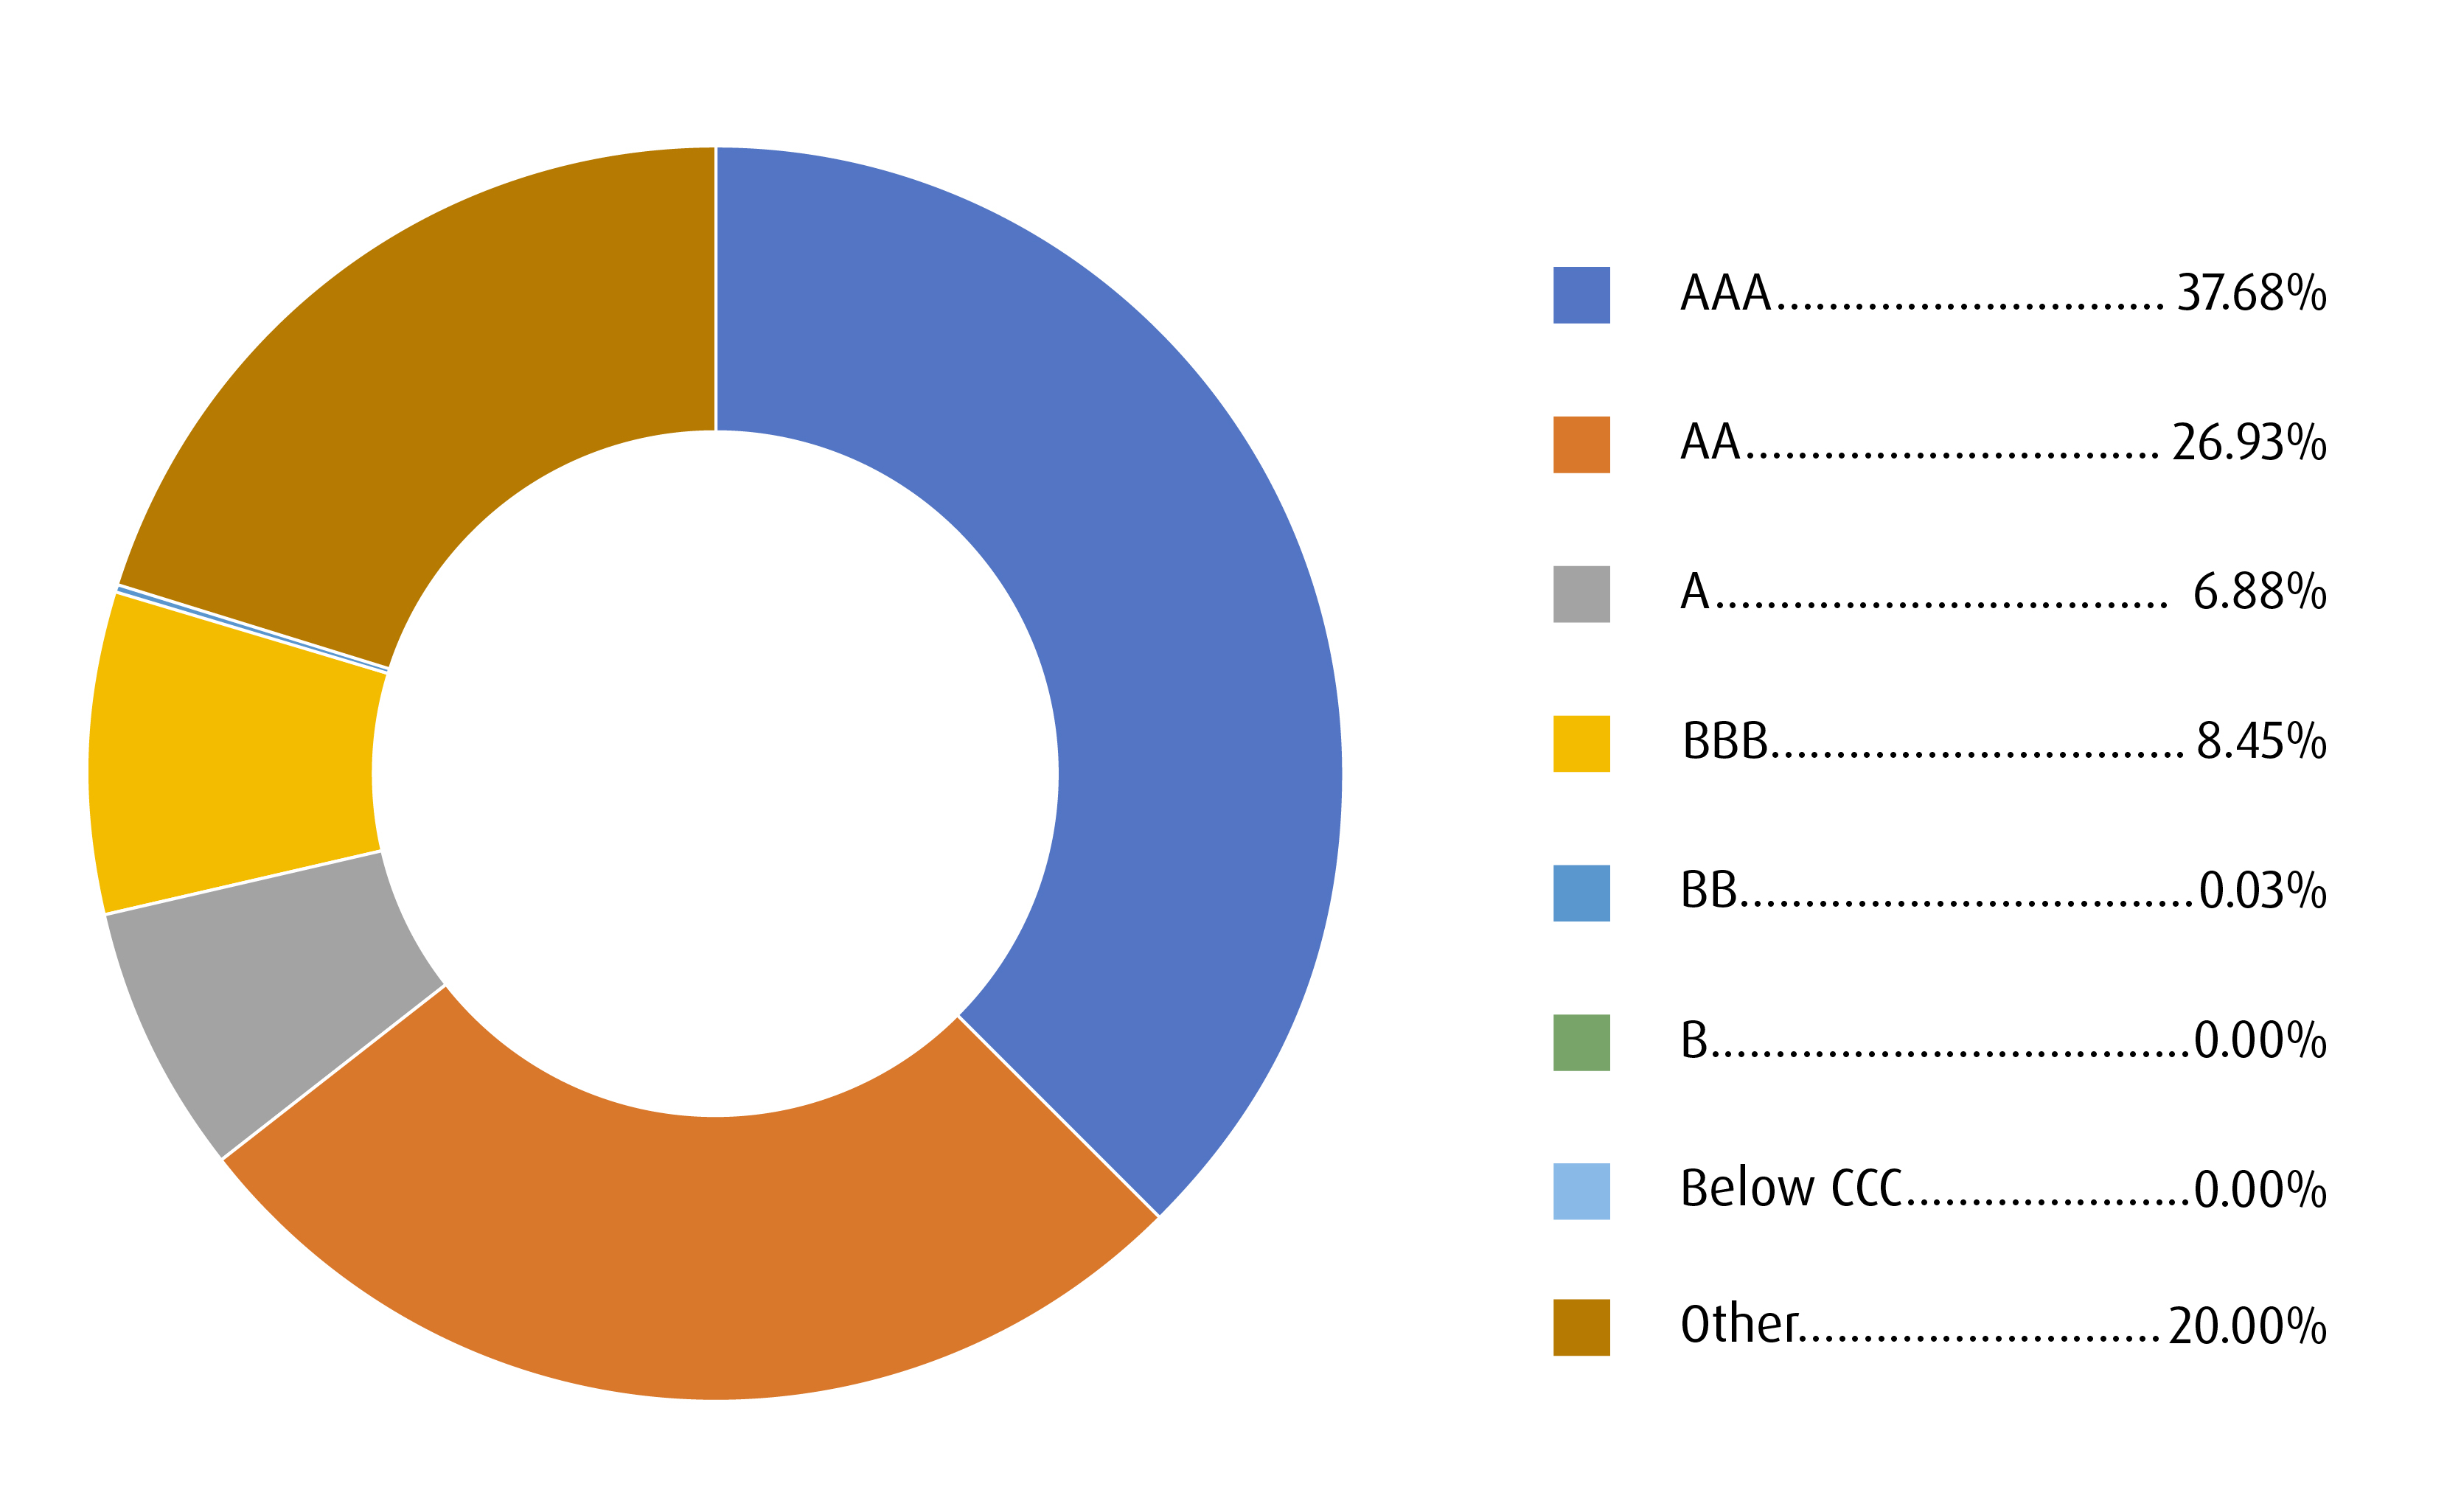
Credit quality summary of model fixed income portfolio. Ratings are composite scoring from various ratings agencies for the underlying securities. BMO Global Asset Management. Bloomberg, June 30, 2025.
Term Summary
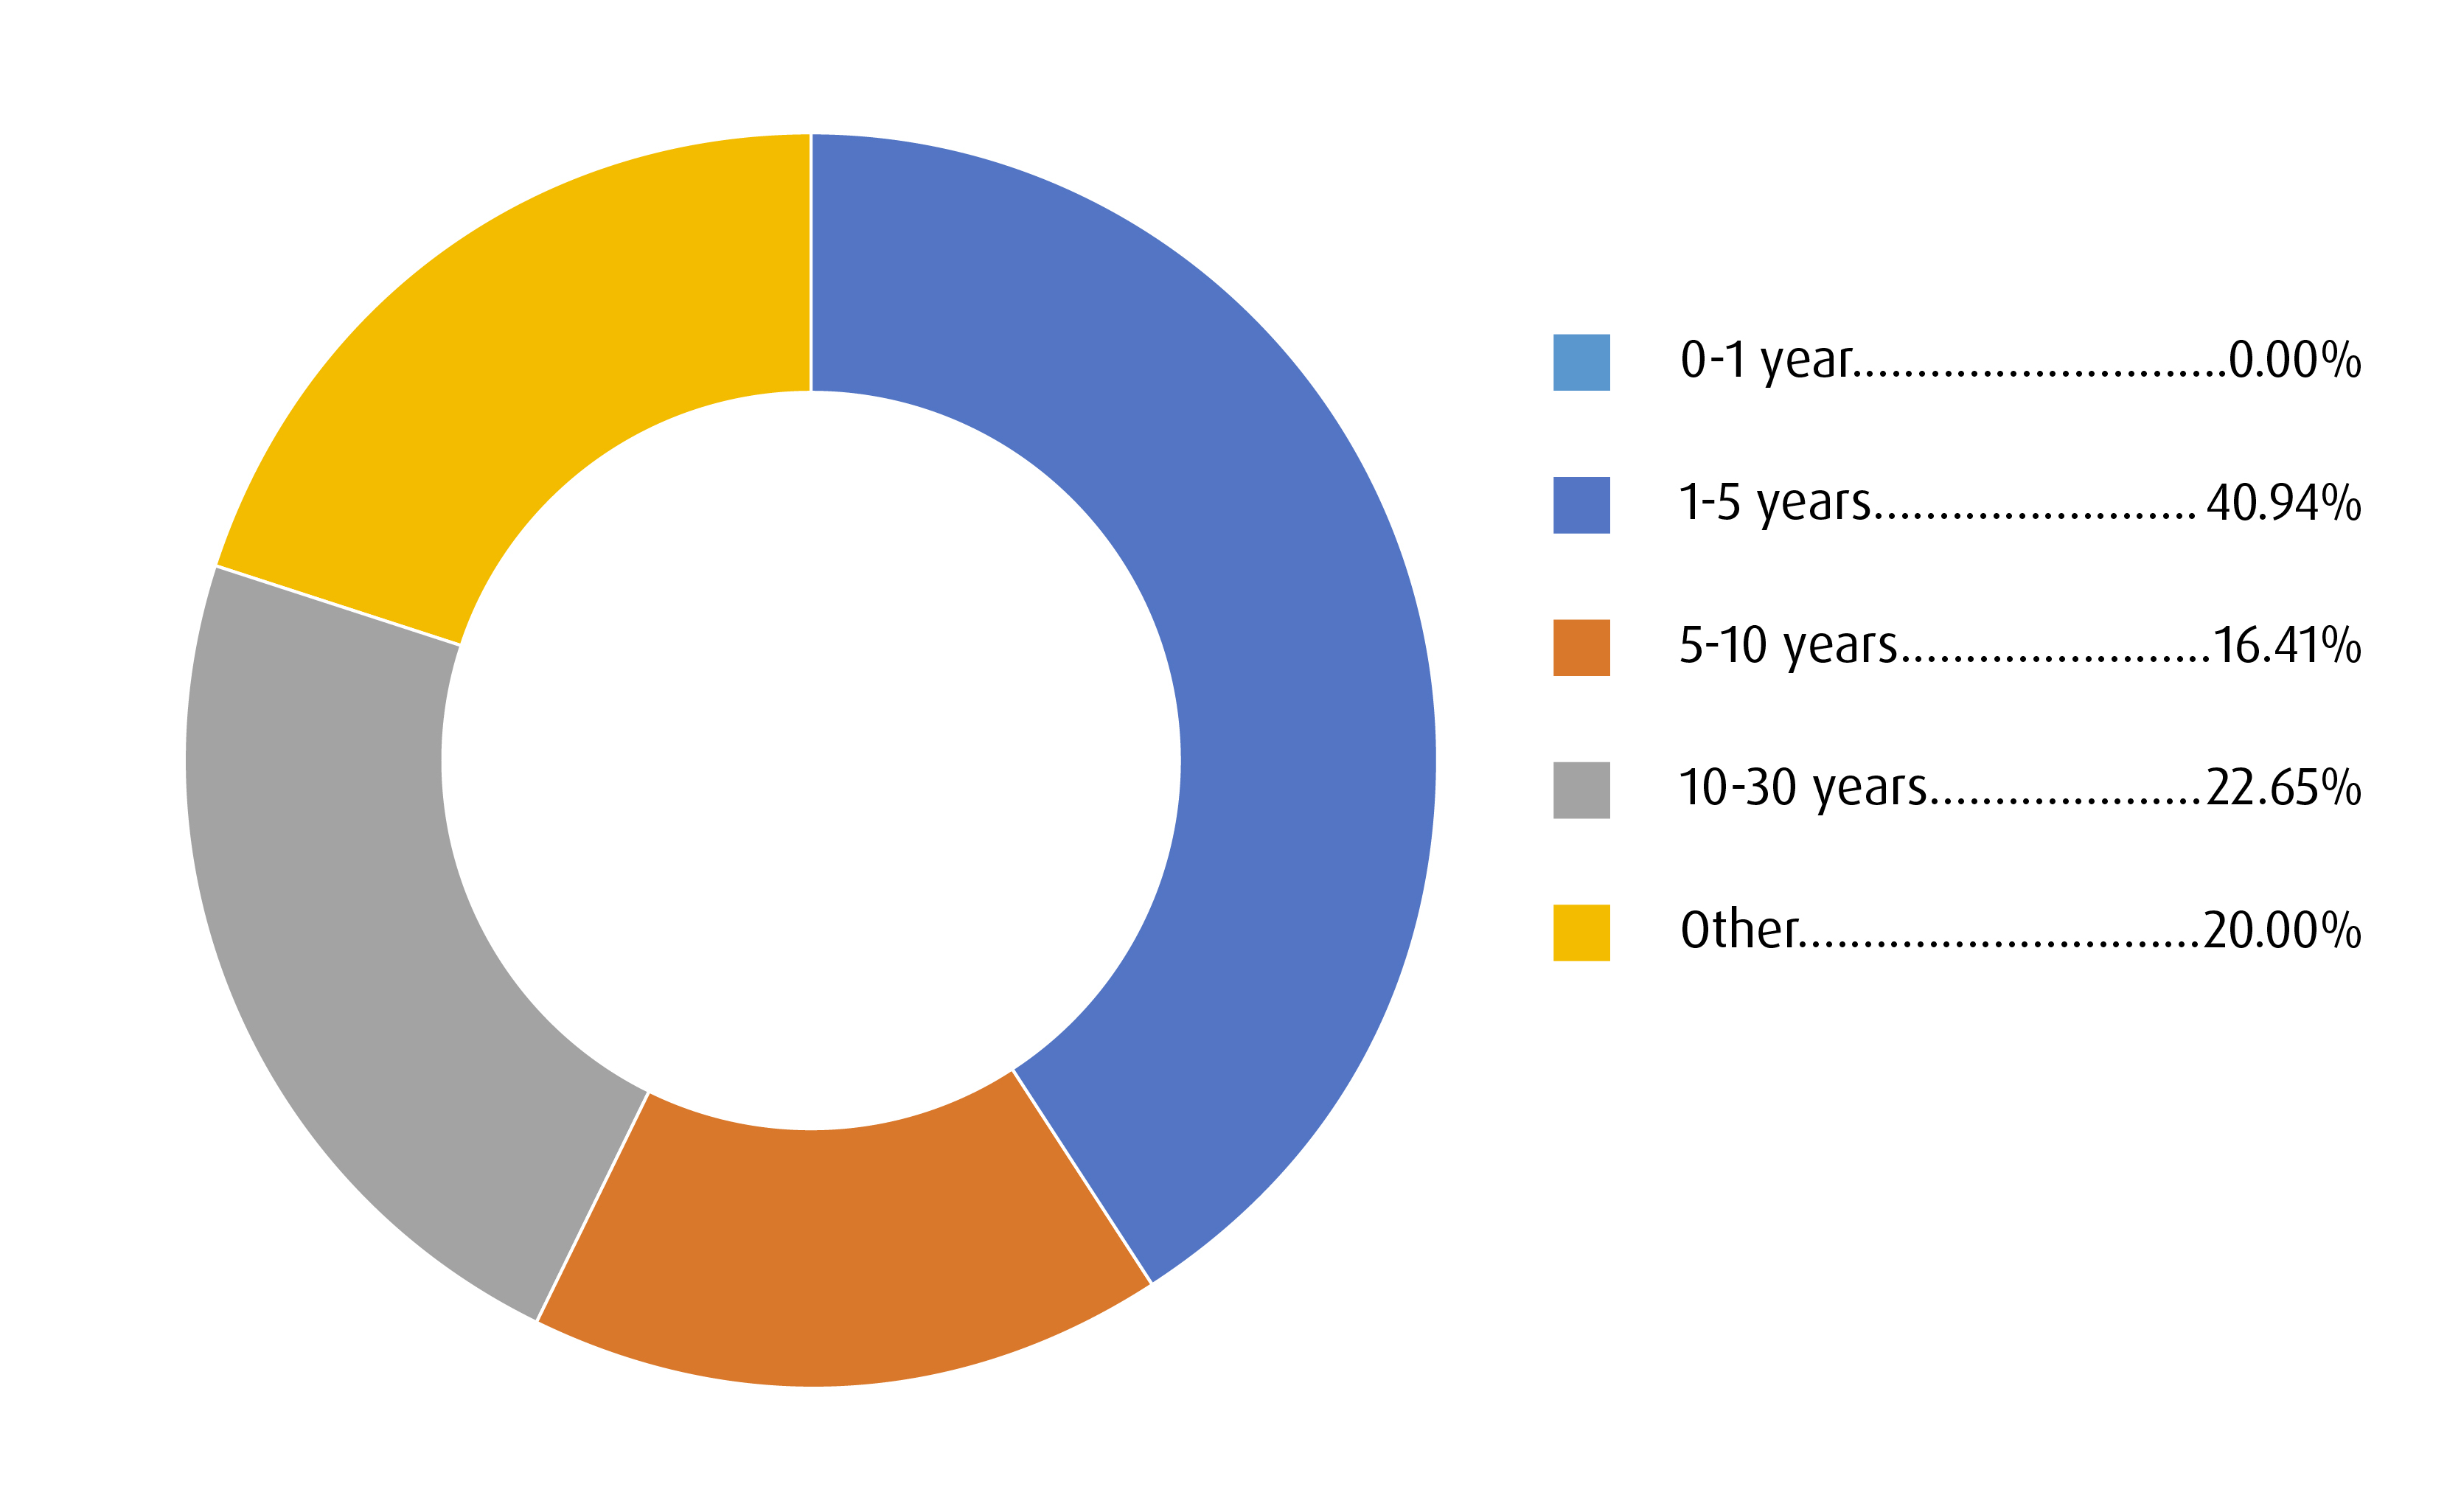
Term summary showing breakdown of average duration of model portfolio securities.
BMO Global Asset Management, Bloomberg, as of June 30, 2025.
Visit bmo.com/etfs or contact Client Services at 1−800−361−1392.
To listen to our Views From the Desk Podcast, please visit bmoetfs.ca.
BMO ETF Podcasts are also available on


Disclaimers
For advisor use only.
The portfolio holdings are subject to change without notice and only represent a small percentage of portfolio holdings. They are not recommendations to buy or sell any particular security.
Any statement that necessarily depends on future events may be a forward-looking statement. Forward-looking statements are not guarantees of performance. They involve risks, uncertainties and assumptions. Although such statements are based on assumptions that are believed to be reasonable, there can be no assurance that actual results will not differ materially from expectations. Investors are cautioned not to rely unduly on any forward-looking statements. In connection with any forward-looking statements, investors should carefully consider the areas of risk described in the most recent prospectus.
This communication is intended for informational purposes only and is not, and should not be construed as, investment and/or tax advice to any individual. Particular investments and/or trading strategies should be evaluated relative to each individual’s circumstances. Individuals should seek the advice of professionals, as appropriate, regarding any particular investment. Investors cannot invest directly in an index.
The viewpoints expressed by the author represents their assessment of the markets at the time of publication. Those views are subject to change without notice at any time without any kind of notice. The information provided herein does not constitute a solicitation of an offer to buy, or an offer to sell securities nor should the information be relied upon as investment advice. Past performance is no guarantee of future results.
Index returns do not reflect transactions costs or the deduction of other fees and expenses and it is not possible to invest directly in an Index. Past performance is not indicative of future results.
Commissions, management fees and expenses all may be associated with investments in exchange traded funds. Please read the ETF Facts or prospectus of the BMO ETFs before investing. The indicated rates of return are the historical annual compounded total returns including changes in unit value and reinvestment of all dividends or distributions and do not take into account sales, redemption, distribution or optional charges or income taxes payable by any unitholder that would have reduced returns. Exchange traded funds are not guaranteed, their values change frequently and past performance may not be repeated.
For a summary of the risks of an investment in the BMO ETFs, please see the specific risks set out in the BMO ETF’s prospectus. BMO ETFs trade like stocks, fluctuate in market value and may trade at a discount to their net asset value, which may increase the risk of loss. Distributions are not guaranteed and are subject to change and/or elimination.
CLOs are floating- or fixed-rate debt securities issued in different tranches, with varying degrees of risk, by trusts or other special purpose vehicles (“CLO Issuers”) and backed by an underlying portfolio consisting primarily of below investment grade corporate loans. The BMO ETF pursues its investment objective by investing, under normal circumstances, at least 85% of its net assets in CLOs that, at the time of purchase, are rated AAA or the equivalent by a nationally recognized statistical rating organization.
AAA herein refers to the order of payments, should there be any defaults, and does not represent the ratings of the underlying loans within the CLO. If there are loan defaults or the CLO Issuer’s collateral otherwise underperforms, scheduled payments to senior tranches take precedence over those of mezzanine tranches (a tranche or tranches subordinated to the senior tranche), and scheduled payments to mezzanine tranches take precedence over those to subordinated/equity tranches. The riskiest portion is the “Equity” tranche, which bears the first losses and is expected to bear all or the bulk of defaults from the corporate loans held by the CLO Issuer serves to protect the other, more senior tranches from default.
Distribution yields are calculated by using the most recent regular distribution, or expected distribution, (which may be based on income, dividends, return of capital, and option premiums, as applicable) and excluding additional year end distributions, and special reinvested distributions annualized for frequency, divided by current net asset value (NAV). The yield calculation does not include reinvested distributions. Distributions are not guaranteed, may fluctuate and are subject to change and/or elimination. Distribution rates may change without notice (up or down) depending on market conditions and NAV fluctuations. The payment of distributions should not be confused with the BMO ETF’s performance, rate of return or yield. If distributions paid by a BMO ETF are greater than the performance of the investment fund, your original investment will shrink. Distributions paid as a result of capital gains realized by a BMO ETF, and income and dividends earned by a BMO ETF, are taxable in your hands in the year they are paid. Your adjusted cost base will be reduced by the amount of any returns of capital. If your adjusted cost base goes below zero, you will have to pay capital gains tax on the amount below zero.
Cash distributions, if any, on units of a BMO ETF (other than accumulating units or units subject to a distribution reinvestment plan) are expected to be paid primarily out of dividends or distributions, and other income or gains, received by the BMO ETF less the expenses of the BMO ETF, but may also consist of non-taxable amounts including returns of capital, which may be paid in the manager’s sole discretion. To the extent that the expenses of a BMO ETF exceed the income generated by such BMO ETF in any given month, quarter, or year, as the case may be, it is not expected that a monthly, quarterly, or annual distribution will be paid. Distributions, if any, in respect of the accumulating units of BMO Short Corporate Bond Index ETF, BMO Short Federal Bond Index ETF, BMO Short Provincial Bond Index ETF, BMO Ultra Short-Term Bond ETF and BMO Ultra Short-Term US Bond ETF will be automatically reinvested in additional accumulating units of the applicable BMO ETF. Following each distribution, the number of accumulating units of the applicable BMO ETF will be immediately consolidated so that the number of outstanding accumulating units of the applicable BMO ETF will be the same as the number of outstanding accumulating units before the distribution. Non-resident unitholders may have the number of securities reduced due to withholding tax. Certain BMO ETFs have adopted a distribution reinvestment plan, which provides that a unitholder may elect to automatically reinvest all cash distributions paid on units held by that unitholder in additional units of the applicable BMO ETF in accordance with the terms of the distribution reinvestment plan. For further information, see the distribution policy in the BMO ETFs’ prospectus.
BMO ETFs are managed and administered by BMO Asset Management Inc., an investment fund manager and a portfolio manager, and a separate legal entity from Bank of Montreal.
BMO Global Asset Management is a brand name under which BMO Asset Management Inc. and BMO Investments Inc. operate.
“BMO (M-bar roundel symbol)” is a registered trademark of Bank of Montreal, used under licence.