BMO ETFs Tax Efficient Model – Strategy Report (Q3 2026)
All prices, returns and portfolio weights are as of market close on June 30, 2026, unless otherwise indicated.


- This is the fourth quarter on record for our ‘Tax Efficient’ portfolio. For those of you not familiar with it — this portfolio follows the same core framework and rationale as our Macro Regime Balanced portfolio. The difference is that we optimize for tax efficiency for Canadian investors.
- We’ve made a few changes from the Q2 edition. In the fixed income sleeve, we’ve removed our tactical position in ZTIP (BMO Short-Term US TIPS Index ETF), reflecting our view that markets may re-price the US neutral rate higher in the coming quarters.
- We’ve increased our exposure to Canadian fixed income by increasing our allocation to ZDB (BMO Discount Bond Index ETF) and ZCDB (BMO Corporate Discount Bond ETF). We remain of the view that Canadian fixed income can outperform most other markets in the coming months due to an uncertain trade backdrop amidst upcoming United States-Mexico-Canada Agreement (USMCA) talks.
- In the equity sleeve, we’ve modestly increased our exposure to ZWT (BMO Covered Call Technology ETF). We remain bullish on the artificial intelligence (AI) story — particularly for those firms that are upstream (semiconductor firms particularly).
- We’ve trimmed our capital allocation to alts for this quarter. Put simply, we feel that volatility remains elevated in the space and we’d rather enter the coming quarter with less of a risk allocation there for now. As such, we’ve slightly trimmed our allocation to ZCOM (BMO Broad Commodity ETF) and ZWGD (BMO Covered Call Spread Gold Bullion ETF).
Table 1 – Tax Efficient Portfolio for Q3 2026
| Ticker | ETF Name | Sector Positioning | Management Fee | Weight (%) | |
| Fixed Income | |||||
| ZDB | BMO Discount Bond Index ETF | Fixed Income | Core | 0.09% | 12.50% |
| ZCDB | BMO Corporate Discount Bond ETF | Fixed Income | Tactical | 0.15% | 12.50% |
| Total Fixed Income | 25.00% | ||||
| Equities | |||||
| ZUQ | BMO MSCI USA High Quality Index ETF | Equity | Core | 0.30% | 25.00% |
| ZCN | BMO S&P/TSX Capped Composite Index ETF | Equity | Core | 0.05% | 25.00% |
| ZWT | BMO Covered Call Technology ETF | Equity | Tactical | 0.65% | 5.00% |
| ZWB | BMO Covered Call Canadian Banks ETF | Equity | Tactical | 0.65% | 5.00% |
| ZWU | BMO Covered Call Utilities ETF | Equity | Tactical | 0.65% | 5.00% |
| Total Equity | 65.00% | ||||
| Non-Traditional Hybrids | |||||
| ZCOM | BMO Broad Commodity Index ETF | Hybrid | Tactical | 0.26% | 5.00% |
| ZWGD | BMO Covered Call Spread Gold Bullion ETF | Hybrid | Tactical | 0.65% | 5.00% |
| Total Alternatives | 10.00% | ||||
| Total Cash | 0.00% | ||||
| Portfolio | 0.27% | 100.00% | |||
Source: BMO Global Asset Management, as of June 30, 2026. Model portfolio for illustrative purposes only. The information contained herein is not, and should not be construed as, investment, tax or legal advice to any party. These are not recommendations to buy or sell any particular security. Particular investments and/or trading strategies should be evaluated relative to the individual’s investment objectives and professional advice should be obtained with respect to any circumstance.
Table 2 – Holdings and Weights for Our Updated Tax Efficient Portfolio (Q3 2026)
| Ticker | Name | Weight | Country |
Fixed Income |
|||
12.50% |
Canada |
||
12.50% |
Canada |
||
Equities |
|||
25.00% |
U.S. |
||
25.00% |
Canada |
||
5.00% |
U.S. |
||
5.00% |
Canada |
||
5.00% |
Canada |
||
Alts/Non-Traditional Hybrids |
|||
5.00% |
U.S. |
||
5.00% |
Canada |
||
Total |
100.00% |
||
Source: BMO Global Asset Management, as of June 30, 2026. The portfolio holdings are subject to change without notice and only represent a percentage of portfolio holdings. They are not recommendations to buy or sell any particular security.
Table 3 – Changes to Portfolio from Q2 2026
| Sell/Trim | Ticker | Old Weight | (%) | New weight |
5.00% |
-5.00% |
0.00% |
||
7.50% |
-2.50% |
5.00% |
||
| BMO Covered Call Spread Gold Bullion ETF | 7.50% |
-2.50% |
5.00% |
| Buy/Add | Ticker | Old Weight | % | New Weight |
| BMO Discount Bond Index ETF | ZDB | 10.00% | 2.50% | 12.50% |
| BMO Corporate Discount Bond ETF | ZCDB | 6.00% | 6.50% | 12.50% |
| BMO Covered Call Technology ETF | ZWT | 4.00% | 1.00% | 5.00% |
Source: BMO Global Asset Management, as of June 30, 2026. The portfolio holdings are subject to change without notice and only represent a percentage of portfolio holdings. They are not recommendations to buy or sell any particular security.
Chart 1 – Tax Efficient Model Portfolio Update
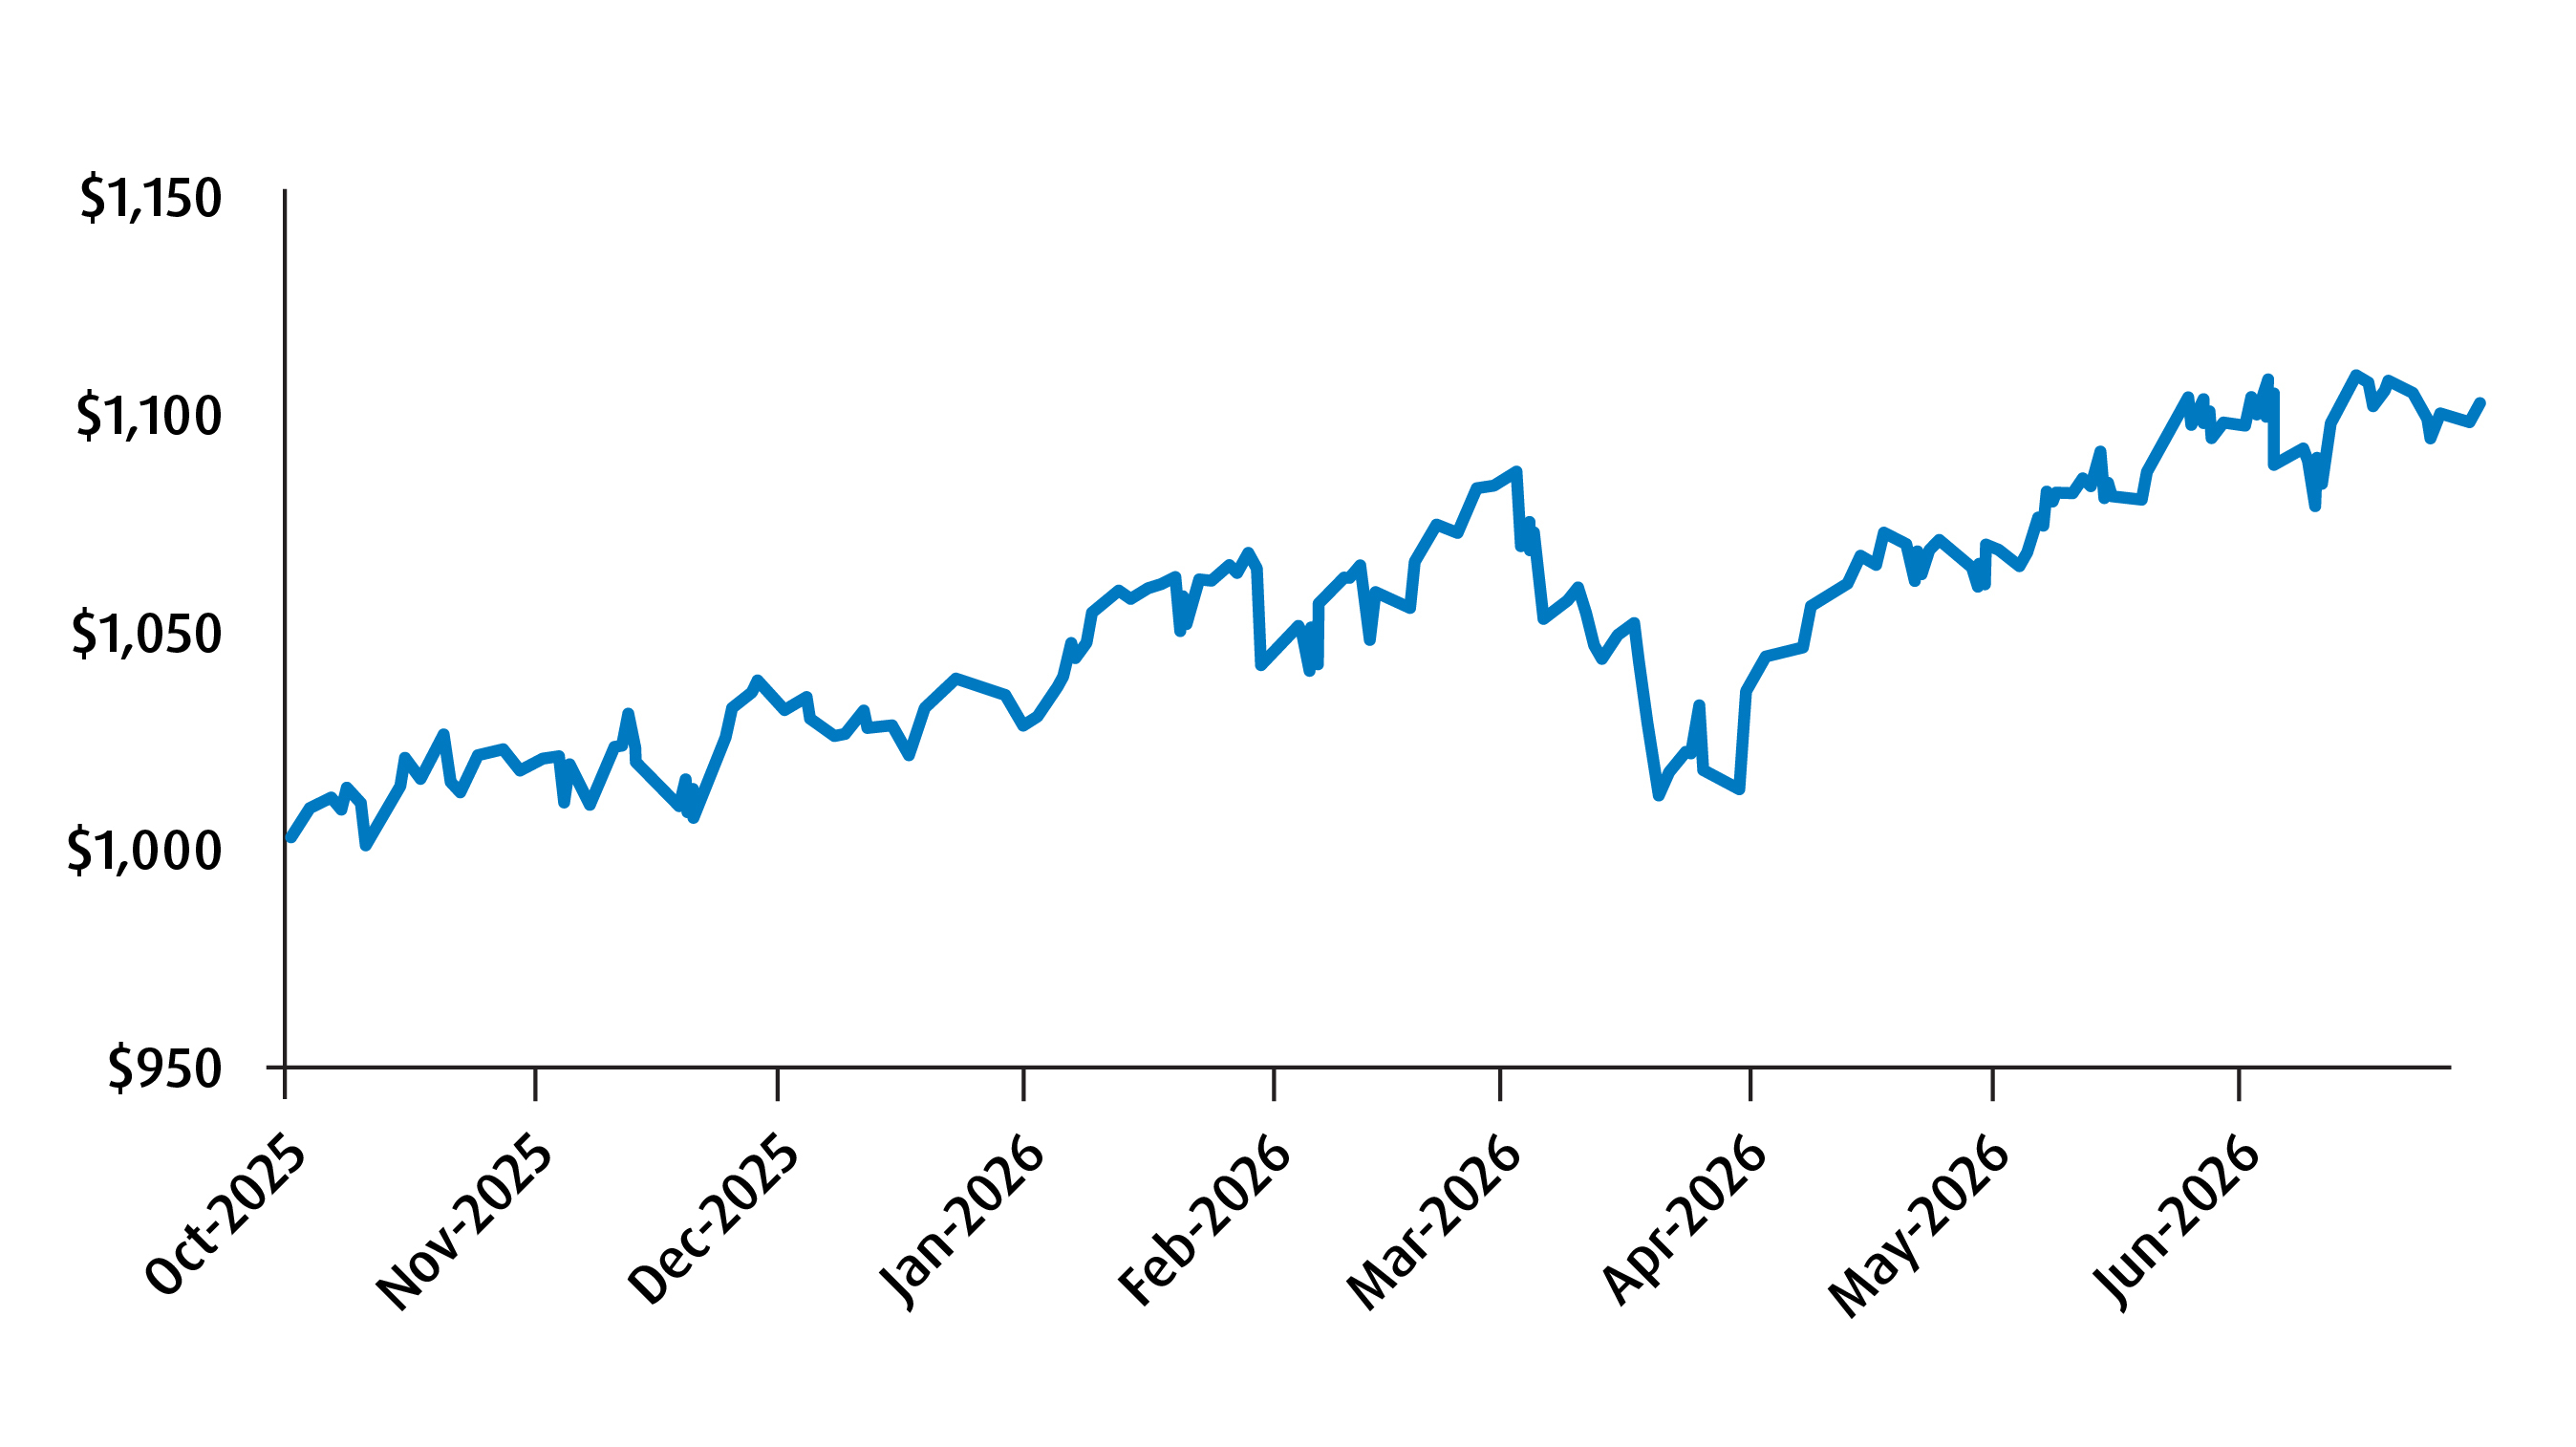
| Annualized Performance | YTD | 1 mo | 3 mo | 6 mo | Since Inception | Inception Date |
| BMO Model Tax Efficient Portfolio (%) | 7.30% | 0.72% | 6.47% | 7.30% | 10.29% | 9/30/2025 |
Source: BMO Global Asset Management, as of June 30, 2026.
Chart 2 – Sector Exposure for Tax Efficient Portfolio for Q3 2026
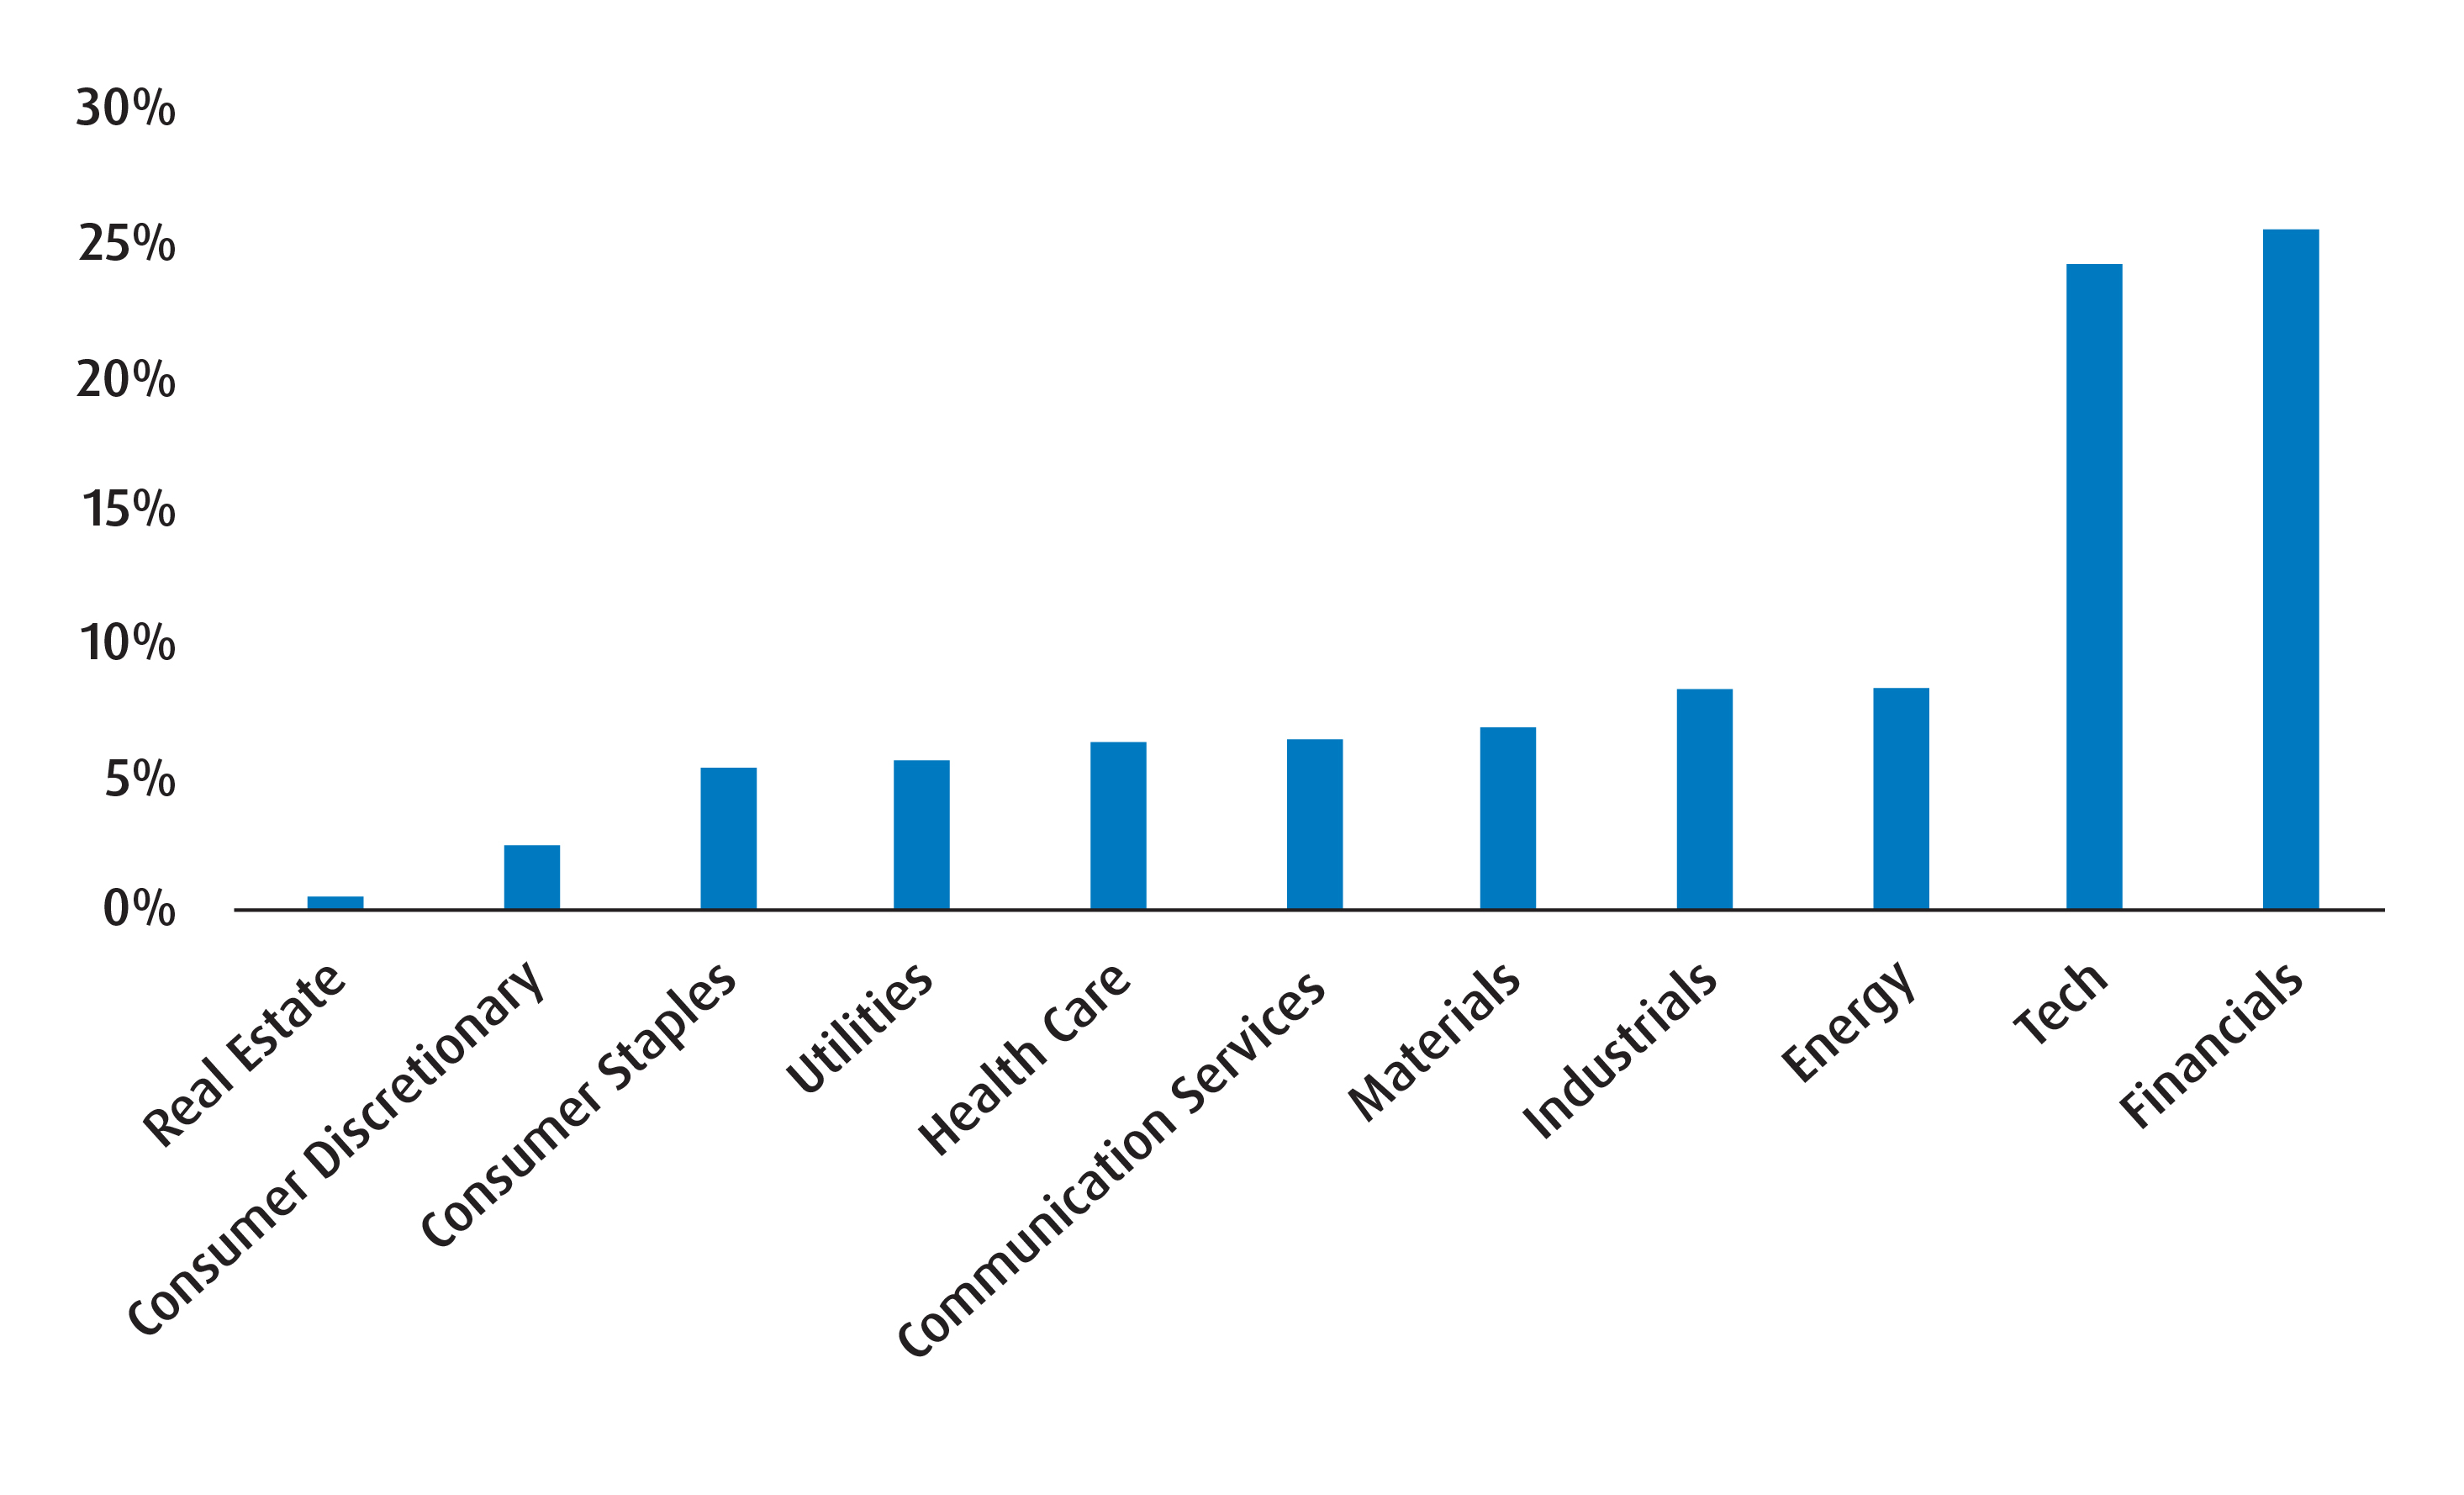
Source: BMO Global Asset Management, as of June 30, 2026.
Table 4 – Fixed Income Exposure Breakdown
| Q3 2026 | Q2 2026 | |
Weighted Average Term |
6.39 |
5.95 |
Weighted Average Duration |
5.20 |
4.85 |
Weighted Average Coupon (%) |
2.11 |
1.78 |
Annualized Dist. Yield (%) |
1.87 |
2.25 |
Weighted Average Yield to Maturity (%) |
3.39 |
3.69 |
Source: BMO Global Asset Management, as of June 30, 2026.
Table 5 - Performance of Holdings
| Ticker | Year-to-Date | 1-Month | 3-Month | 6-Month | 1-Year | 3-Year | 5-Year | 10-Year | Since Inception |
Inception Date |
10.59% |
2.51% |
1.82% |
12.03% |
35.94% |
24.54% |
15.23% |
12.74% |
10.02% |
2009-05-29 |
|
16.34% |
3.97% |
10.65% |
21.64% |
50.24% |
26.66% |
14.03% |
12.36% |
10.97% |
2011-01-28 |
|
10.64% |
-0.12% |
-0.27% |
8.06% |
15.85% |
11.24% |
6.73% |
6.27% |
5.58% |
2011-10-20 |
|
9.00% |
5.34% |
6.63% |
7.26% |
24.80% |
22.51% |
16.50% |
16.72% |
16.62% |
2014-11-05 |
|
1.58% |
1.37% |
-0.55% |
0.20% |
2.46% |
4.04% |
0.63% |
1.66% |
2.32% |
2014-02-10 |
|
— |
— |
— |
— |
— |
— |
— |
— |
— |
2025-10-21 |
|
19.05% |
12.45% |
25.79% |
16.47% |
47.95% |
35.67% |
23.66% |
— |
22.54% |
2021-01-20 |
|
1.24% |
0.89% |
-0.23% |
0.85% |
3.67% |
6.01% |
— |
— |
3.30% |
2022-01-24 |
|
3.32% |
0.19% |
-11.55% |
5.48% |
33.21% |
— |
— |
— |
30.25% |
2025-05-22 |
Source: BMO Global Asset Management, as of June 30, 2026. Past performance is not indicative of future results.
Notes on Tax Characteristics:
ZDB, ZCDB
- The BMO Discount Bond ETF suite (ZDB, ZCDB, ZSDB) is designed to minimize interest income by buying bonds with lower coupons that are trading at a discount to par value, such that a portion of future returns will come from price appreciation and will be treated as a capital gain instead of interest income. Please see here for a breakdown of how the suite can help investors reduce taxable interest income relative to traditional bond funds with similar exposures.
- ZUAG/F: Average coupon is far below Yield-To-Maturity, or YTM (2.82% average coupon, which is lower than the yield to maturity of 4.32% as of Dec 29, 2025, indicating pull-to-par opportunity and minimization of interest income versus other bond ETFs).
ZUQ
- Dividends from U.S. companies are subject to U.S. withholding tax. Not only do we like the MSCI USA High Quality basket from an investment outlook standpoint, but, because of its screens, it has a lower dividend payout rate, and therefore a lower rate of U.S. withholding tax exposure versus U.S. equity exposures that pay out a higher dividend distribution rate.
ZCN
- As a basket of Canadian companies, the ETF’s distribution is taxed as Canadian eligible dividends and is entitled to the advantageous Canadian dividend gross up and tax credit system.
ZWT
- The basket is composed of U.S. large cap technology names, which pay minimal dividends (foreign income exposed to U.S. withholding tax). The ETF’s covered call strategy sells call options in order to collect monthly cash flow; this portion is taxed as capital gains, which are exposed to tax at a lower rate than interest income or foreign income.
ZWB
- The basket is composed of large cap Canadian banks, which pay dividends. The ETF’s covered call strategy sells call options in order to collect monthly cash flow; this portion is taxed as capital gains, which are exposed to tax at a lower rate than interest income.
ZWU, ZWGD:
- These covered call strategies sell call options in order to collect monthly cash flow; this portion of the yield is taxed as capital gains and/or return of capital, which are exposed to tax at a lower rate versus interest income or foreign income.
Visit bmo.com/etfs or contact Client Services at 1−800−361−1392.
To listen to our Views From the Desk BMO ETF Podcasts, please visit bmoetfs.ca.
BMO ETF Podcasts are also available on


Disclaimers
For advisor use only.
For advisors only. No portion of this material may be reproduced or distributed to retail clients. Any statement that necessarily depends on future events may be a forward-looking statement. Forward-looking statements are not guarantees of performance. They involve risks, uncertainties and assumptions. Although such statements are based on assumptions that are believed to be reasonable, there can be no assurance that actual results will not differ materially from expectations. Investors are cautioned not to rely unduly on any forward-looking statements. In connection with any forward-looking statements, investors should carefully consider the areas of risk described in the most recent prospectus.
The viewpoints expressed by the author represents their assessment of the markets at the time of publication. Those views are subject to change without notice at any time. The information provided herein does not constitute a solicitation of an offer to buy, or an offer to sell securities nor should the information be relied upon as investment advice. Past performance is no guarantee of future results.
This communication is for information purposes. The information contained herein is not, and should not be construed as, investment, tax or legal advice to any party. Particular investments and/or trading strategies should be evaluated relative to the individual’s investment objectives and professional advice should be obtained with respect to any circumstance.
Index returns do not reflect transactions costs or the deduction of other fees and expenses and it is not possible to invest directly in an Index. Past performance is not indicative of future results.
BMO Broad Commodity ETF is an exchange-traded alternative mutual fund within the meaning of NI 81-102. As an alternative mutual fund, the BMO ETF has the ability to invest in asset classes and use investment strategies that are not permitted for conventional mutual funds, including the ability to invest in other alternative mutual funds, employ leverage and borrow cash to use for investment purposes and increased ability to invest in commodities. While these strategies will be used in accordance with the BMO ETF’s investment objective and strategies, during certain market conditions, they may accelerate the pace at which an investor’s investment decreases in value.
The ETFs referred to herein are not sponsored, endorsed, or promoted by MSCI and MSCI bear no liability with respect to an ETF or any index on which such ETF is based. The ETF’s prospectus contains a more detailed description of the limited relationship that MSCI has with the Manager and any related ETF.
The Index is a product of S&P Dow Jones Indices LLC or its affiliates (“SPDJI”), and has been licensed for use by the Manager. S&P®, S&P 500®, US 500, The 500, iBoxx®, iTraxx® and CDX® are trademarks of S&P Global, Inc. or its affiliates (“S&P”) and Dow Jones® is a registered trademark of Dow Jones Trademark Holdings LLC (“Dow Jones”), and these trademarks have been licensed for use by SPDJI and sublicensed for certain purposes by the Manager. The ETF is not sponsored, endorsed, sold or promoted by SPDJI, Dow Jones, S&P, their respective affiliates, and none of such parties make any representation regarding the advisability of investing in such product(s) nor do they have any liability for any errors, omissions, or interruptions of the Index.
You cannot invest directly in an index.
Commissions, management fees and expenses all may be associated with investments in exchange-traded funds. Please read the ETF Facts or prospectus of the BMO ETFs before investing. The indicated rates of return are the historical annual compounded total returns including changes in unit value and reinvestment of all dividends or distributions and do not take into account sales, redemption, distribution or optional charges or income taxes payable by any unitholder that would have reduced returns. Exchange-traded funds are not guaranteed, their values change frequently and past performance may not be repeated.
For a summary of the risks of an investment in the BMO ETFs, please see the specific risks set out in the BMO ETF’s prospectus. BMO ETFs trade like stocks, fluctuate in market value and may trade at a discount to their net asset value, which may increase the risk of loss. Distributions are not guaranteed and are subject to change and/or elimination.
Distribution yields are calculated by using the most recent regular distribution, or expected distribution, (which may be based on income, dividends, return of capital, and option premiums, as applicable) and excluding additional year end distributions, and special reinvested distributions annualized for frequency, divided by current net asset value (NAV). The yield calculation does not include reinvested distributions. Distributions are not guaranteed, may fluctuate and are subject to change and/or elimination. Distribution rates may change without notice (up or down) depending on market conditions and NAV fluctuations. The payment of distributions should not be confused with the BMO ETF’s performance, rate of return or yield. If distributions paid by a BMO ETF are greater than the performance of the investment fund, your original investment will shrink. Distributions paid as a result of capital gains realized by a BMO ETF, and income and dividends earned by a BMO ETF, are taxable in your hands in the year they are paid. Your adjusted cost base will be reduced by the amount of any returns of capital. If your adjusted cost base goes below zero, you will have to pay capital gains tax on the amount below zero.
Cash distributions, if any, on units of a BMO ETF (other than accumulating units or units subject to a distribution reinvestment plan) are expected to be paid primarily out of dividends or distributions, and other income or gains, received by the BMO ETF less the expenses of the BMO ETF, but may also consist of non-taxable amounts including returns of capital, which may be paid in the manager’s sole discretion. To the extent that the expenses of a BMO ETF exceed the income generated by such BMO ETF in any given month, quarter, or year, as the case may be, it is not expected that a monthly, quarterly, or annual distribution will be paid. Distributions, if any, in respect of the accumulating units of BMO Short Corporate Bond Index ETF, BMO Short Federal Bond Index ETF, BMO Short Provincial Bond Index ETF, BMO Ultra Short-Term Bond ETF and BMO Ultra Short-Term US Bond ETF will be automatically reinvested in additional accumulating units of the applicable BMO ETF. Following each distribution, the number of accumulating units of the applicable BMO ETF will be immediately consolidated so that the number of outstanding accumulating units of the applicable BMO ETF will be the same as the number of outstanding accumulating units before the distribution. Non-resident unitholders may have the number of securities reduced due to withholding tax. Certain BMO ETFs have adopted a distribution reinvestment plan, which provides that a unitholder may elect to automatically reinvest all cash distributions paid on units held by that unitholder in additional units of the applicable BMO ETF in accordance with the terms of the distribution reinvestment plan. For further information, see the distribution policy in the BMO ETFs’ prospectus.
BMO ETFs are managed by BMO Asset Management Inc., an investment fund manager, a portfolio manager, and a separate legal entity from Bank of Montreal.
BMO Global Asset Management is a brand name under which BMO Asset Management Inc. and BMO Investments Inc. operate.
“BMO (M-bar roundel symbol)” is a registered trademark of Bank of Montreal, used under licence.