BMO Macro Regime Model – Strategy Report (Q3 2026)
All prices, returns and portfolio weights are as of market close on June 30, 2026, unless otherwise indicated.



In this report:
Greenspan Was Early Too
In the late-1990s, the late Alan Greenspan coined the term ‘irrational exuberance’ to describe mania around the dot-com boom. And to be sure, you can find traces of similar sentiment regarding the current artificial intelligence (AI) boom — with investors becoming more cautious on asset prices that have seemingly moved well beyond their fundamental values.
However, if you look close enough, there are several factors that are still working in favour of broad risk. In fact, we’d argue that these factors are still strong enough to offset extant concerns.
The ‘Broadening’ Story Is Playing Out
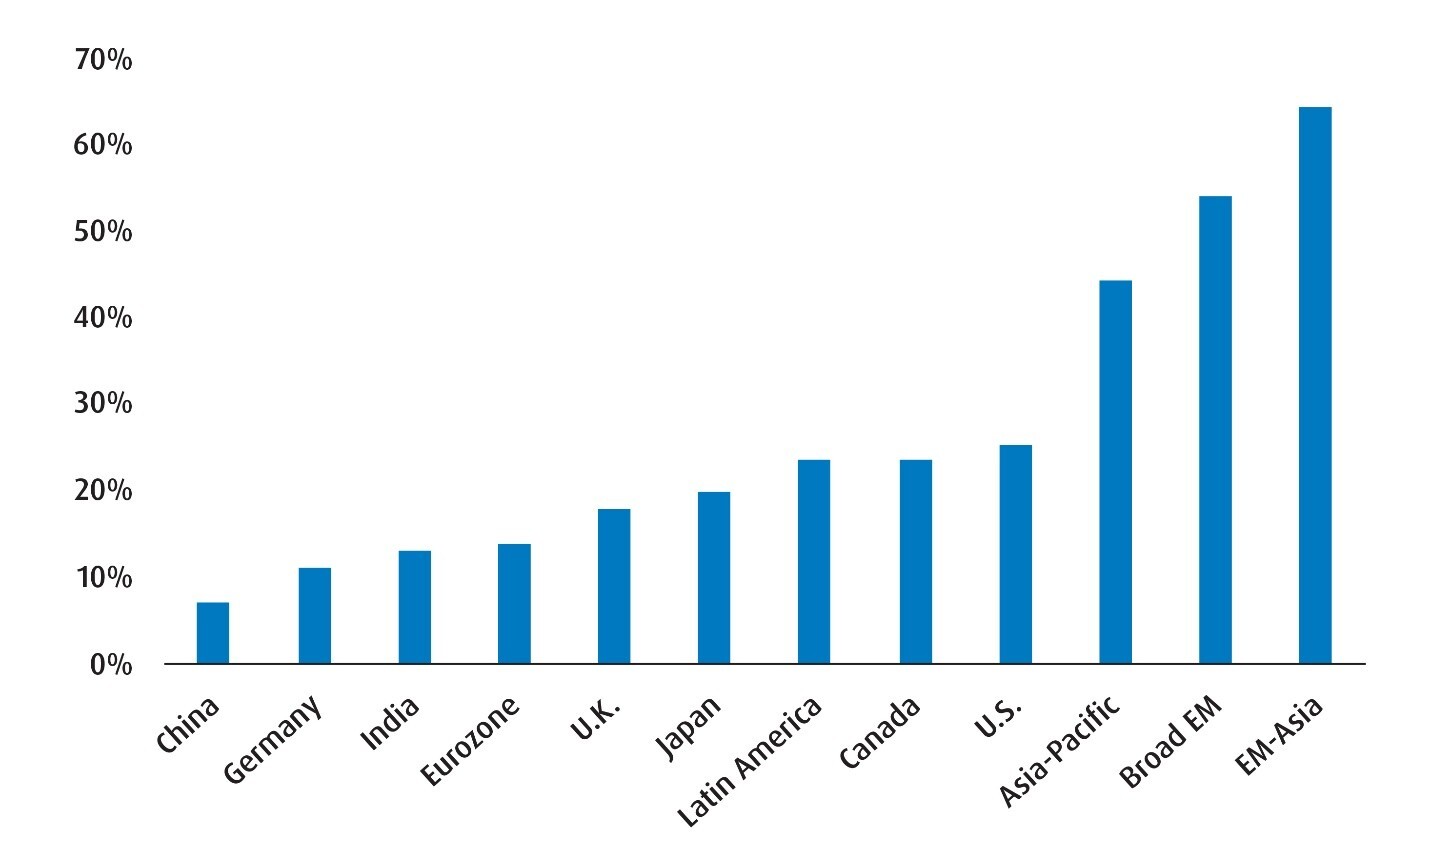
The more you step back, the clearer it becomes that AI isn’t just a bullish theme for tech stocks in the U.S. Instead, it’s becoming apparent that adoption and integration of AI processes is supporting earnings across other regions as well. That largely explains why emerging markets (EM) earnings have accelerated by more than the U.S. so far this year (Chart 1). Additionally, outside of tech, we’re seeing sectors that are tethered to AI continue to perform (including industrials and financials).
The evidence of rotation (whether regional or sectoral) implies that demand for AI should continue. At the very least, that tells us that strong earnings momentum is likely not going away for another quarter or two.
Chart 1 – Year-to-Date Earnings Growth (Blended)
The Fundamental Story Is Still Strong and Liquidity Remains Ample
While concerns on elevated inflation remain justified in some major economies, the downside risks to growth haven’t played out as originally feared. That is most likely due to the heavy degree of fiscal spending over the past year and a half. In any case, composite Purchasing Managers’ Indexes across many of the major markets are above the 50 mark (most notably in the U.S.) – which points to momentum for real activity.
At the same time, potential household investing bandwidth remains sizeable – especially in the United States. The total amount of money market assets held is just under $8 trillion with close to 40% of that belonging to retail investors. Also, U.S. commercial bank deposits are growing providing yet another potential source for investment deployment if equities go on the defensive. Keep in mind, that household leverage ratios are also lower than they have been in prior periods as well.
What this tells us is that we’re still likely in a ‘high growth, high inflation’ type of regime. That should bode well for cyclical equities and select emerging market opportunities.
Federal Reserve (Fed) Policy Is Still Expansionary
On an inflation-adjusted basis, the Fed funds rate is currently at 22 bps — well below levels that are concerning. For instance, as recently as two years ago this same gauge was around 260 bps. And just before the tech bubble burst and the global financial crisis began, this gauge was 430 bps and 330 bps respectively (see Chart 2).
Chart 2 – The Real (Inflation Adjusted) Fed Funds Rate* Over Time
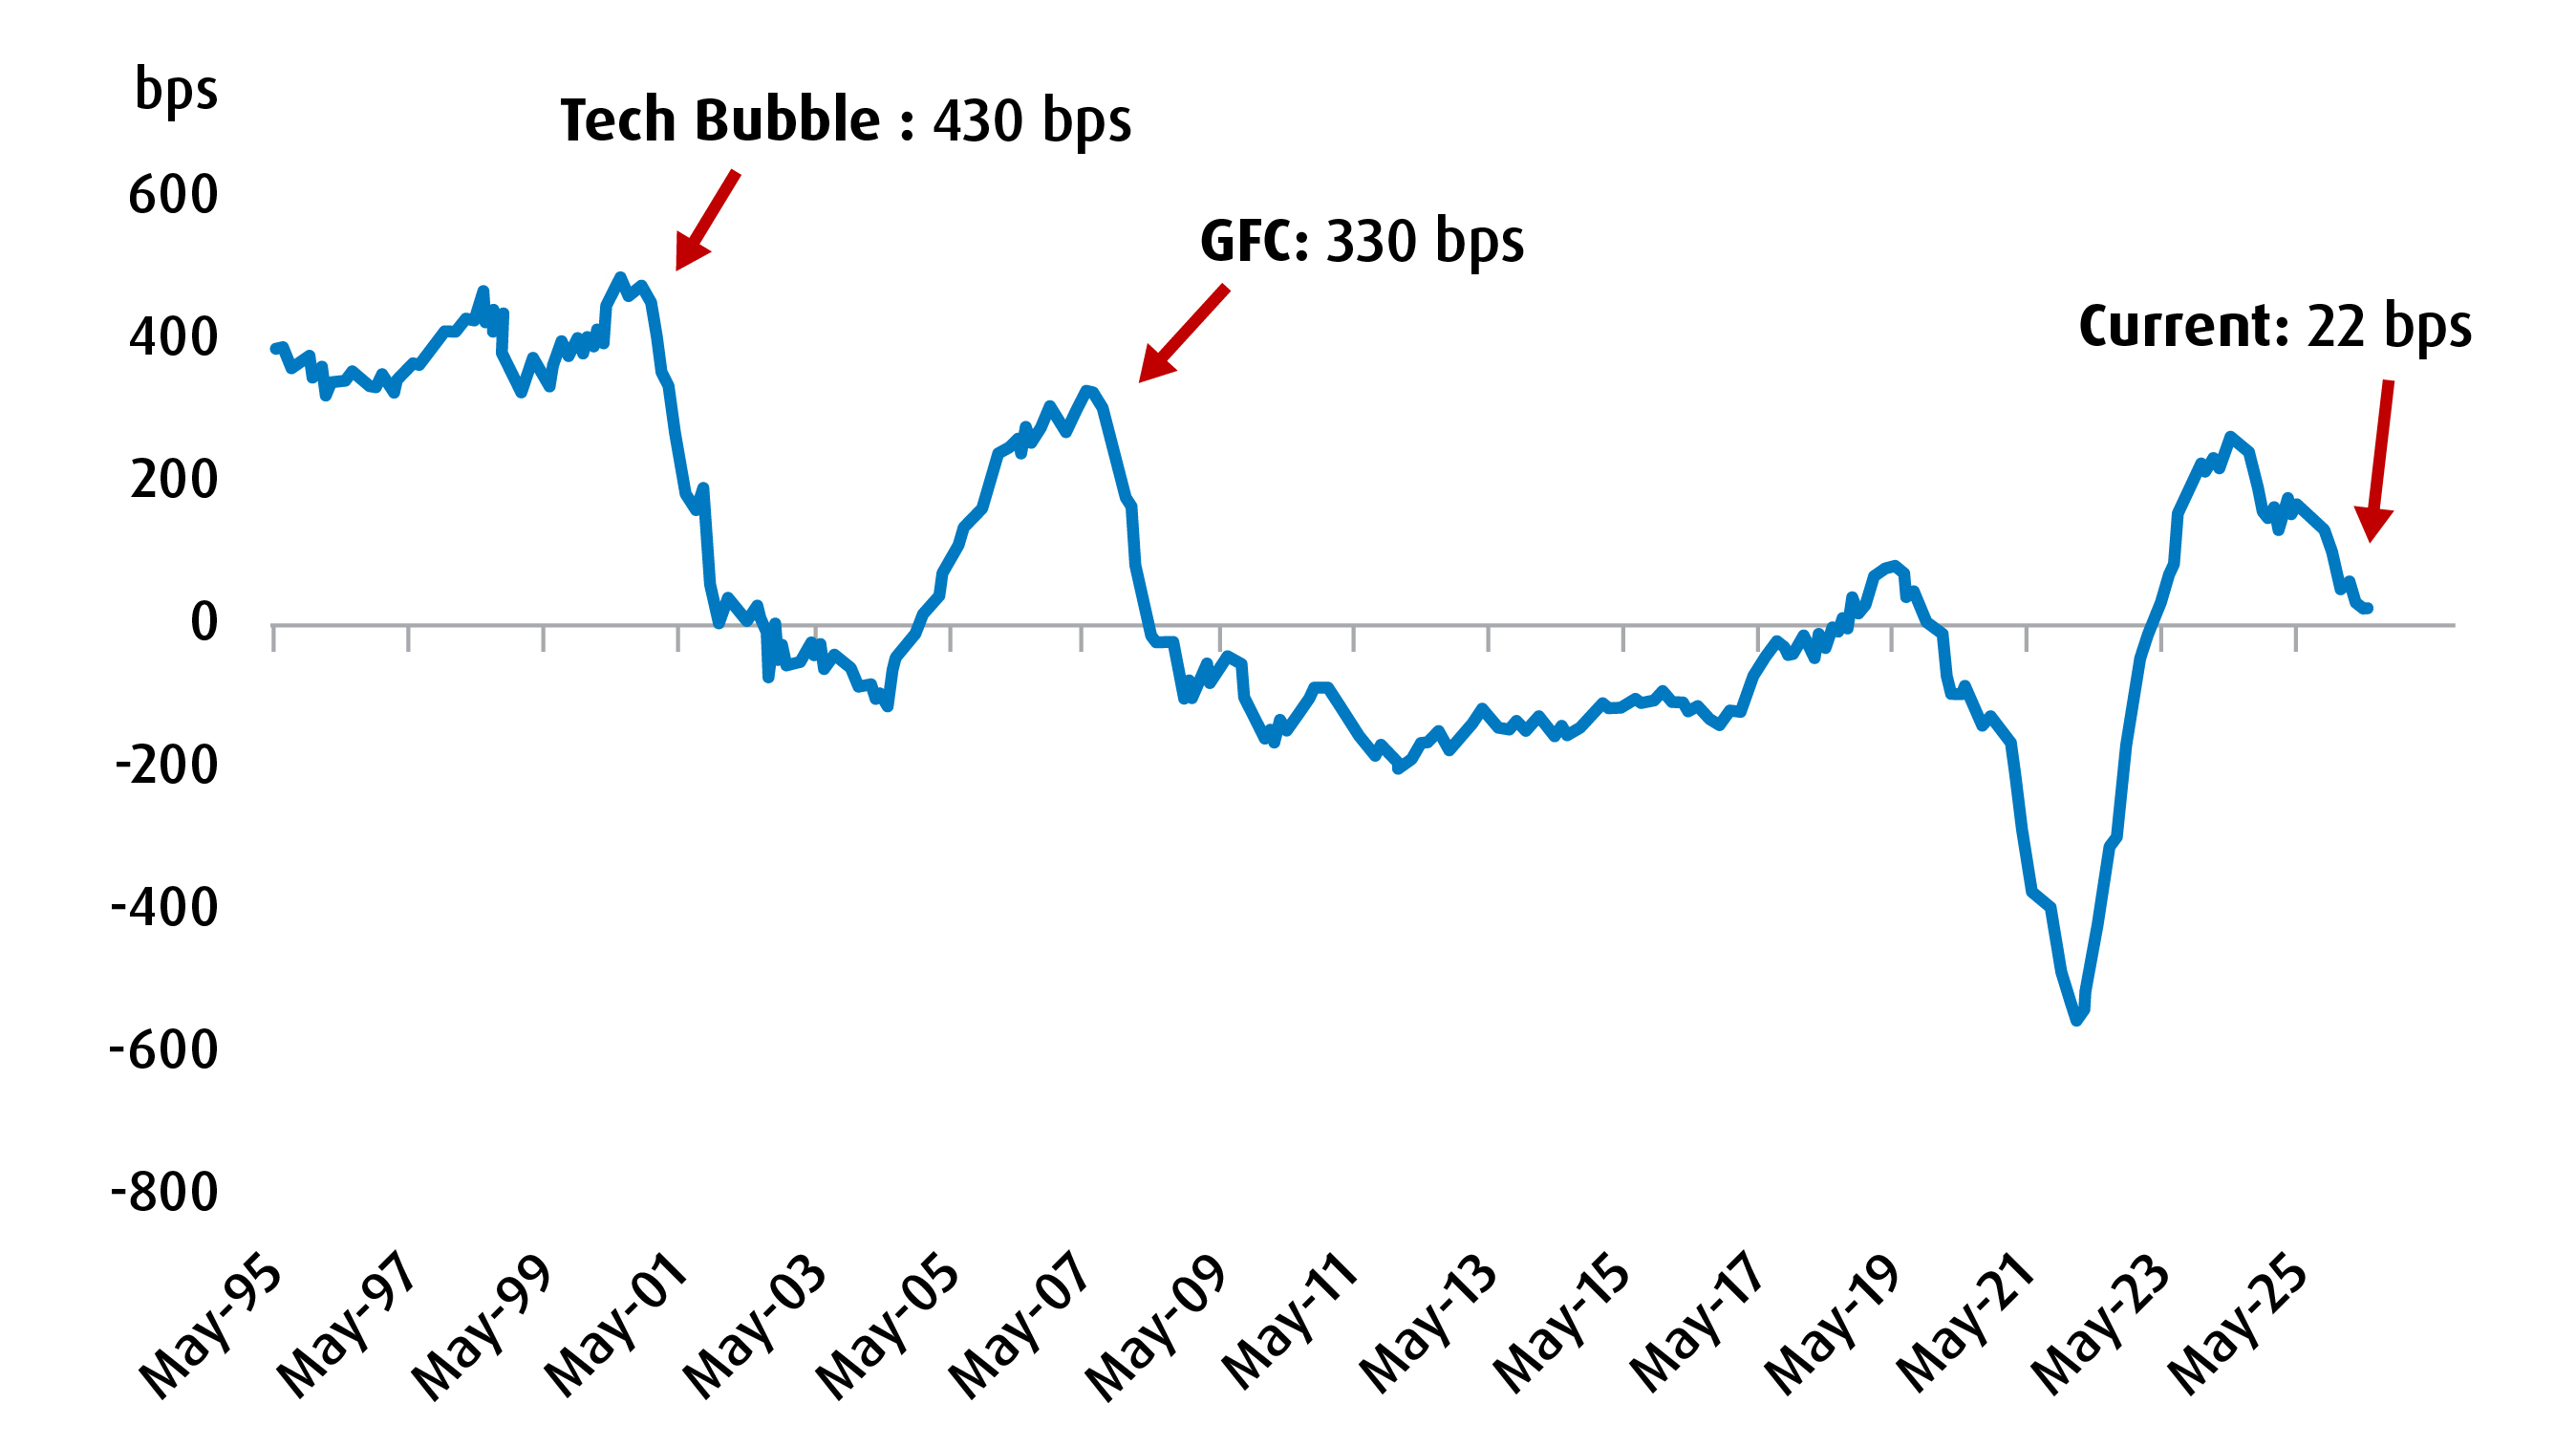
Source: BMO Global Asset Management, Bloomberg, as of June 26, 2026.
Our own feel is that the next move by the Federal Open Market Committee (FOMC) is for a rate hike, but there’s plenty of runway before the real Fed funds rate gets to problematic levels for broad risk.
Are there reasons to be cautious? Of course. For one, most of the optimism in the market hinges on the ‘centrality’ of the AI theme and ensuring that the total amount of spend is justified by monetizable productivity gains. Second, there is the risk that net equity supply could turn positive given the sheer volume of IPOs (SpaceX and potentially OpenAI, Anthropic) as well as follow-on offerings. What’s more is that US Treasury and corporate bond issuance is set to remain elevated as well. Indeed, the market is being asked to absorb a lot — which risks supply indigestion and reallocation from other holdings.
For now, these are risks to monitor. If we do get a sense that AI demand is ebbing or that supply indigestion is becoming a theme, then we’ll be quick to adjust our tactical positions. In our minds, strong earnings momentum, supportive fundamentals, ample liquidity and an expansionary monetary/fiscal policy backdrop portend further equity market gains from here.
Remember that while Greenspan’s call of irrational exuberance ended up being right in the late-90s, it still took a while to get there.
Asset Allocation
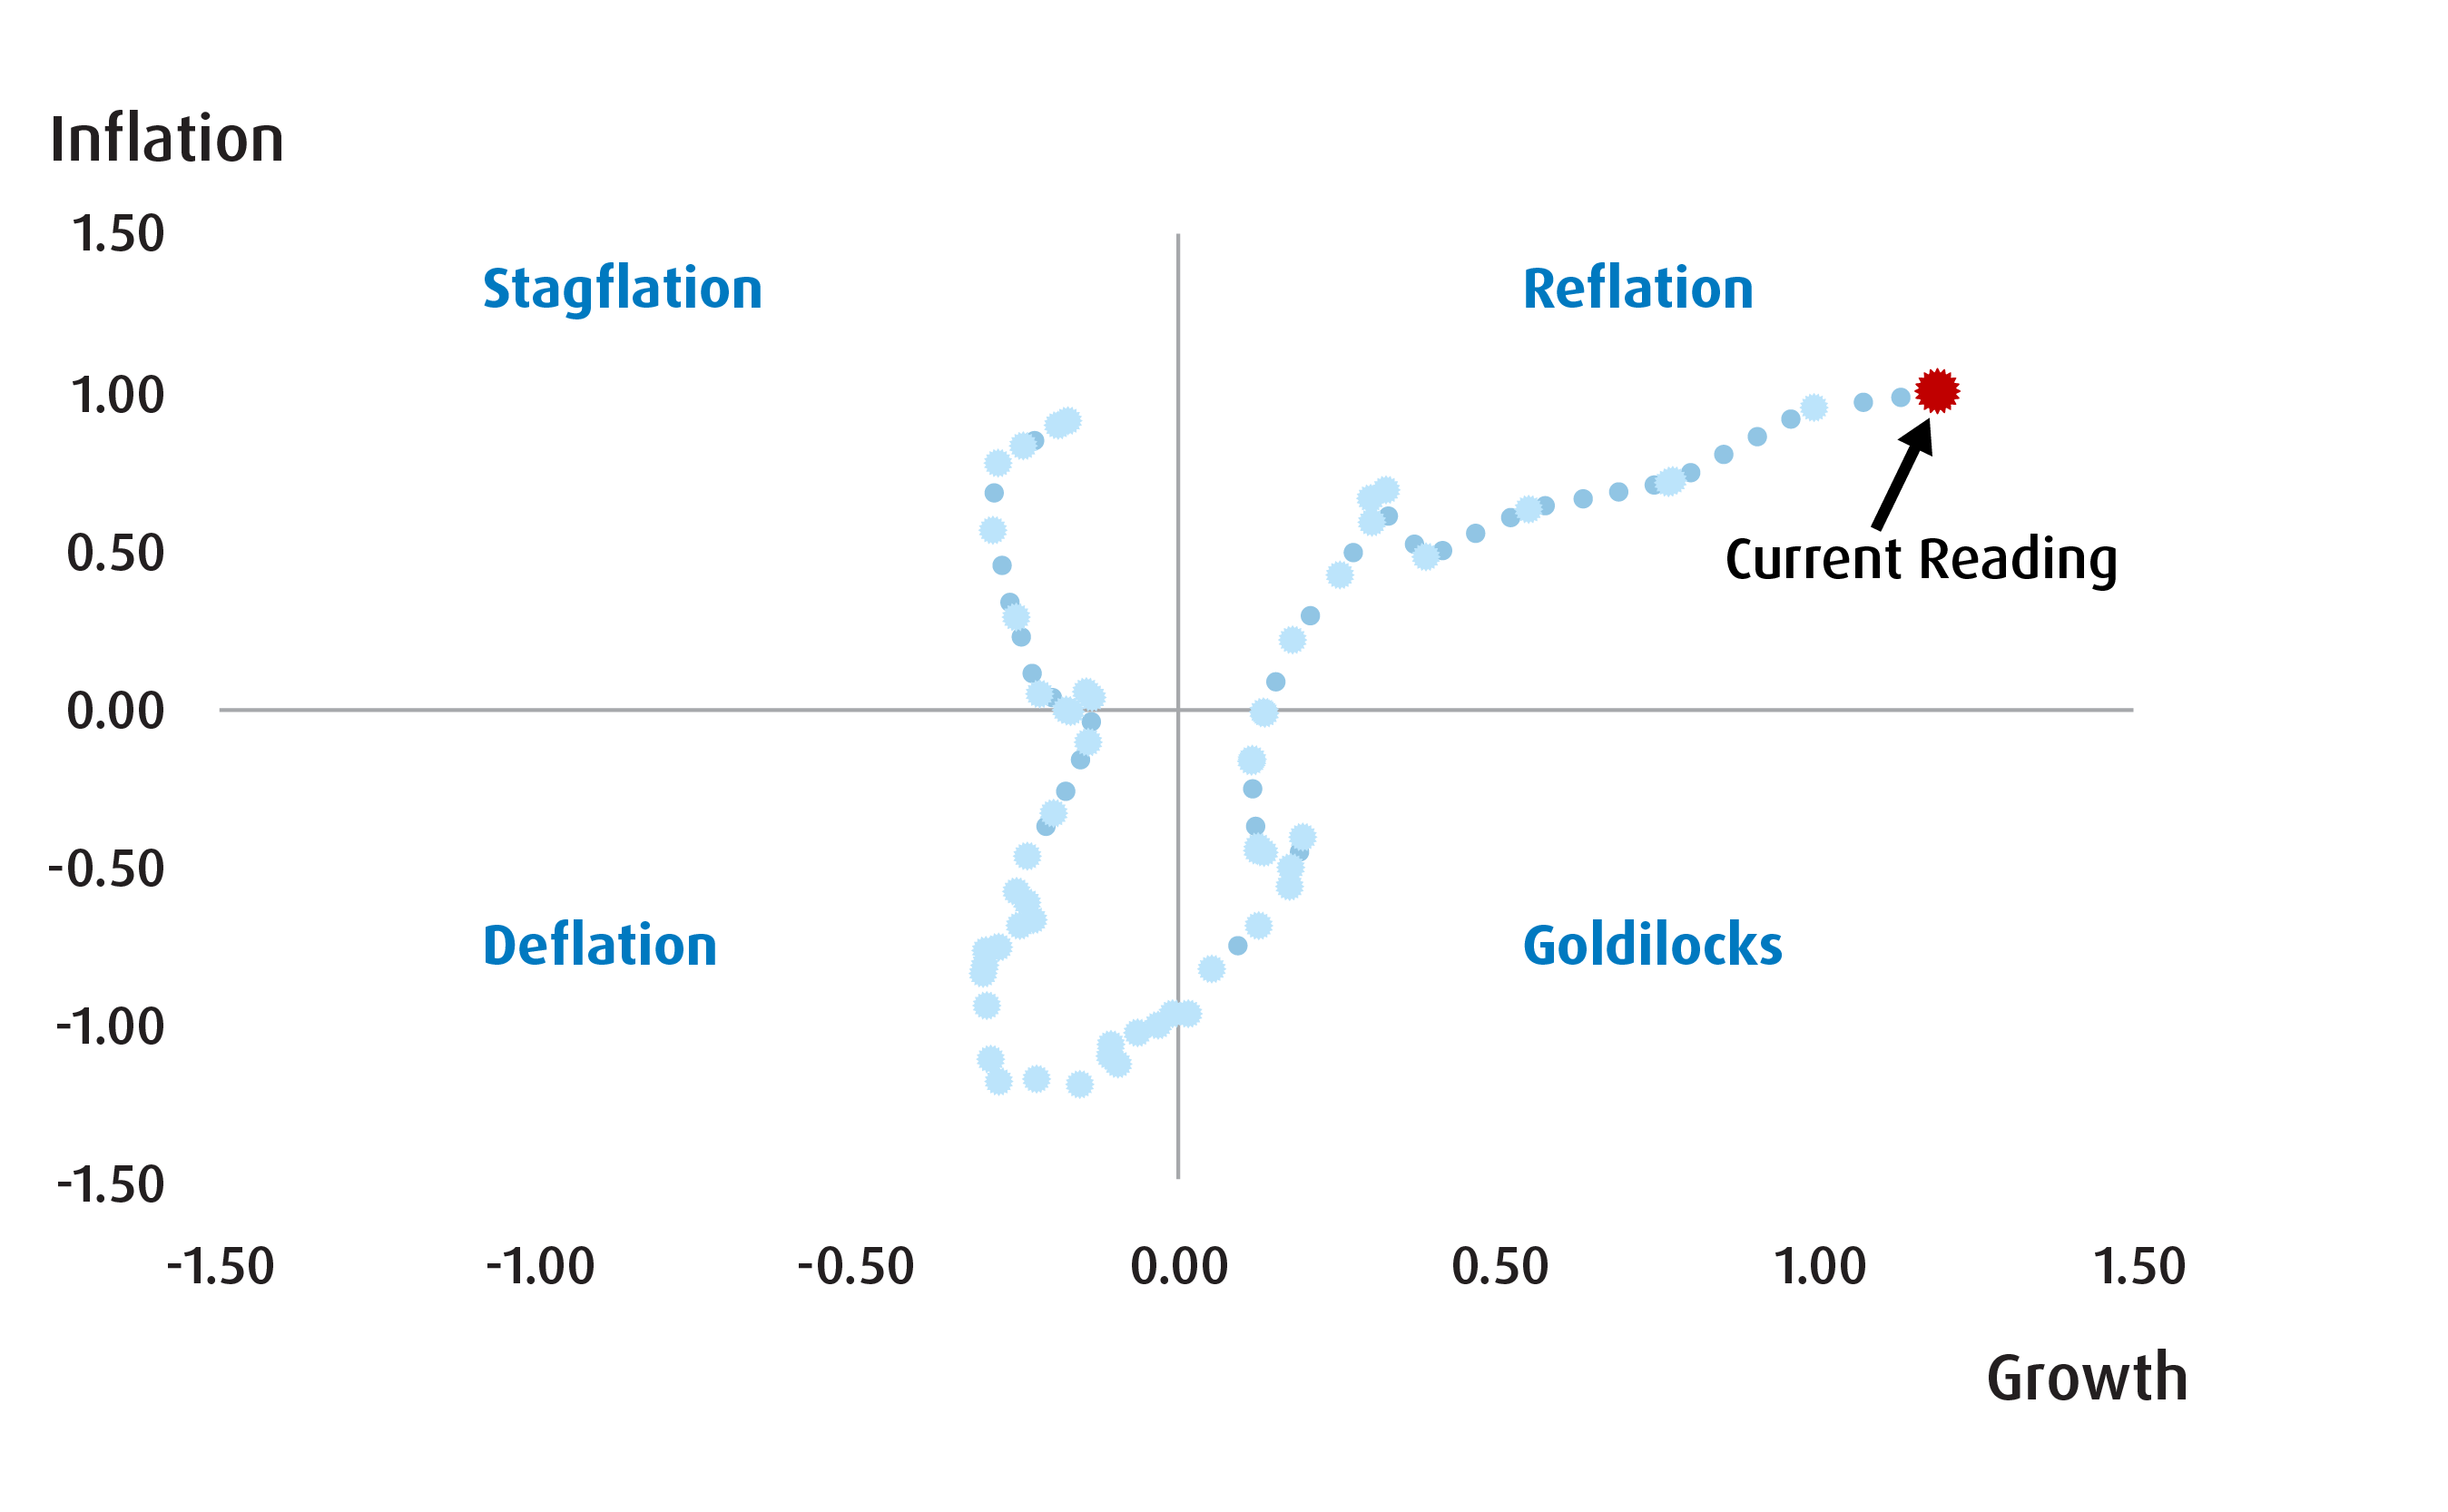
- The output for our Macro Regime model is displayed in Chart 3. Instead of migrating into a mild ‘stagflation’-like backdrop, the model suggests that conditions have moved further towards the ‘reflation’ territory. That reflects the stronger growth surprises that we’ve seen in leading indicators for large economies as well as stickier inflation pressures.
- For our portfolio construction process, this means we’ll stay overweight the ‘growth’ (equities) and ‘inflation’ (alts) sleeves of our portfolio. Much like prior quarters, concerns about current inflation pressures also means we’re underweight ‘duration/income’ (fixed income).
- Relative to Q2, we’re bumping up our allocation to equities to 65% (from 61%), whilst trimming our allocation to both alts (13% from 14%) and fixed income (22% from 25%). From a risk management perspective, equities now make up around 72.9% of the overall risk of the portfolio while fixed income (6.75%) and alts (19.67%) combine for the balance.
- From an FX lens, we see the risks to U.S. dollar (USD)/Canadian dollar (CAD) as better balanced from current levels relative to where we saw them heading into Q2. As such, we’ll be hedging our exposure to U.S. fixed income. Our U.S. equities exposure will remain unhedged for the time being.
Chart 3 – Macro Regime Model Output for Q3 2026
Fixed Income
- We’re bumping up our exposure to broad US market and electing to hedge our exposures via ZUAG.F (BMO US Aggregate Bond Index ETF – Currency Hedged). The reason for the increase in capital weight is tied to risk budgeting purposes for the most part.
- We have removed our exposure to ZTIP (BMO Short-Term US TIPS Index) and cut our exposure to ZBI (BMO Canadian Bank Income Index ETF) slightly to 6% (from 7%).
- The removal of TIPS exposure reflects our concern that the market may price in a higher equilibrium rate for the Fed over the long term. Even if inflation pressures remain sticky, that re-pricing of the neutral rate still leaves TIPS exposed.
Equities
- For the most part, we are keeping our core positions steady from Q2. The only minor change is that we’ve trimmed our allocation to ZEA (BMO MSCI EAFE Index ETF) slightly to allocate a bit more to our position in ZEM (BMO MSCI Emerging Markets Index ETF). We remain constructive on upstream AI firms – which have helped lift EM-tracking funds given the importance of a few names in South Korea and Taiwan.
- We’re also adding a new tactical position in ZWB (BMO Covered Call Canadian Banks ETF). We’ve written several times in the past that the strong capital positions of Canadian banks offer them a fair degree of flexibility when it comes to business decisions and supporting share prices. Current valuations remain high, which is why we’re opting to go with a covered call strategy as opposed to a beta strategy.
Alts/Non-Traditional Hybrids
- We’ve trimmed our exposure to Gold (via ZWGD or the BMO Covered Call Spread Gold Bullion ETF) slightly and reallocated towards infrastructure (via ZGIF or the BMO Global Infrastructure Fund ETF) and our equity holdings.
- We remain constructive on Gold over the long term but acknowledge that near-term risks loom large (positioning and USD strength).
Table 1 – BMO Macro Regime Model Portfolio for Q3 2026
| Ticker | ETF Name | Sector Positioning | Management Fee | Weight (%) | Volatility Contribution | |
| Fixed Income | ||||||
| ZDB | BMO Discount Bond Index ETF | Fixed Income | Core | 0.09% | 8.00% | 2.83% |
| ZUAG.F | BMO US Aggregate Bond Index ETF | Fixed Income | Core | 0.08% | 8.00% | 2.89% |
| ZBI | BMO Canadian Bank Income Index ETF | Fixed Income | Tactical | 0.25% | 6.00% | 1.21% |
| Total Fixed Income | 22.00% | 6.93% | ||||
| Equities | ||||||
| ZUQ | BMO MSCI USA High Quality Index ETF | Equity | Core | 0.30% | 23.00% | 20.60% |
| ZCN | BMO S&P/TSX Capped Composite Index ETF | Equity | Core | 0.05% | 20.00% | 20.50% |
| ZEA | BMO MSCI EAFE Index ETF | Equity | Core | 0.20% | 7.00% | 9.56% |
| ZEM | BMO MSCI Emerging Markets Index ETF | Equity | Tactical | 0.25% | 6.00% | 13.83% |
| ZLU | BMO Low Volatility US Equity ETF | Equity | Tactical | 0.30% | 4.00% | 3.00% |
| ZWB | BMO Covered Call Canadian Banks ETF | Equity | Tactical | 0.65% | 5.00% | 5.43% |
| Total Equity | 65.00% | 72.91% | ||||
| Non-Traditional Hybrids | ||||||
| ZWGD | BMO Covered Call Spread Gold Bullion ETF | Hybrid/Alt | Tactical | 0.65% | 2.00% | 3.61% |
| ZGIF | BMO Global Infrastructure Fund ETF | Hybrid/Alt | Tactical | 1.05% | 5.00% | 4.23% |
| ZCOM | BMO Broad Commodity ETF | Hybrid/Alt | Tactical | 0.65% | 6.00% | 12.31% |
| Total Alternatives | 13.00% | 20.16% | ||||
| Total Cash | 0.00% | 0.00% | ||||
| Portfolio | 0.26% | 100.00% | 100.00% | |||
Source: BMO Global Asset Management, as of June 30, 2026. Model portfolio for illustrative purposes only. The information contained herein is not, and should not be construed as, investment, tax or legal advice to any party. These are not recommendations to buy or sell any particular security. Particular investments and/or trading strategies should be evaluated relative to the individual’s investment objectives and professional advice should be obtained with respect to any circumstance.
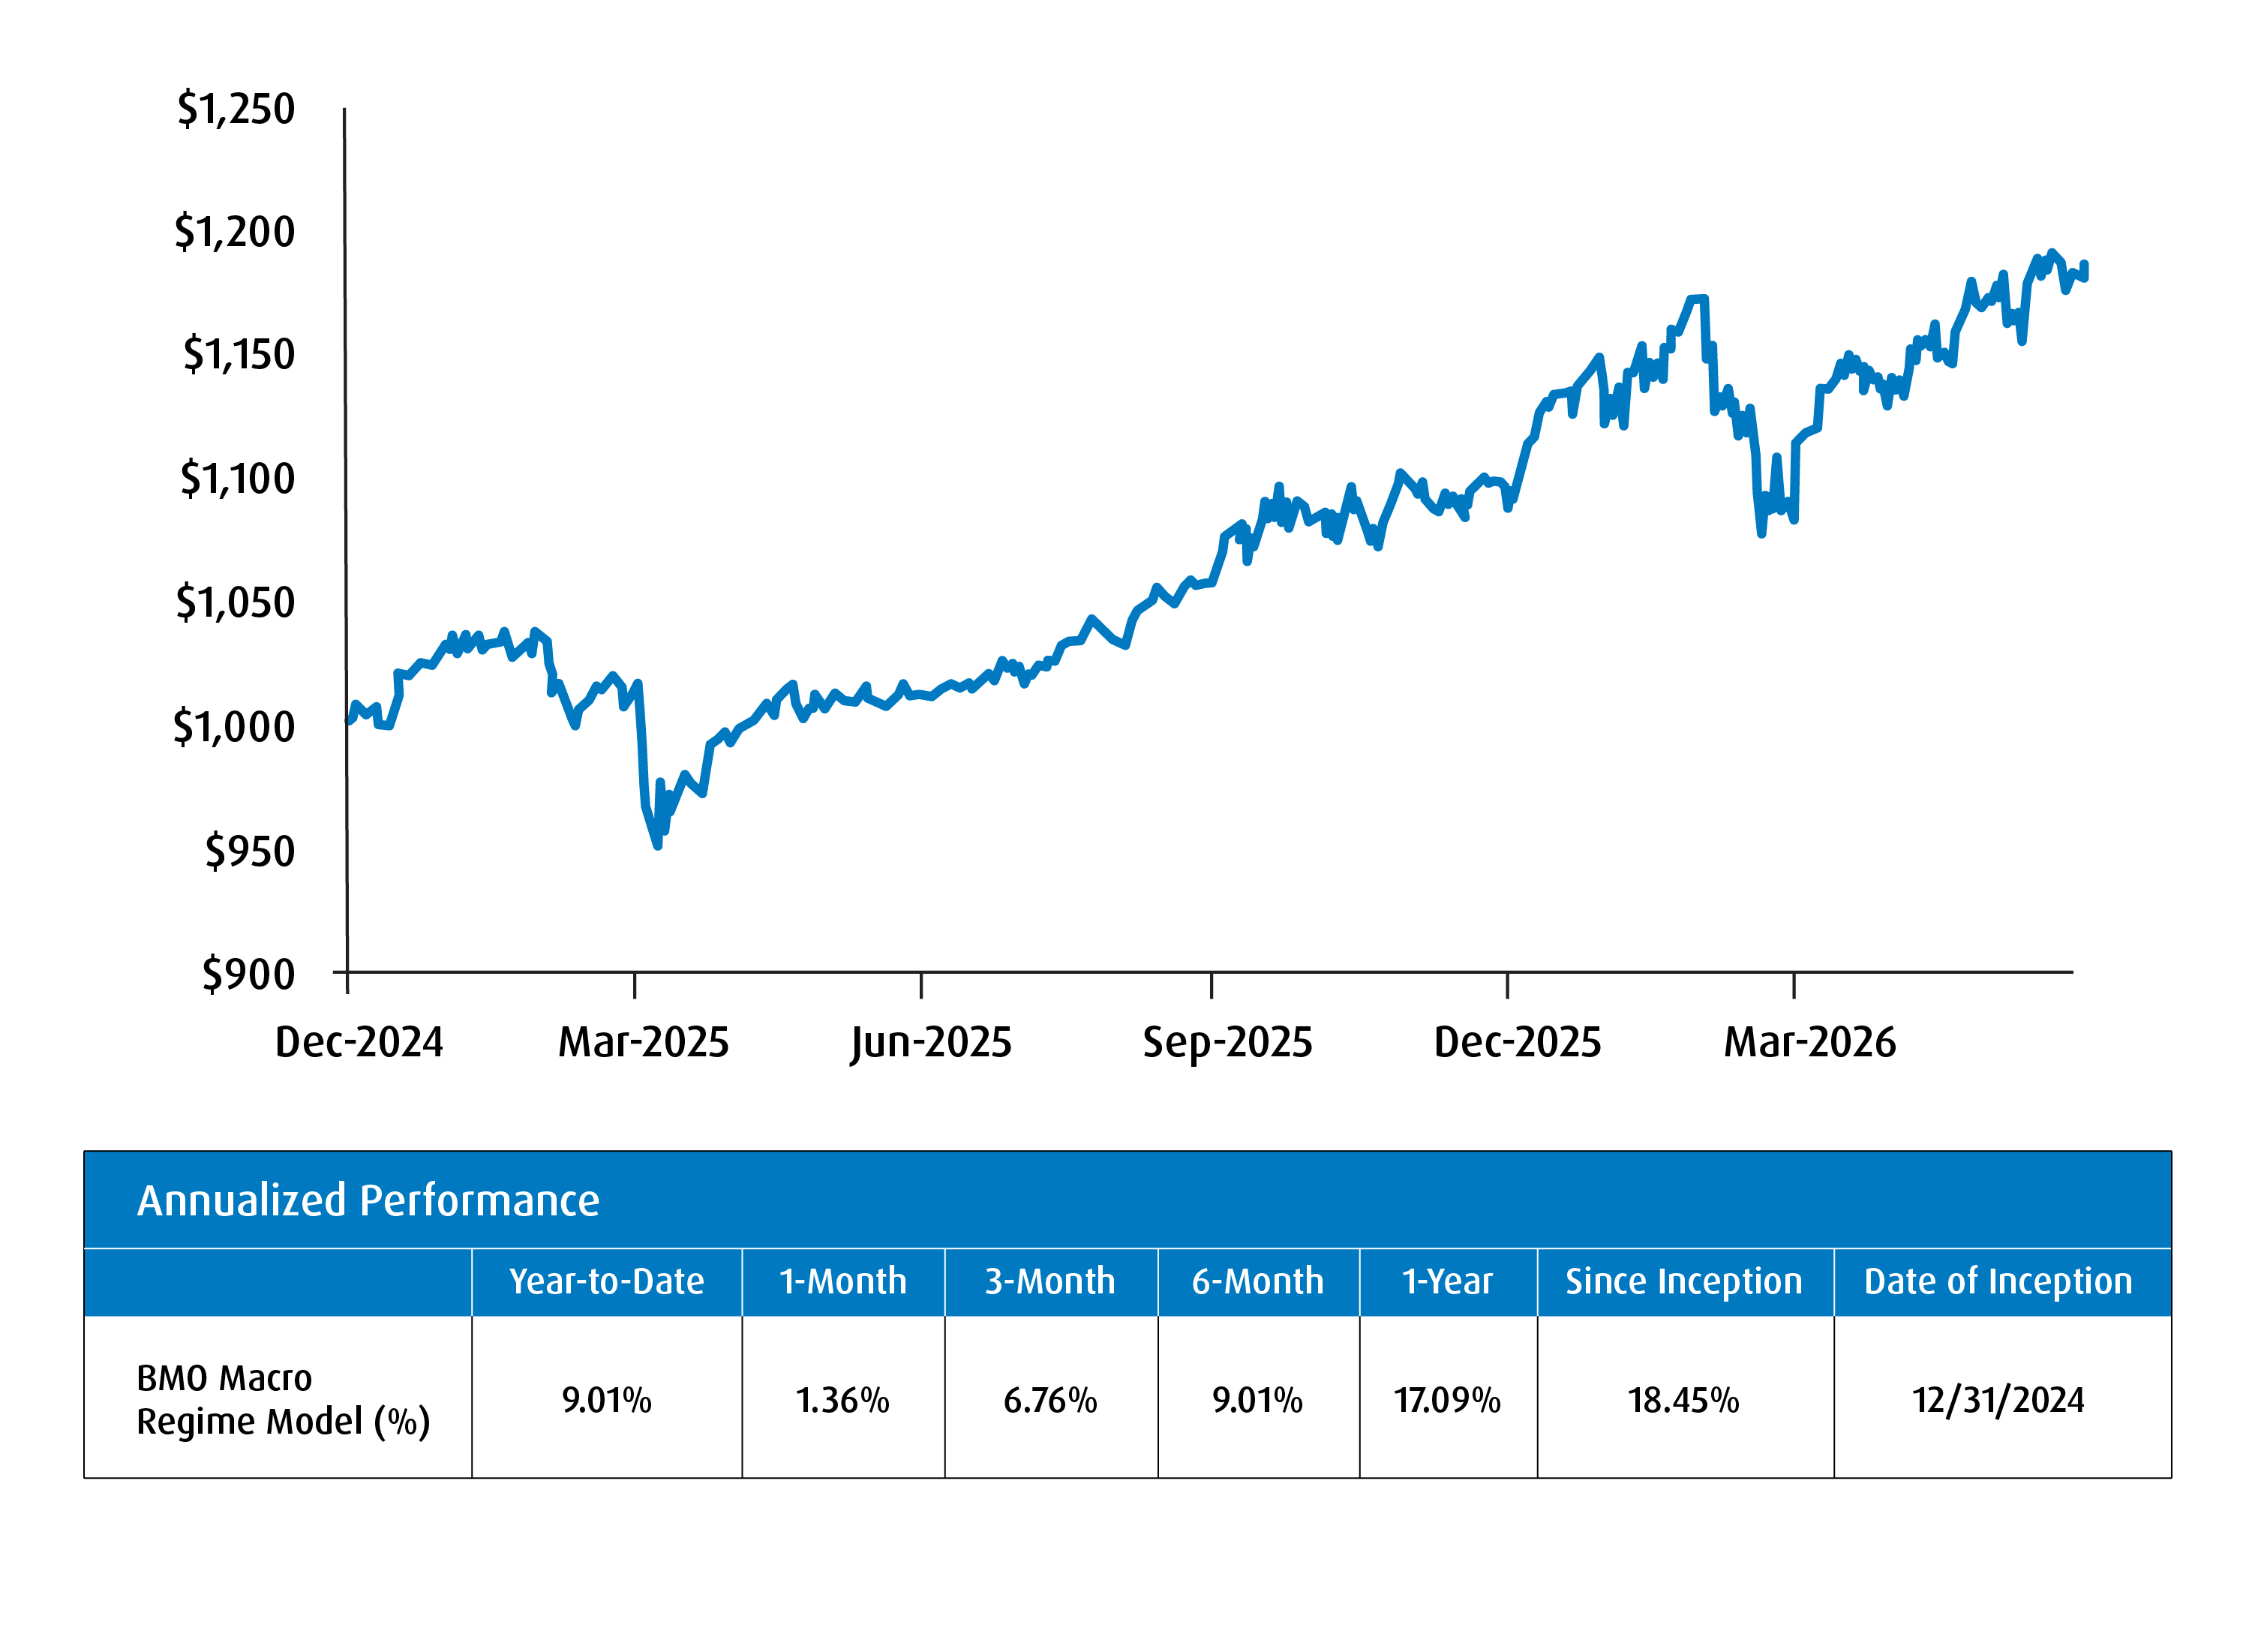
Performance of Portfolio
Portfolio Changes
Table 2 – Changes to the Macro Regime Portfolio (from Q2 to Q3 2026)
Sell/Trim |
Ticker |
Old weight |
(%) |
New weight |
|
5.00% |
-5.00% |
0.00% |
|||
5.00% |
-5.00% |
0.00% |
|||
7.00% |
-1.00% |
6.00% |
|||
9.00% |
-2.00% |
7.00% |
|||
4.00% |
-2.00% |
2.00% |
|||
| Buy/Add | Ticker | Old weight | % | New weight |
| BMO US Aggregate Bond Index ETF - Hedged | 0.00% | 8.00% | 8.00% | |
| BMO MSCI Emerging Markets Index ETF | 5.00% | 1.00% | 6.00% | |
| BMO Covered Call Canadian Banks ETF | 0.00% | 5.00% | 5.00% | |
| BMO Global Infrastructure Fund ETF | 4.00% | 1.00% | 5.00% |
Source: BMO Global Asset Management, as of June 30, 2026. Model portfolio for illustrative purposes only. The information contained herein is not, and should not be construed as, investment, tax or legal advice to any party. These are not recommendations to buy or sell any particular security. Particular investments and/or trading strategies should be evaluated relative to the individual’s investment objectives and professional advice should be obtained with respect to any circumstance.
Table 3 – Asset Allocation Splits Relative to Benchmark
Current Weight | Benchmark | ||
Fixed Income | 22% | 30% | Underweight |
Equities | 65% | 60% | Overweight |
Alts/Hybrids | 13% | 10% | Overweight |
Source: BMO Global Asset Management, as of June 30, 2026.
Chart 4 – Q3 Regional Exposure
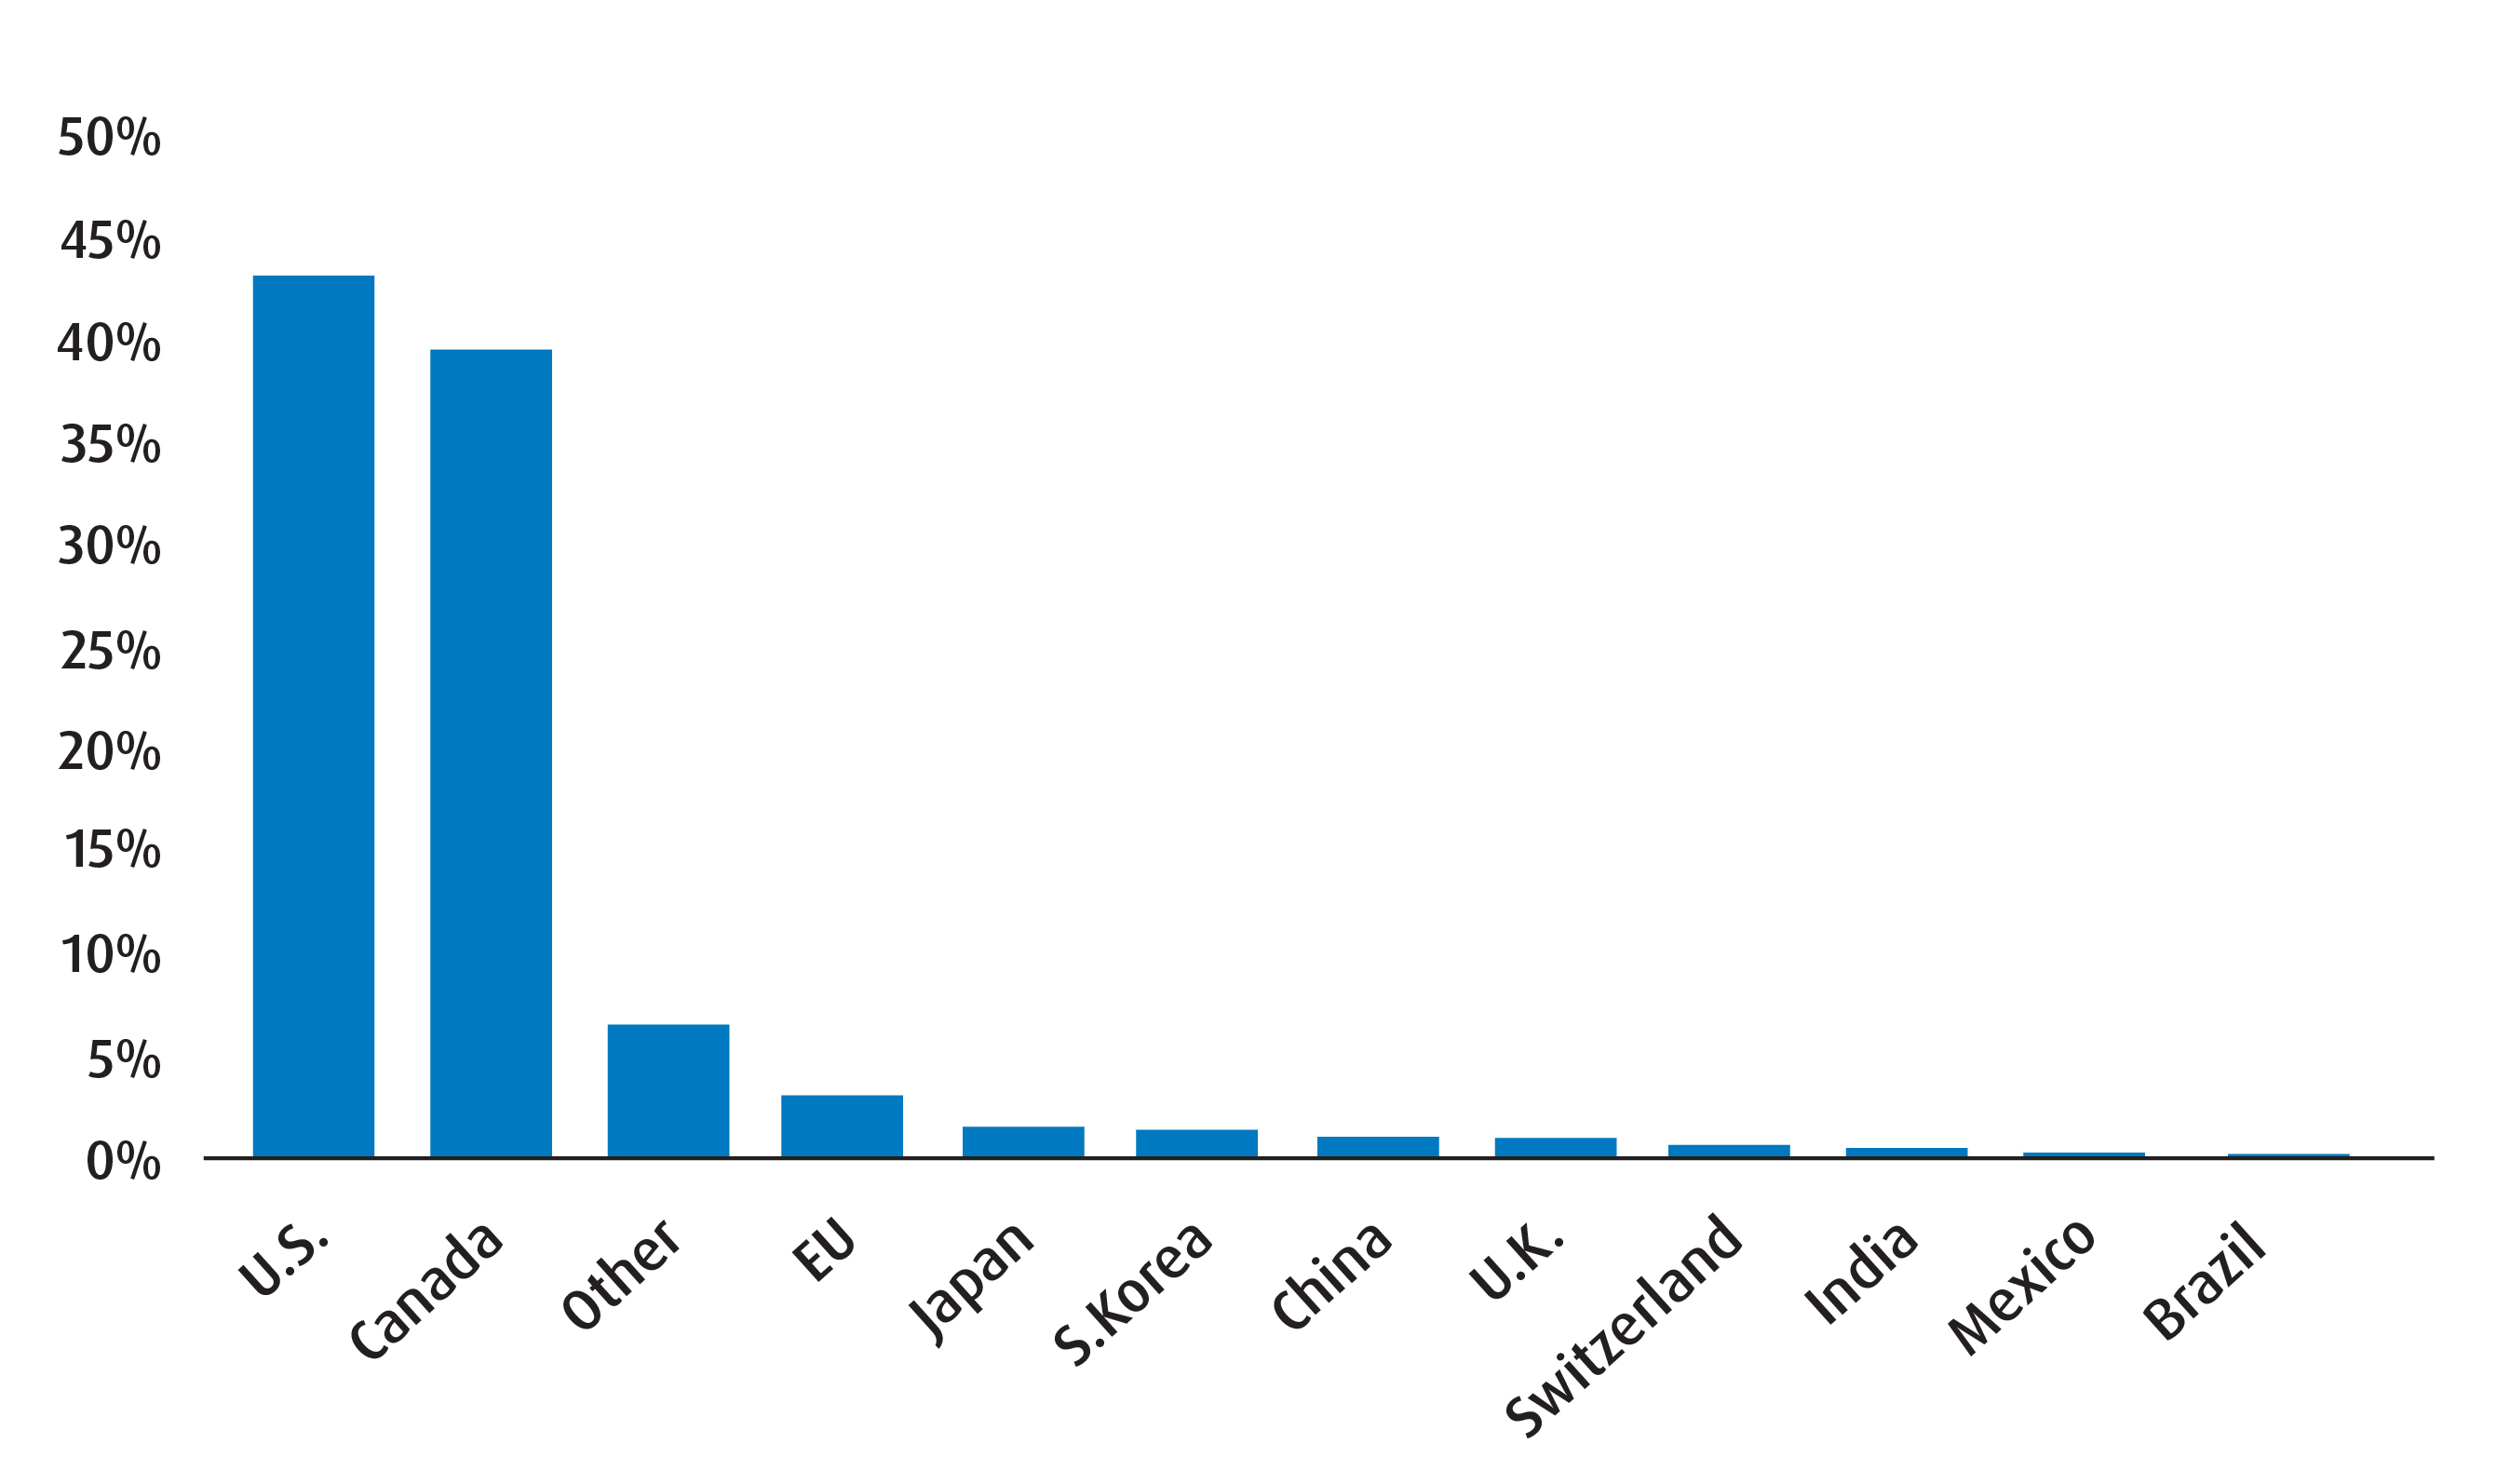
Chart 5 – Global Equity Sector Breakdown
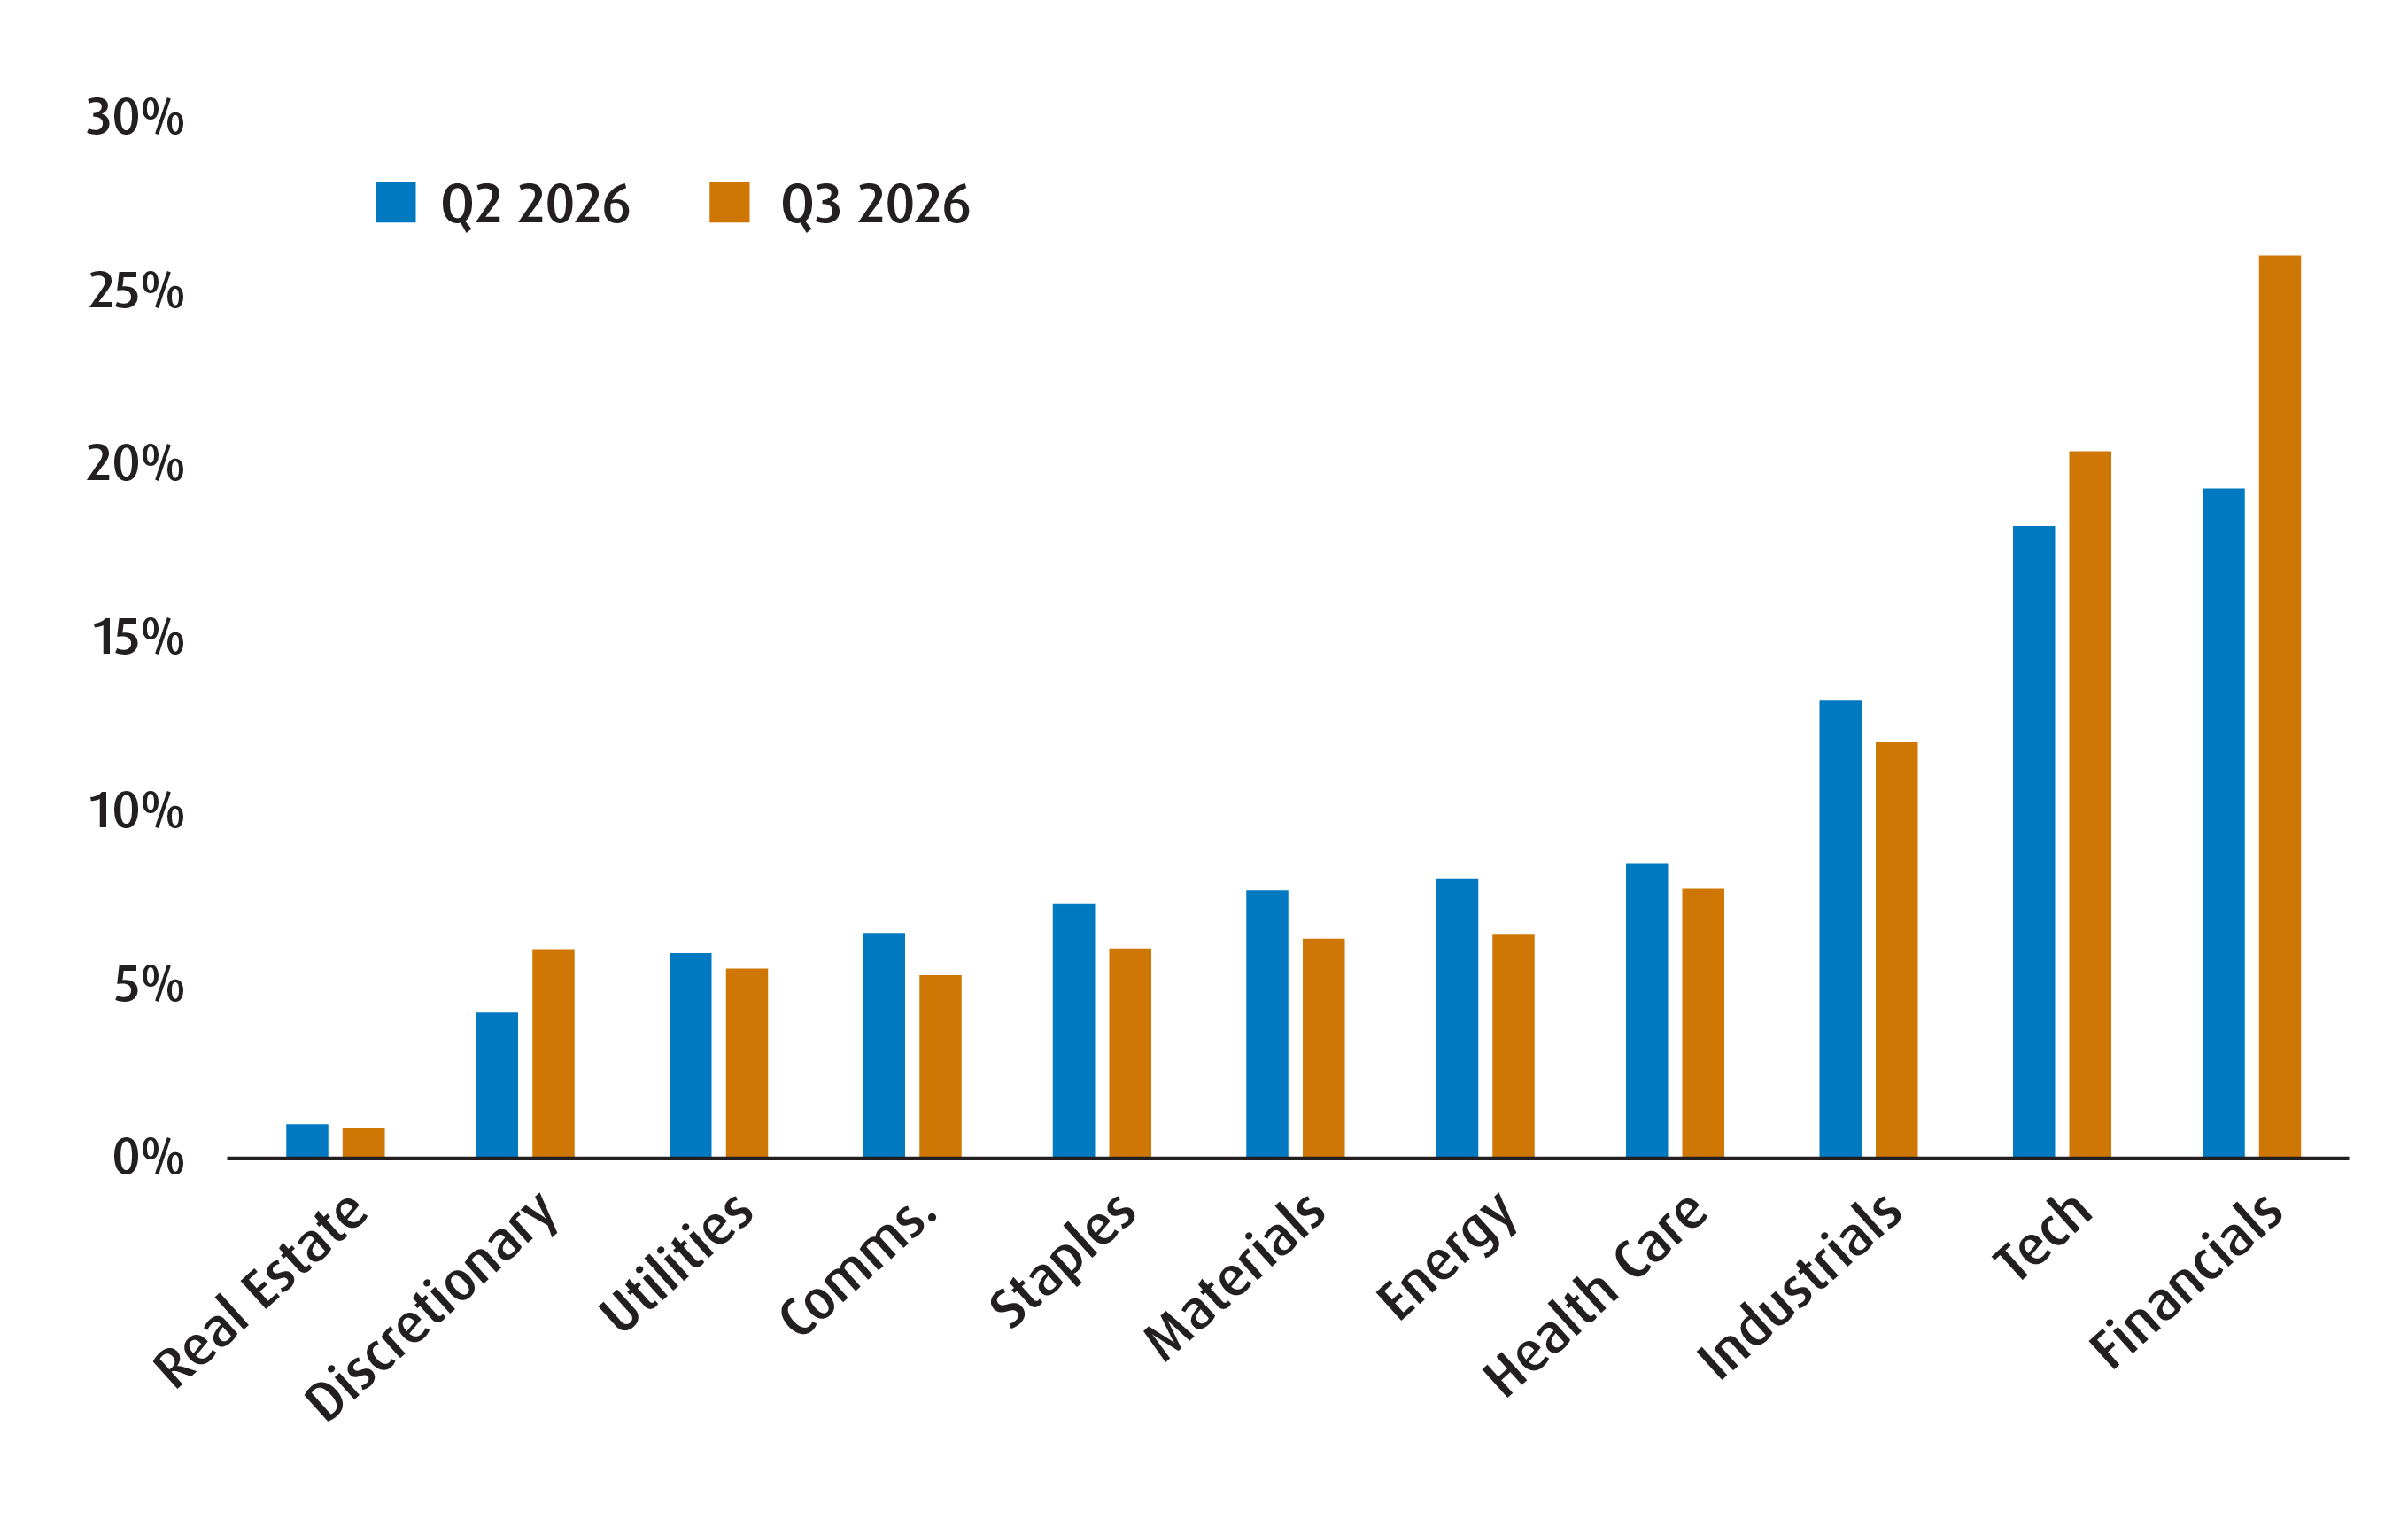
Table 4 – Fixed Income Sleeve Breakdown
Q3 2026 |
Q2 2026 |
|
Weighted Average Term |
6.87 |
5.11 |
Weighted Average Duration |
5.20 |
4.41 |
Weighted Average Coupon (%) |
3.03 |
2.49 |
Annualized Dist. Yield (%) |
2.86 |
3.02 |
Weighted Average Yield to Maturity (%) |
3.96 |
3.98 |
Source: BMO Global Asset Management, as of June 30, 2026. Model portfolio for illustrative purposes only. The information contained herein is not, and should not be construed as, investment, tax or legal advice to any party. These are not recommendations to buy or sell any particular security. Particular investments and/or trading strategies should be evaluated relative to the individual’s investment objectives and professional advice should be obtained with respect to any circumstance.
Table 5 – Standard Performance Data
Ticker |
Year-to-Date |
1-Month |
3-Month |
6-Month |
1-Year |
3-Year |
5-Year |
10-Year |
Since Inception |
Inception Date |
10.59% |
2.51% |
1.82% |
12.03% |
35.94% |
24.54% |
15.23% |
12.74% |
10.02% |
2009-05-29 |
|
9.89% |
3.94% |
0.50% |
10.80% |
22.60% |
18.23% |
11.45% |
9.76% |
8.92% |
2014-02-10 |
|
16.34% |
3.97% |
10.65% |
21.64% |
50.24% |
26.66% |
14.03% |
12.36% |
10.97% |
2011-01-28 |
|
25.83% |
9.88% |
10.52% |
26.39% |
55.45% |
24.98% |
9.77% |
10.90% |
7.23% |
2009-10-20 |
|
9.34% |
3.75% |
-1.62% |
5.83% |
15.03% |
12.70% |
11.40% |
9.99% |
13.53% |
2013-03-19 |
|
9.00% |
5.34% |
6.63% |
7.26% |
24.80% |
22.51% |
16.50% |
16.72% |
16.62% |
2014-11-05 |
|
1.58% |
1.37% |
-0.55% |
0.20% |
2.46% |
4.04% |
0.63% |
1.66% |
2.32% |
2014-02-10 |
|
ZCOM* |
— |
— |
— |
— |
— |
— |
— |
— |
— |
2025-10-21 |
1.70% |
0.69% |
0.50% |
1.97% |
5.45% |
8.39% |
— |
— |
4.18% |
2022-02-07 |
|
3.32% |
0.19% |
-11.55% |
5.48% |
33.21% |
— |
— |
— |
30.25% |
2025-05-22 |
|
0.99% |
1.84% |
-0.19% |
-1.03% |
5.67% |
4.35% |
— |
— |
4.23% |
2023-01-23 |
|
7.13% |
-1.76% |
-3.54% |
3.67% |
13.05% |
— |
— |
— |
16.43% |
2023-06-27[JS1] |
* Returns are not available as there is less than one year’s performance data. Source: BMO Global Asset Management, as of June 30, 2026. The portfolio holdings are subject to change without notice and only represent a percentage of portfolio holdings. They are not recommendations to buy or sell any particular security.
Visit bmo.com/etfs or contact Client Services at 1−800−361−1392.
To listen to our Views From the Desk BMO ETF Podcasts, please visit bmoetfs.ca.
BMO ETF Podcasts are also available on


Disclaimers
For advisor use only.
The portfolio holdings and asset allocations are subject to change without notice and individual holdings only represent a small percentage of portfolio holdings. They are not recommendations to buy or sell any particular security.
Any statement that necessarily depends on future events may be a forward-looking statement. Forward-looking statements are not guarantees of performance. They involve risks, uncertainties and assumptions. Although such statements are based on assumptions that are believed to be reasonable, there can be no assurance that actual results will not differ materially from expectations. Investors are cautioned not to rely unduly on any forward-looking statements. In connection with any forward-looking statements, investors should carefully consider the areas of risk described in the most recent prospectus.
The viewpoints expressed by the author represents their assessment of the markets at the time of publication. Those views are subject to change without notice at any time. The information provided herein does not constitute a solicitation of an offer to buy, or an offer to sell securities nor should the information be relied upon as investment advice. Past performance is no guarantee of future results.
This communication is for information purposes. The information contained herein is not, and should not be construed as, investment, tax or legal advice to any party. Particular investments and/or trading strategies should be evaluated relative to the individual’s investment objectives and professional advice should be obtained with respect to any circumstance.
Index returns do not reflect transactions costs or the deduction of other fees and expenses and it is not possible to invest directly in an Index. Past performance is not indicative of future results.
The ETFs referred to herein are not sponsored, endorsed, or promoted by MSCI and MSCI bear no liability with respect to an ETF or any index on which such ETF is based. The ETF’s prospectus contains a more detailed description of the limited relationship that MSCI has with the Manager and any related ETF.
The Index is a product of S&P Dow Jones Indices LLC or its affiliates (“SPDJI”), and has been licensed for use by the Manager. S&P®, S&P 500®, US 500, The 500, iBoxx®, iTraxx® and CDX® are trademarks of S&P Global, Inc. or its affiliates (“S&P”) and Dow Jones® is a registered trademark of Dow Jones Trademark Holdings LLC (“Dow Jones”), and these trademarks have been licensed for use by SPDJI and sublicensed for certain purposes by the Manager. The ETF is not sponsored, endorsed, sold or promoted by SPDJI, Dow Jones, S&P, their respective affiliates, and none of such parties make any representation regarding the advisability of investing in such product(s) nor do they have any liability for any errors, omissions, or interruptions of the Index.
The Select Sector SPDR Trust consists of eleven separate investment portfolios (each a “Select Sector SPDR ETF” or an “ETF” and collectively the “Select Sector SPDR ETFs” or the “ETFs”). Each Select Sector SPDR ETF is an “index fund” that invests in a particular sector or group of industries represented by a specified Select Sector Index. The companies included in each Select Sector Index are selected on the basis of general industry classification from a universe of companies defined by the S&P 500®. The investment objective of each ETF is to provide investment results that, before expenses, correspond generally to the price and yield performance of publicly traded equity securities of companies in a particular sector or group of industries, as represented by a specified market sector index.
The S&P 500, SPDRs, and Select Sector SPDRs are trademarks of The McGraw-Hill Companies, Inc. and have been licensed for use. The stocks included in each Select Sector Index were selected by the compilation agent. Their composition and weighting can be expected to differ to that in any similar indexes that are published by S&P. The S&P 500 Index is an unmanaged index of 500 common stocks that is generally considered representative of the U.S. stock market. The index is heavily weighted toward stocks with large market capitalizations and represents approximately two-thirds of the total market value of all domestic common stocks. The S&P 500 Index figures do not reflect any fees, expenses or taxes. An investor should consider investment objectives, risks, fees and expenses before investing.
You cannot invest directly in an index.
Commissions, management fees and expenses all may be associated with investments in exchange-traded funds. Please read the ETF Facts or prospectus of the BMO ETFs before investing. The indicated rates of return are the historical annual compounded total returns including changes in unit value and reinvestment of all dividends or distributions and do not take into account sales, redemption, distribution or optional charges or income taxes payable by any unitholder that would have reduced returns. Exchange-traded funds are not guaranteed, their values change frequently and past performance may not be repeated.
For a summary of the risks of an investment in the BMO ETFs, please see the specific risks set out in the BMO ETF’s prospectus. BMO ETFs trade like stocks, fluctuate in market value and may trade at a discount to their net asset value, which may increase the risk of loss. Distributions are not guaranteed and are subject to change and/or elimination.
Distribution yields are calculated by using the most recent regular distribution, or expected distribution, (which may be based on income, dividends, return of capital, and option premiums, as applicable) and excluding additional year end distributions, and special reinvested distributions annualized for frequency, divided by current net asset value (NAV). The yield calculation does not include reinvested distributions. Distributions are not guaranteed, may fluctuate and are subject to change and/or elimination. Distribution rates may change without notice (up or down) depending on market conditions and NAV fluctuations. The payment of distributions should not be confused with the BMO ETF’s performance, rate of return or yield. If distributions paid by a BMO ETF are greater than the performance of the investment fund, your original investment will shrink. Distributions paid as a result of capital gains realized by a BMO ETF, and income and dividends earned by a BMO ETF, are taxable in your hands in the year they are paid. Your adjusted cost base will be reduced by the amount of any returns of capital. If your adjusted cost base goes below zero, you will have to pay capital gains tax on the amount below zero.
Cash distributions, if any, on units of a BMO ETF (other than accumulating units or units subject to a distribution reinvestment plan) are expected to be paid primarily out of dividends or distributions, and other income or gains, received by the BMO ETF less the expenses of the BMO ETF, but may also consist of non-taxable amounts including returns of capital, which may be paid in the manager’s sole discretion. To the extent that the expenses of a BMO ETF exceed the income generated by such BMO ETF in any given month, quarter, or year, as the case may be, it is not expected that a monthly, quarterly, or annual distribution will be paid. Distributions, if any, in respect of the accumulating units of BMO Short Corporate Bond Index ETF, BMO Short Federal Bond Index ETF, BMO Short Provincial Bond Index ETF, BMO Ultra Short-Term Bond ETF and BMO Ultra Short-Term US Bond ETF will be automatically reinvested in additional accumulating units of the applicable BMO ETF. Following each distribution, the number of accumulating units of the applicable BMO ETF will be immediately consolidated so that the number of outstanding accumulating units of the applicable BMO ETF will be the same as the number of outstanding accumulating units before the distribution. Non-resident unitholders may have the number of securities reduced due to withholding tax. Certain BMO ETFs have adopted a distribution reinvestment plan, which provides that a unitholder may elect to automatically reinvest all cash distributions paid on units held by that unitholder in additional units of the applicable BMO ETF in accordance with the terms of the distribution reinvestment plan. For further information, see the distribution policy in the BMO ETFs’ prospectus.
BMO ETFs are managed and administered by BMO Asset Management Inc., an investment fund manager and a portfolio manager, and a separate legal entity from Bank of Montreal.
BMO Global Asset Management is a brand name under which BMO Asset Management Inc. and BMO Investments Inc. operate.
“BMO (M-bar roundel symbol)” is a registered trademark of Bank of Montreal, used under licence.