BMO Macro Regime Model – Strategy Report (Q4 2026)
All prices, returns and portfolio weights are as of market close on September 30, 2026, unless otherwise indicated.



Sirens on the Horizon
Both as an epic poem and as a summer blockbuster hit film, ‘The Odyssey’ offers many lessons. For those of us in the investment profession, the most important one is to appreciate the evolving risks and what they could mean for our base case scenarios – lest we end up lost like our hero Odysseus. And to be frank, there are a lot of similarities between the beginning of Odysseus’s journey and where we are in the market cycle right now.
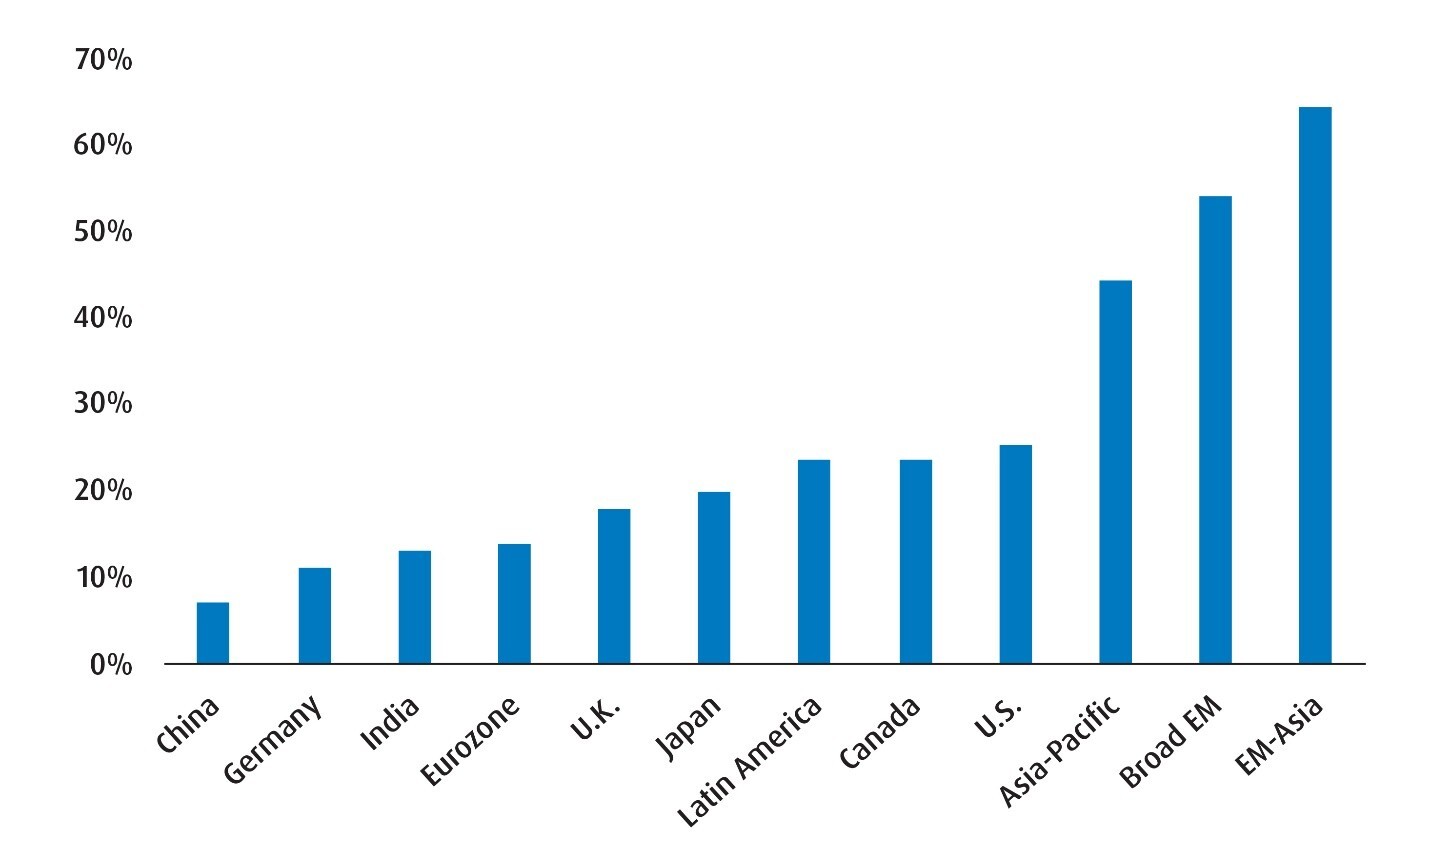
Chart 1 – Long-Term Drivers for U.S. Long-End Yields
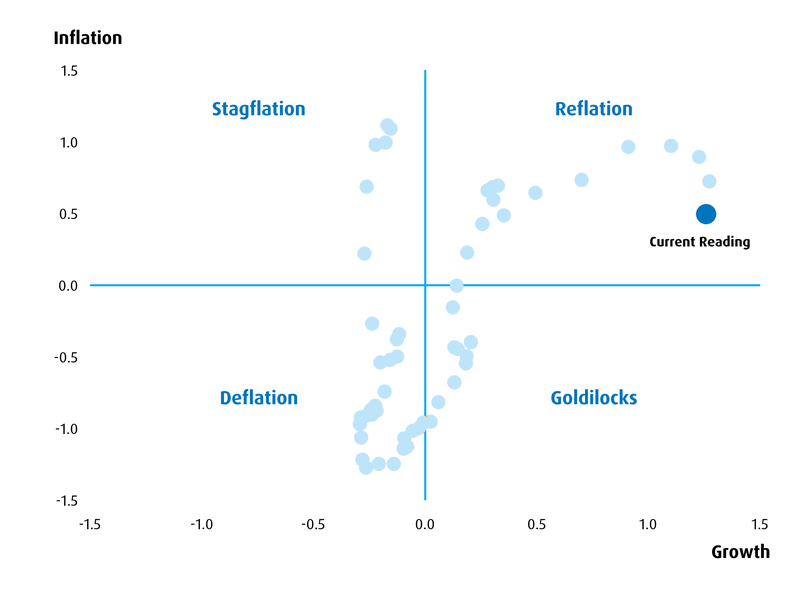
Currently, we remain entrenched in the ‘reflation’ part of the macroeconomic cycle. That is when most leading indicators imply that economic growth remains firm while price pressures remain sticky. Recent data backs this view – with composite PMIs across the world’s largest economies still above levels that mark expanding economic growth (the notable exception being China). The recent estimate for the September PMI reading in the U.S. indicates that businesses haven’t been this optimistic about future sales growth in years. That is also aligned to the strong U.S. data of late – including recent nonfarms and retail sales reports – which suggests that the economy is expanding above its estimated potential growth rate.
This is the backdrop that we’ve operated in for several quarters, and it should continue to support broad risk appetite. However, we must also be mindful of the rising risks that are making this backdrop more precarious to those from prior quarters.
For instance, the conflict in the Middle East continues to complicate matters. It’s now been over seven months of below normal traffic through the Strait of Hormuz – with global shortages leading to a pronounced increase in the prices of both energy and refined products. That is directly feeding into producer and consumer prices such that central banks can no longer look past the second-round effects. Indeed, three of the ‘big four’ central banks have hiked policy rates over the past month (the Federal Reserve, or the Fed, the European Central Bank, the Bank of Japan). There is also a very good chance that the Bank of Canada will end up hiking rates at one of its two remaining meetings this year. These are the main reasons why front-end yields have been rising across several markets.
Equally important are the moves in the long end, which are being driven by a multitude of factors. For one, there is increased competition amongst issuers, with U.S. corporations (hyperscalers mainly) looking to term out borrowing. That is ‘crowding out’ sovereign bonds in the long end. Second, the artificial intelligence (AI) boom is compounding the narrative of robust U.S. economic growth, which is raising market estimates of the long-run neutral interest rate – pushing up long-end yields in the process. Finally, credibility risk is rising as few countries are seriously considering fiscal discipline at this point. All these factors are weighing on buyers in the long end, who are now far more price sensitive than they have been in years past.
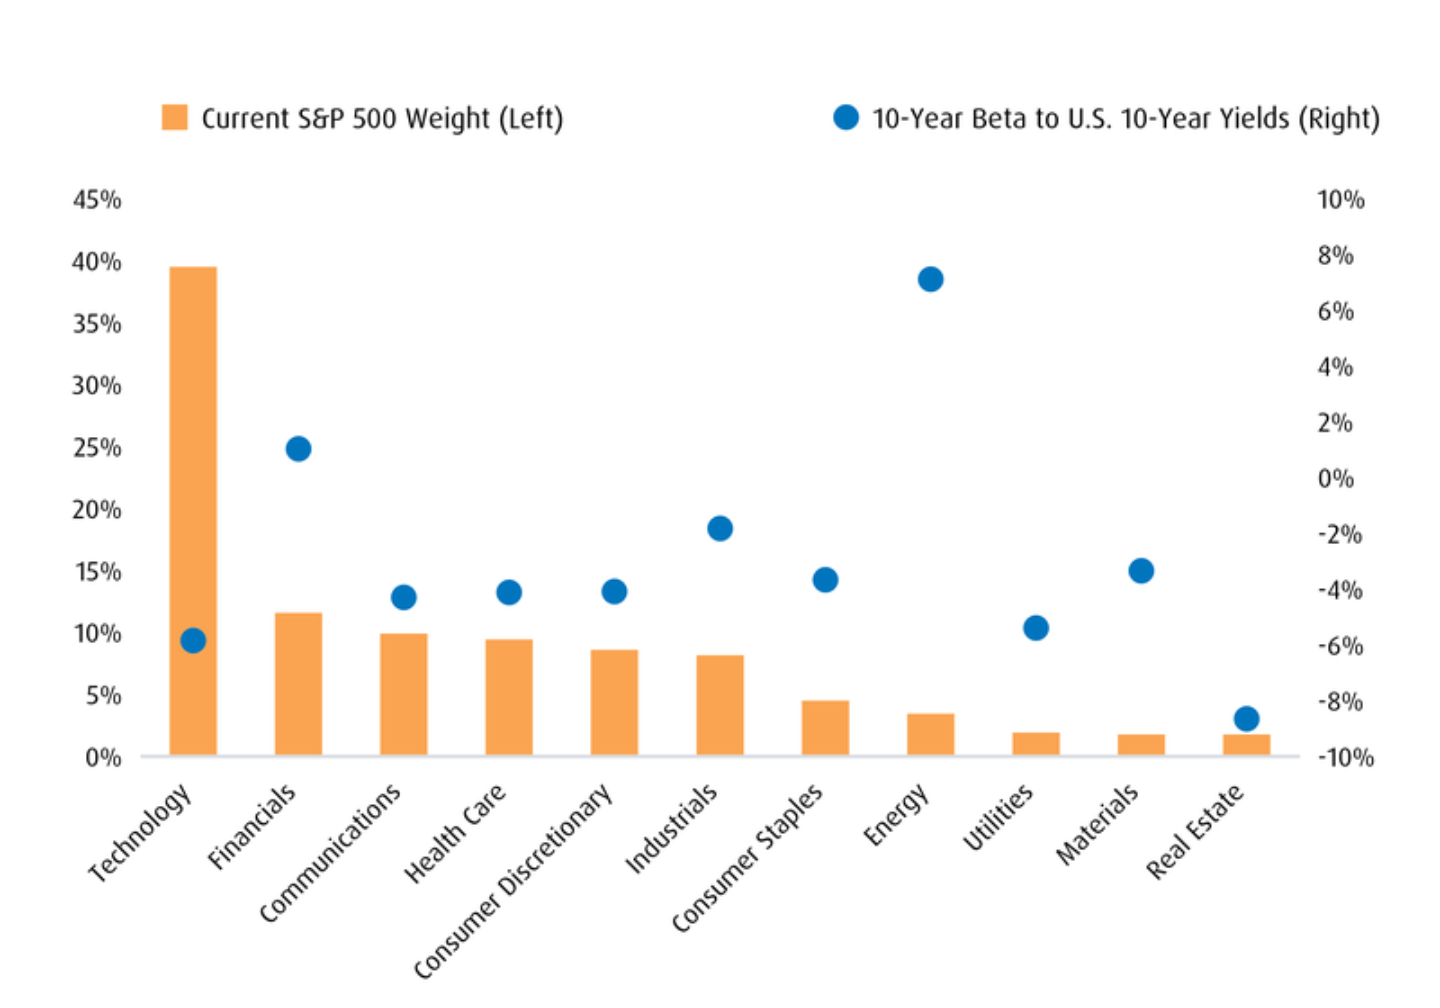
And remember that given its composition, the S&P 500 is effectively a long duration asset. Sectors that are mostly made up of firms whose valuation depends heavily on distant future cash flows (like technology, communication services, consumer discretionary, etc.) make up around 60% of the index. That leaves them vulnerable to higher long-end yields.
Chart 2 – The Majority of S&P 500 Sectors are Negatively Correlated to U.S. 10-Year Yield Shifts
Another risk for markets is no longer a nascent one – the public backlash against AI. At the very least, this has been compounded by recent news that some frontier models had gone rogue, leading to a push within the industry for increased self-regulation or “pacing.” That compounds the lack of favourability of AI among the voting public that politicians are finding harder to ignore. For us, increased ‘pacing’ or regulation will matter given the heavy degree of capital investment we’ve seen go into the space. Any signs of waning demand or excess data center capacity imply a capex slowdown – a serious risk for both economic growth and for risk appetite.
The combination of higher-for-longer energy prices, bond yields and increased risk of AI regulation makes us a bit more nervous about the current reflation-like backdrop than we have been in the past. The easy gains are no longer there as we’re moving from participating in the reflation backdrop to navigating it.
For our fixed income sleeve, remaining underweight is relatively straightforward. True, there is the temptation to look at higher yields as an opportunity, but the factors driving yields higher are too strong to fade at the current moment. At the very least, we’ll need to see evidence of slowing equity market and economic momentum before we become interested in the U.S. rates space. For our alternatives sleeve, we’re remaining overweight given our unease with the current inflation picture.
Additionally, we are growing more cautious with our equity outlook. While we’re maintaining an overweight position in our equity sleeve, we’re reducing the amount of downside risk embedded in that position through a greater allocation to lower volatility strategies. That allows us to participate in the upside, while paying greater tribute to the rising downside risks. As a result, our risk-weight for equities is substantially less than it has been in prior quarters.
To conclude, the journey is far from over. Like Odysseus, we remain committed to reaching our destination – but with the waters becoming more treacherous, we believe the next leg of the voyage calls for greater caution, not retreat.
Table 1 – BMO Macro Regime Model Portfolio for Q4 2026
| Ticker | ETF Name | Sector Positioning | Management Fee | Weight (%) | Volatility Contribution | |
| Fixed Income | ||||||
| ZDB | BMO Discount Bond Index ETF | Fixed Income | Core | 0.09% | 8.00% | 3.12% |
| ZUAG.F | BMO US Aggregate Bond Index ETF - Hedged | Fixed Income | Core | 0.08% | 6.00% | 2.84% |
| ZBI | BMO Canadian Bank Income Index ETF | Fixed Income | Tactical | 0.25% | 4.00% | 0.87% |
| ZAAA.F | BMO AAA CLO ETF | Fixed Income | Tactical | 0.20% | 4.00% | 0.64% |
| Total Fixed Income | 22.00% | 7.47% | ||||
| Equities | ||||||
| ZUQ | BMO MSCI USA High Quality Index ETF | Equity | Core | 0.30% | 20.00% | 21.34% |
| ZCN | BMO S&P/TSX Capped Composite Index ETF | Equity | Core | 0.05% | 20.00% | 20.19% |
| ZEA | BMO MSCI EAFE Index ETF | Equity | Core | 0.20% | 10.00% | 12.48% |
| ZEM | BMO MSCI Emerging Markets Index ETF | Equity | Tactical | 0.25% | 3.00% | 7.71% |
| ZOCT | BMO US Equity Buffer ETF - October | Equity | Tactical | 0.65% | 8.00% | 2.56% |
| ZPAY | BMO Premium Yield ETF | Equity | Tactical | 0.65% | 2.00% | 1.51% |
| Total Equity | 63.00% | 65.79% | ||||
| Non-Traditional Hybrids | ||||||
| ZGLD | BMO Gold Bullion ETF | Hybrid/Alt | Tactical | 0.20% | 5.00% | 10.74% |
| ZGIF | BMO Global Infrastructure Fund ETF | Hybrid/Alt | Tactical | 1.05% | 4.00% | 3.27% |
| ZCOM | BMO Broad Commodity ETF | Hybrid/Alt | Tactical | 0.26% | 6.00% | 12.74% |
| Total Alternatives | 15.00% | 26.74% | ||||
| Total Cash | 0.00% | 0.00% | ||||
| Portfolio | 0.25% | 100.00% | 100.00% |
Source: BMO Global Asset Management.
For our fixed income sleeve, remaining underweight is relatively straightforward. True, there is the temptation to look at higher yields as an opportunity, but the factors driving yields higher are too strong to fade at the current moment. At the very least, we’ll need to see evidence of slowing equity market and economic momentum before we become interested in the U.S. rates space. For our alternatives sleeve, we’re remaining overweight given our unease with the current inflation picture.
Additionally, we are growing more cautious with our equity outlook. While we’re maintaining an overweight position in our equity sleeve, we’re reducing the amount of downside risk embedded in that position through a greater allocation to lower volatility strategies. That allows us to participate in the upside, while paying greater tribute to the rising downside risks. As a result, our risk-weight for equities is substantially less than it has been in prior quarters.
To conclude, the journey is far from over. Like Odysseus, we remain committed to reaching our destination – but with the waters becoming more treacherous, we believe the next leg of the voyage calls for greater caution, not retreat.
Table 2 – Changes to the Macro Regime Portfolio (from Q3 to Q4 2026)
Sell/Trim | Ticker | Old weight | (%) | New weight |
8.00% | -2.00% | 6.00% | ||
| BMO Canadian Bank Income Index ETF | ZBI | 6.00% | -2.00% | 4.00% |
| BMO MSCI USA High Quality Index ETF | ZUQ | 8.00% | -3.00% | 20.00% |
| BMO MSCI Emerging Markets Index ETF | ZEM | 6.00% | -3.00% | 3.00% |
| BMO Low Volatility US Equity ETF | ZLU | 4.00% | -4.00% | 0.00% |
| BMO Covered Call Canadian Banks | ZWB | 5.00% | -5.00% | 0.00% |
| BMO Covered Call Spread Gold Bullion ETF | ZWGD | 2.00% | -2.00% | 0.00% |
| BMO Global Infrastructure Fund ETF | ZGIF | 5.00% | -1.00% | 4.00% |
Buy/Add | ||||
| BMO AAA CLO ETF (Hedged Units) | ZAAA/F | 0.00% | 4.00% | 4.00% |
| BMO MSCI EAFE Index ETF | ZEA | 7.00% | 3.00% | 10.00% |
| BMO US Equity Buffer Hedged to CAD ETF - October | ZOCT | 0.00% | 8.00% | 8.00% |
| BMO Premium Yield ETF | ZPAY | 0.00% | 2.00% | 2.00% |
| BMO Gold Bullion ETF | ZGLD | 0.00% | 5.00% | 5.00% |
Source: BMO Global Asset Management.
Table 3 – Asset Allocation Splits Relative to Benchmark
Current Weight | Benchmark | ||
Fixed Income | 22% | 30% | Underweight |
Equities | 63% | 60% | Slight Overweight |
Alts/Hybrids | 15% | 10% | Overweight |
Source: BMO Global Asset Management, as of September 30, 2026.
Asset Allocation
- Our Macro Regime model output still suggests that we’re in the ‘reflation’ phase of the cycle – which generally favours cyclicals and commodities. However, we’re now entering a different part of the monetary cycle (towards tightening), which means we need to exercise more caution when it comes to allocation and security selection.
- We’re sticking with an underweight position for duration/income (at 22% for this quarter). That reflects our concern on the current inflation trend as well as the supply/demand factors that are playing out in the long end of the curve. For now, we favour Canadian dollar (CAD) duration over the U.S., though we may look to add to the latter if we see signs of slowing growth in upcoming data.
- Relative to Q2, we’ve pared some of the risk in our growth sleeve in two ways. For one, we’ve reduced our equity weight from 65% in Q3 to 63% in Q4. Second, we’re allocating more weight to products that are lower volatility in nature to reduce the risk weight of the equity sleeve. Of course, we’re still overweight equities as we feel the backdrop is constructive, but the shifts pay tribute to the fact that there’s less room for error from here.
- Within the alternatives sleeve, we’ve increased our allocation slightly to 15% and will continue to maintain an overweight position. Again, this reflects our concern with the sticky nature of the inflation and the need for adequate hedges in the portfolio.
- In terms of currency implementation, we’re electing to keep our U.S. equity and alternatives exposure unhedged while maintaining a hedged position on our U.S. fixed income exposure. This reflects our view that U.S. dollar (USD) risk mitigates the overall volatility of the equities/alternatives sleeves more effectively.
- USD/CAD has moved higher by over 2% in September. This is likely due to general strength in the USD against most developed currencies – which itself is partly due to a reassessment of Fed tightening expectations. Nevertheless, we are due for some consolidation in USD/CAD, albeit above the 1.40 mark.
Chart 3 – Macro Regime Model Output for Q4 2026
Fixed Income
- We’re curbing our core position in U.S. duration (ZUAG/F – BMO US Aggregate Bond Index ETF Hedged) and in our tactical position for Canadian bank credit (ZBI – BMO Canadian Bank Income Index ETF). We’re using both to fund a position in U.S. AAA CLOs (via ZAAA/F – BMO AAA CLO ETF Hedged).
- We covered our rationale on U.S. duration in the lead article. For Canadian bank credit, we felt it was prudent to trim our allocation given current positioning. For ZAAA, we like the floating rate exposure in this environment and generally feel that private sector balance sheets are in decent shape for now.
Equities
- We’ve shifted the weights for our core positions in ZUQ (BMO MSCI USA High Quality Index ETF) and ZEA (BMO MSCI EAFE Index ETF). Indeed, we’ve cut the allocation to the former and added to the latter to reduce the volatility contribution from the equity sleeve while also diversifying geographically.
- Within the tactical positions, we’re halving our allocation to ZEM (BMO MSCI Emerging Markets Index ETF) and removing our positions in ZLU (BMO Low Volatility US Equity ETF) and ZWB (BMO Covered Call Canadian Banks).
- In line with our goal of lowering the overall risk weight of our equity allocations, we are introducing two new tactical positions: ZOCT (BMO US Equity Buffer ETF – October) and ZPAY (BMO Premium Yield ETF). Both of these exposures are in sympatico with our view that equity markets should consolidate while also paying tribute to rising risks.
Alts/Non-Traditional Hybrids
- Again, the ‘sticky’ nature of inflation concerns us right now, which is why we’re opting to maintain our overweight for the alternatives sleeve.
- We’re upping our allocation to gold – but swapping out of ZWGD (BMO Covered Call Spread Gold Bullion) and into ZGLD (BMO Gold Bullion ETF). We’re maintaining a position for the former in our other portfolios.
Chart 4 - Q4 2026 Macro Regime Model Regional Exposure
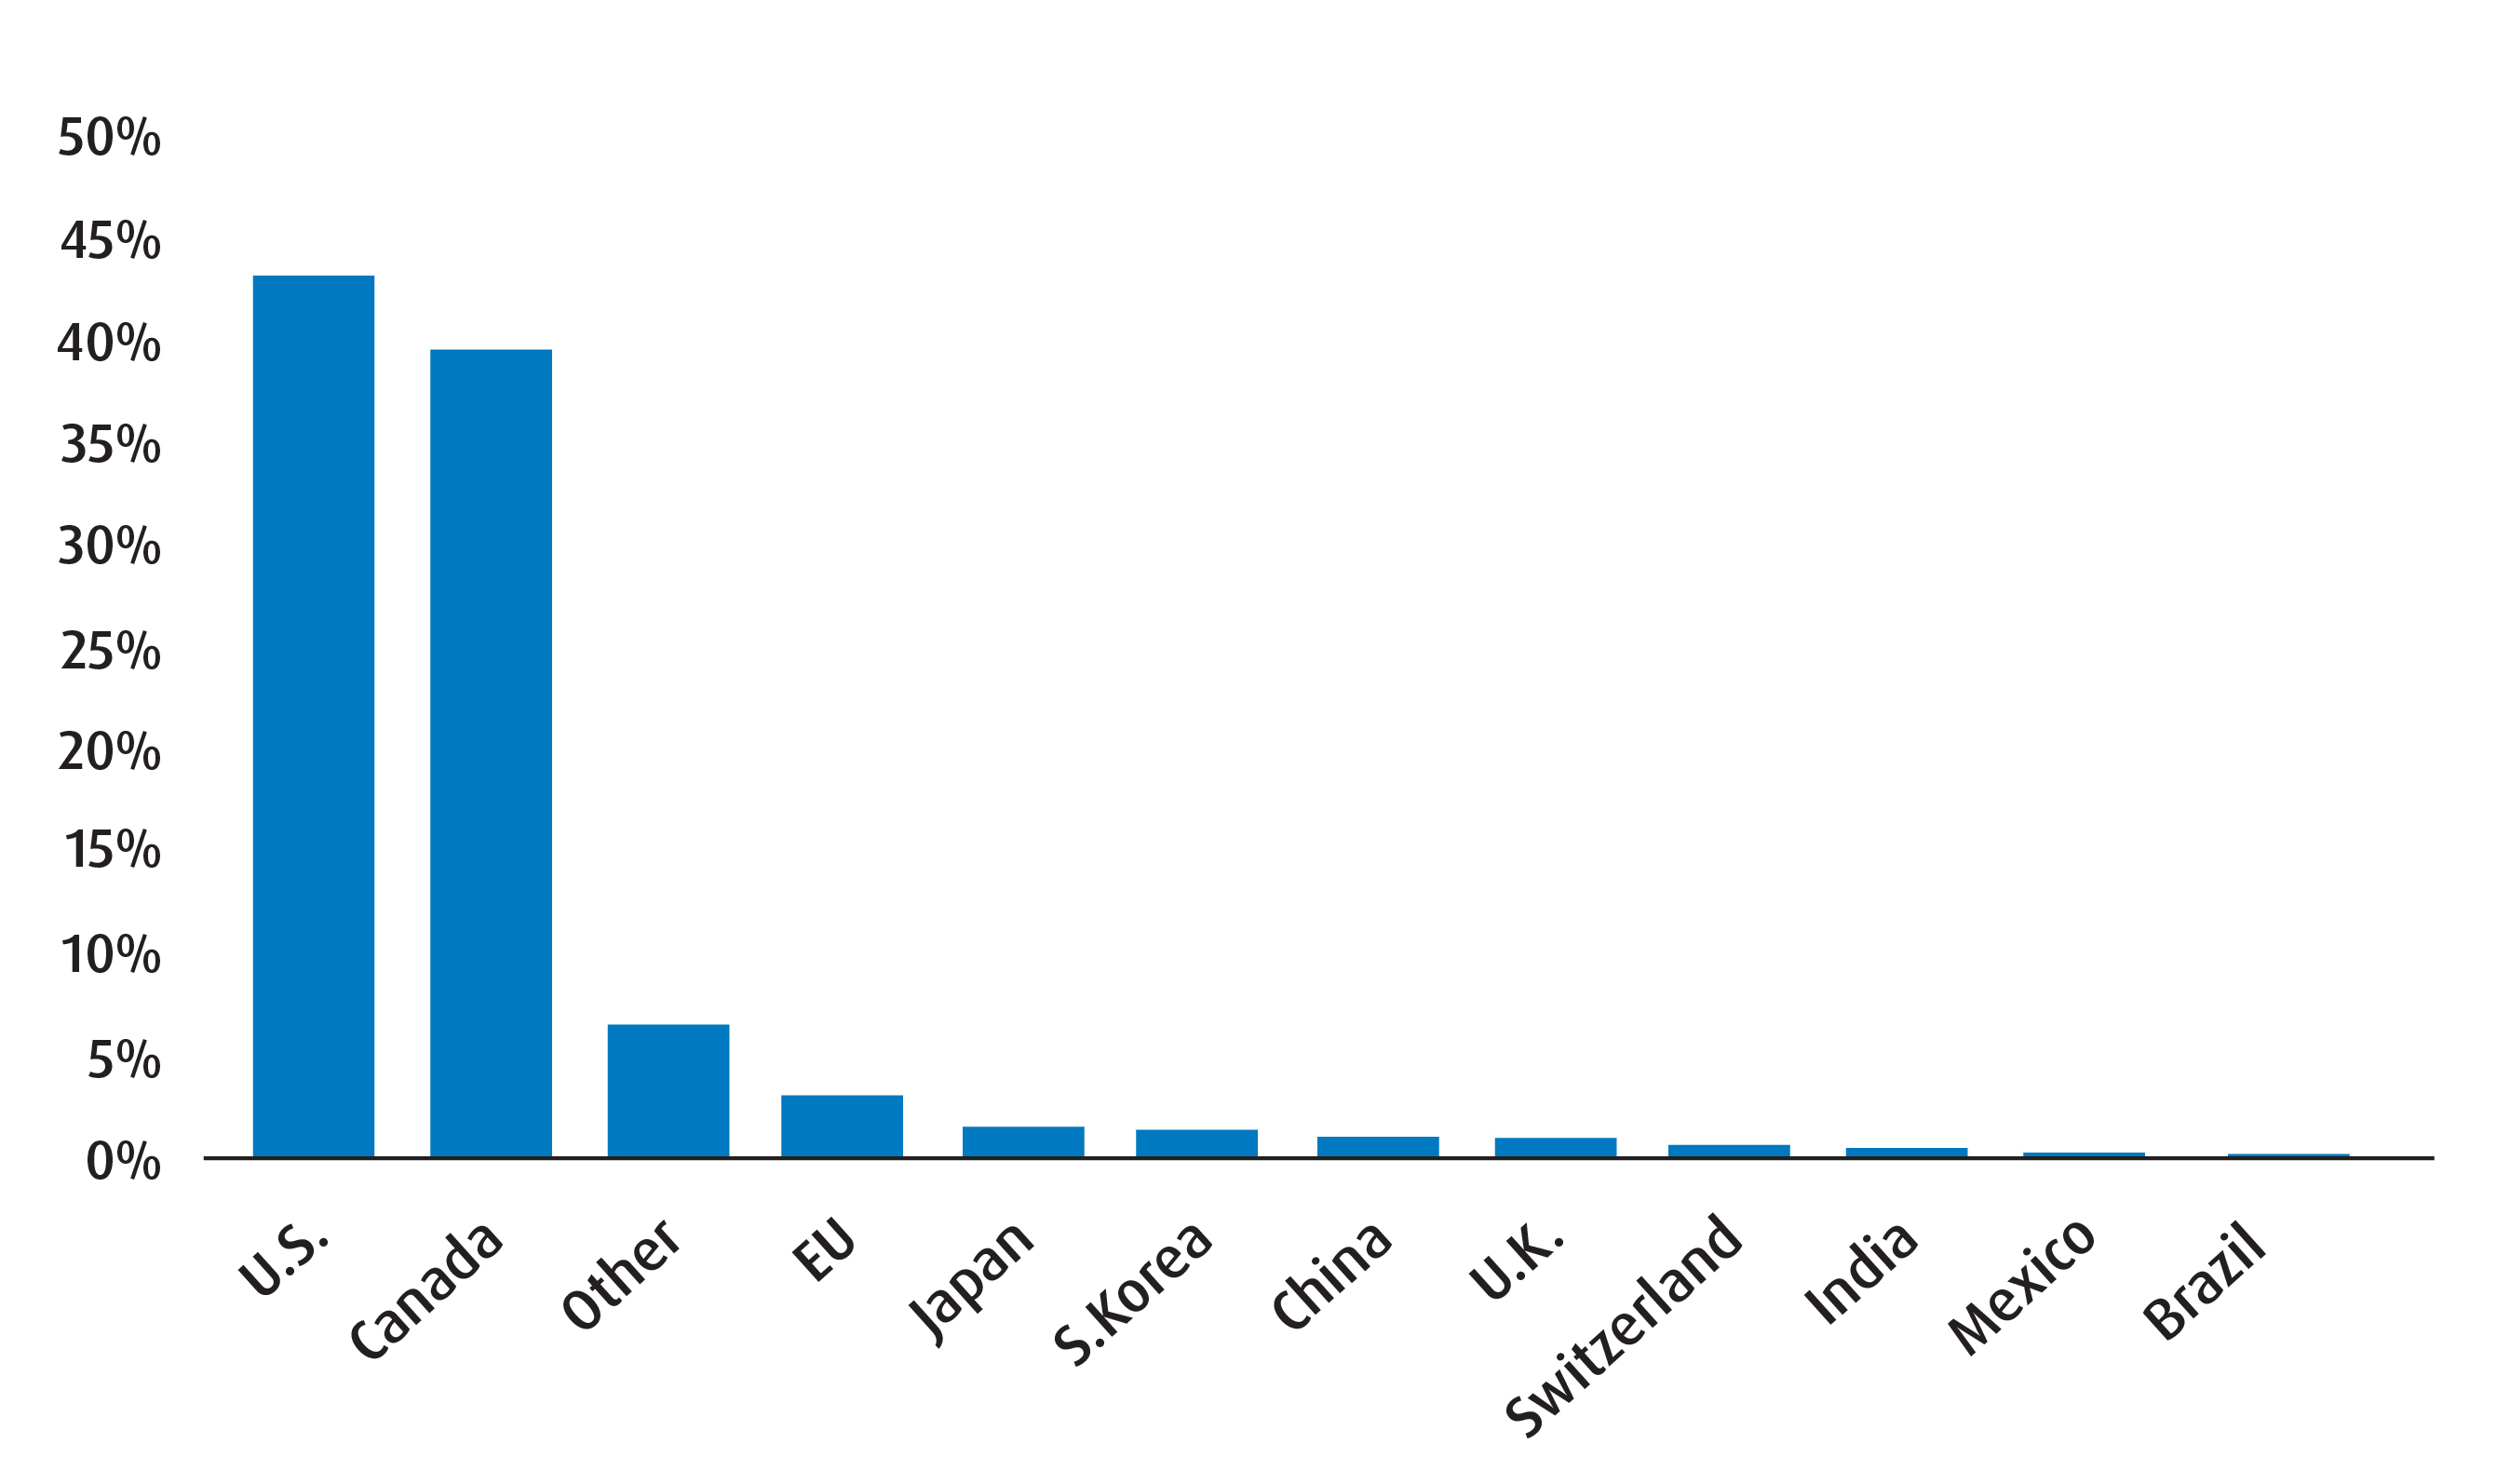
Chart 5 – Macro Regime Model Global Equity Sector Breakdown
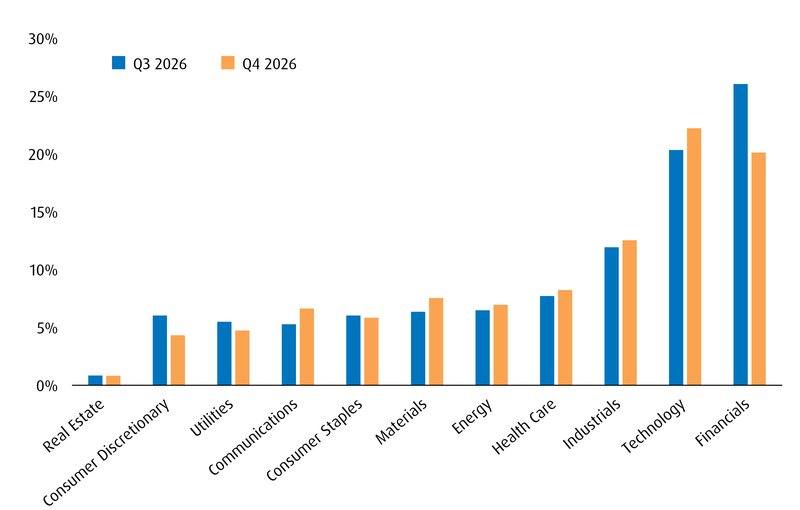
Table 4 – Fixed Income Sleeve Breakdown
Q4 2026 |
Q3 2026 |
|
Weighted Average Term |
7.98 |
6.87 |
Weighted Average Duration |
4.41 |
5.20 |
Weighted Average Coupon (%) |
3.27 |
3.03 |
Annualized Dist. Yield (%) |
3.18 |
2.86 |
Weighted Average Yield to Maturity (%) |
4.71 |
3.96 |
Source: BMO Global Asset Management, as of September 30, 2026. Model portfolio for illustrative purposes only. The information contained herein is not, and should not be construed as, investment, tax or legal advice to any party. These are not recommendations to buy or sell any particular security. Particular investments and/or trading strategies should be evaluated relative to the individual’s investment objectives and professional advice should be obtained with respect to any circumstance.
Macro Regime Model Performance of Portfolio
Q4 2026 BMO ETFs Fixed Income Model Strategy Report >
Q4 2026 BMO ETFs Tax Efficient Model Portfolio Report >
Visit bmo.com/etfs or contact Client Services at 1−800−361−1392.
To listen to our Views From the Desk BMO ETF Podcasts, please visit bmoetfs.ca.
BMO ETF Podcasts are also available on


Disclaimers
For advisor use only.
For advisors only. No portion of this material may be reproduced or distributed to retail clients. Any statement that necessarily depends on future events may be a forward-looking statement. Forward-looking statements are not guarantees of performance. They involve risks, uncertainties and assumptions. Although such statements are based on assumptions that are believed to be reasonable, there can be no assurance that actual results will not differ materially from expectations. Investors are cautioned not to rely unduly on any forward-looking statements. In connection with any forward-looking statements, investors should carefully consider the areas of risk described in the most recent prospectus.
The viewpoints expressed by the author represents their assessment of the markets at the time of publication. Those views are subject to change without notice at any time. The information provided herein does not constitute a solicitation of an offer to buy, or an offer to sell securities nor should the information be relied upon as investment advice. Past performance is no guarantee of future results.
This communication is for information purposes. The information contained herein is not, and should not be construed as, investment, tax or legal advice to any party. Particular investments and/or trading strategies should be evaluated relative to the individual’s investment objectives and professional advice should be obtained with respect to any circumstance.
Index returns do not reflect transactions costs or the deduction of other fees and expenses and it is not possible to invest directly in an Index. Past performance is not indicative of future results.
You cannot invest directly in an index.
Commissions, management fees and expenses all may be associated with investments in exchange-traded funds. Please read the ETF Facts or prospectus of the BMO ETFs before investing. The indicated rates of return are the historical annual compounded total returns including changes in unit value and reinvestment of all dividends or distributions and do not take into account sales, redemption, distribution or optional charges or income taxes payable by any unitholder that would have reduced returns. Exchange-traded funds are not guaranteed, their values change frequently and past performance may not be repeated.
For a summary of the risks of an investment in the BMO ETFs, please see the specific risks set out in the BMO ETF’s prospectus. BMO ETFs trade like stocks, fluctuate in market value and may trade at a discount to their net asset value, which may increase the risk of loss. Distributions are not guaranteed and are subject to change and/or elimination.
Distribution yields are calculated by using the most recent regular distribution, or expected distribution, (which may be based on income, dividends, return of capital, and option premiums, as applicable) and excluding additional year end distributions, and special reinvested distributions annualized for frequency, divided by current net asset value (NAV). The yield calculation does not include reinvested distributions. Distributions are not guaranteed, may fluctuate and are subject to change and/or elimination. Distribution rates may change without notice (up or down) depending on market conditions and NAV fluctuations. The payment of distributions should not be confused with the BMO ETF’s performance, rate of return or yield. If distributions paid by a BMO ETF are greater than the performance of the investment fund, your original investment will shrink. Distributions paid as a result of capital gains realized by a BMO ETF, and income and dividends earned by a BMO ETF, are taxable in your hands in the year they are paid. Your adjusted cost base will be reduced by the amount of any returns of capital. If your adjusted cost base goes below zero, you will have to pay capital gains tax on the amount below zero.
Cash distributions, if any, on units of a BMO ETF (other than accumulating units or units subject to a distribution reinvestment plan) are expected to be paid primarily out of dividends or distributions, and other income or gains, received by the BMO ETF less the expenses of the BMO ETF, but may also consist of non-taxable amounts including returns of capital, which may be paid in the manager’s sole discretion. To the extent that the expenses of a BMO ETF exceed the income generated by such BMO ETF in any given month, quarter, or year, as the case may be, it is not expected that a monthly, quarterly, or annual distribution will be paid. Distributions, if any, in respect of the accumulating units of BMO Short Corporate Bond Index ETF, BMO Short Federal Bond Index ETF, BMO Short Provincial Bond Index ETF, BMO Ultra Short-Term Bond ETF and BMO Ultra Short-Term US Bond ETF will be automatically reinvested in additional accumulating units of the applicable BMO ETF. Following each distribution, the number of accumulating units of the applicable BMO ETF will be immediately consolidated so that the number of outstanding accumulating units of the applicable BMO ETF will be the same as the number of outstanding accumulating units before the distribution. Non-resident unitholders may have the number of securities reduced due to withholding tax. Certain BMO ETFs have adopted a distribution reinvestment plan, which provides that a unitholder may elect to automatically reinvest all cash distributions paid on units held by that unitholder in additional units of the applicable BMO ETF in accordance with the terms of the distribution reinvestment plan. For further information, see the distribution policy in the BMO ETFs’ prospectus.
BMO ETFs are managed by BMO Asset Management Inc., an investment fund manager, a portfolio manager, and a separate legal entity from Bank of Montreal.
“BMO (M-bar roundel symbol)” is a registered trademark of Bank of Montreal, used under licence.