BMO ETFs Fixed Income Model Strategy Report (Q2 2026)
All prices, returns and portfolio weights are as of market close on March 31, 2026, unless otherwise indicated.


Leaning into the Canadian Curve
- The fixed income backdrop remains uneven across North America as we see a more supportive setup for Canada as opposed to the U.S. – especially in the front-end of the curve.
- In our view, the Bank of Canada is likely to remain on pause for the next several meetings. That is largely because the impact of the energy price could exacerbate the degree of economic slack in the Canadian economy – offsetting any rise in incomes from the energy sector.
- And as the CAD swaps market has moved to price in rate hikes for the BoC this year, the front-end of the cash curve looks relatively cheap. This creates a tactical opportunity to add exposure in short‑and mid‑term Canadian duration. To capitalize on that view, we are initiating a long position in ZFS (BMO Short Federal Bond Index ETF) at 10%.
- Further out the curve, we remain mindful that term premium risk has not disappeared. Long‑end supply dynamics and global spillovers can still reprice duration quickly, which keeps us biased toward parts of the curve where carry is steadier and the policy signal is clearer.
- Another notable change is that we are exiting ZUAG.F (BMO US Aggregate Bond Index ETF – Hedged Units). With our current view that the U.S. dollar (USD) may hold up better in the months ahead, we prefer not to maintain a structure that would mute potential currency upside.
- We are also upgrading ZBI (BMO Canadian Bank Income Index ETF) to 25% to strengthen the income profile while staying in a familiar domestic credit complex.
Table 1 – Fixed Income Portfolio for Q2 2026
| ETF Name | Ticker | Weight (%) | Duration | Yield-to-Maturity | Management Fee | Exposure | Position |
| BMO Discount Bond Index ETF | ZDB | 15.0% | 6.81 | 3.66% | 0.09% | Canada | Core |
| BMO Laddered Preferred Share Index ETF | ZPR | 20.0% | 3.17 | 5.70% | 0.45% | Canada | Core |
| BMO Canadian Bank Income Index ETF | ZBI | 25.0% | 2.00 | 4.04% | 0.25% | Canada | Core |
| BMO Floating Rate High Yield ETF | ZFH | 10.0% | 0.26 | 6.07% | 0.40% | United States | Tactical |
| BMO Short Federal Bond Index ETF | ZFS | 10.0% | 2.81 | 3.12% | 0.08% | Canada | Tactical |
| BMO AAA CLO ETF (Hedged Units) | ZAAA.F | 20.0% | 0.13 | 0.20% | United States | Tactical | |
| Total Portfolio | 100.00% | 2.49 | 3.62% | 0.25% |
Source: BMO Global Asset Management, as of March 31, 2026. The portfolio holdings are subject to change without notice and only represent a percentage of portfolio holdings. They are not recommendations to buy or sell any particular security.
Table 2 – Changes from Q1 2026
Sell/Trim |
Ticker |
Old Weight |
(%) |
New Weight |
15% |
-15% |
0% |
||
| Buy/Add | ||||
| BMO Canadian Bank Income Index ETF | 20% | 5% | 25% | |
| BMO Short Federal Bond Index ETF | 0% | 10% | 10% |
Source: BMO Global Asset Management, as of March 31, 2026. The portfolio holdings are subject to change without notice and only represent a percentage of portfolio holdings. They are not recommendations to buy or sell any particular security.
Table 3 – Performance of Holdings
Fund name |
Ticker |
Year-to-Date |
1-Month |
6-Month |
1-Year |
5-Year |
10-Year |
Since |
Inception |
2.09% |
1.26% |
8.02% |
17.76% |
8.89% |
9.26% |
3.69% |
2012-11-14 |
||
2.14% |
1.61% |
3.52% |
2.10% |
0.61% |
1.89% |
2.42% |
2014-02-10 |
||
1.16% |
0.80% |
2.06% |
2.94% |
1.56% |
1.40% |
1.73% |
2009-10-20 |
||
— |
— |
— |
— |
— |
— |
— |
2025-04-30 |
||
-0.54% |
-0.97% |
2.27% |
5.33% |
7.03% |
6.01% |
5.27% |
2014-02-10 |
||
1.20% |
0.43% |
3.16% |
5.41% |
— |
— |
4.32% |
2022-02-07 |
BMO Global Asset Management. As of March 31, 2026.
Chart 1 - Credit Summary
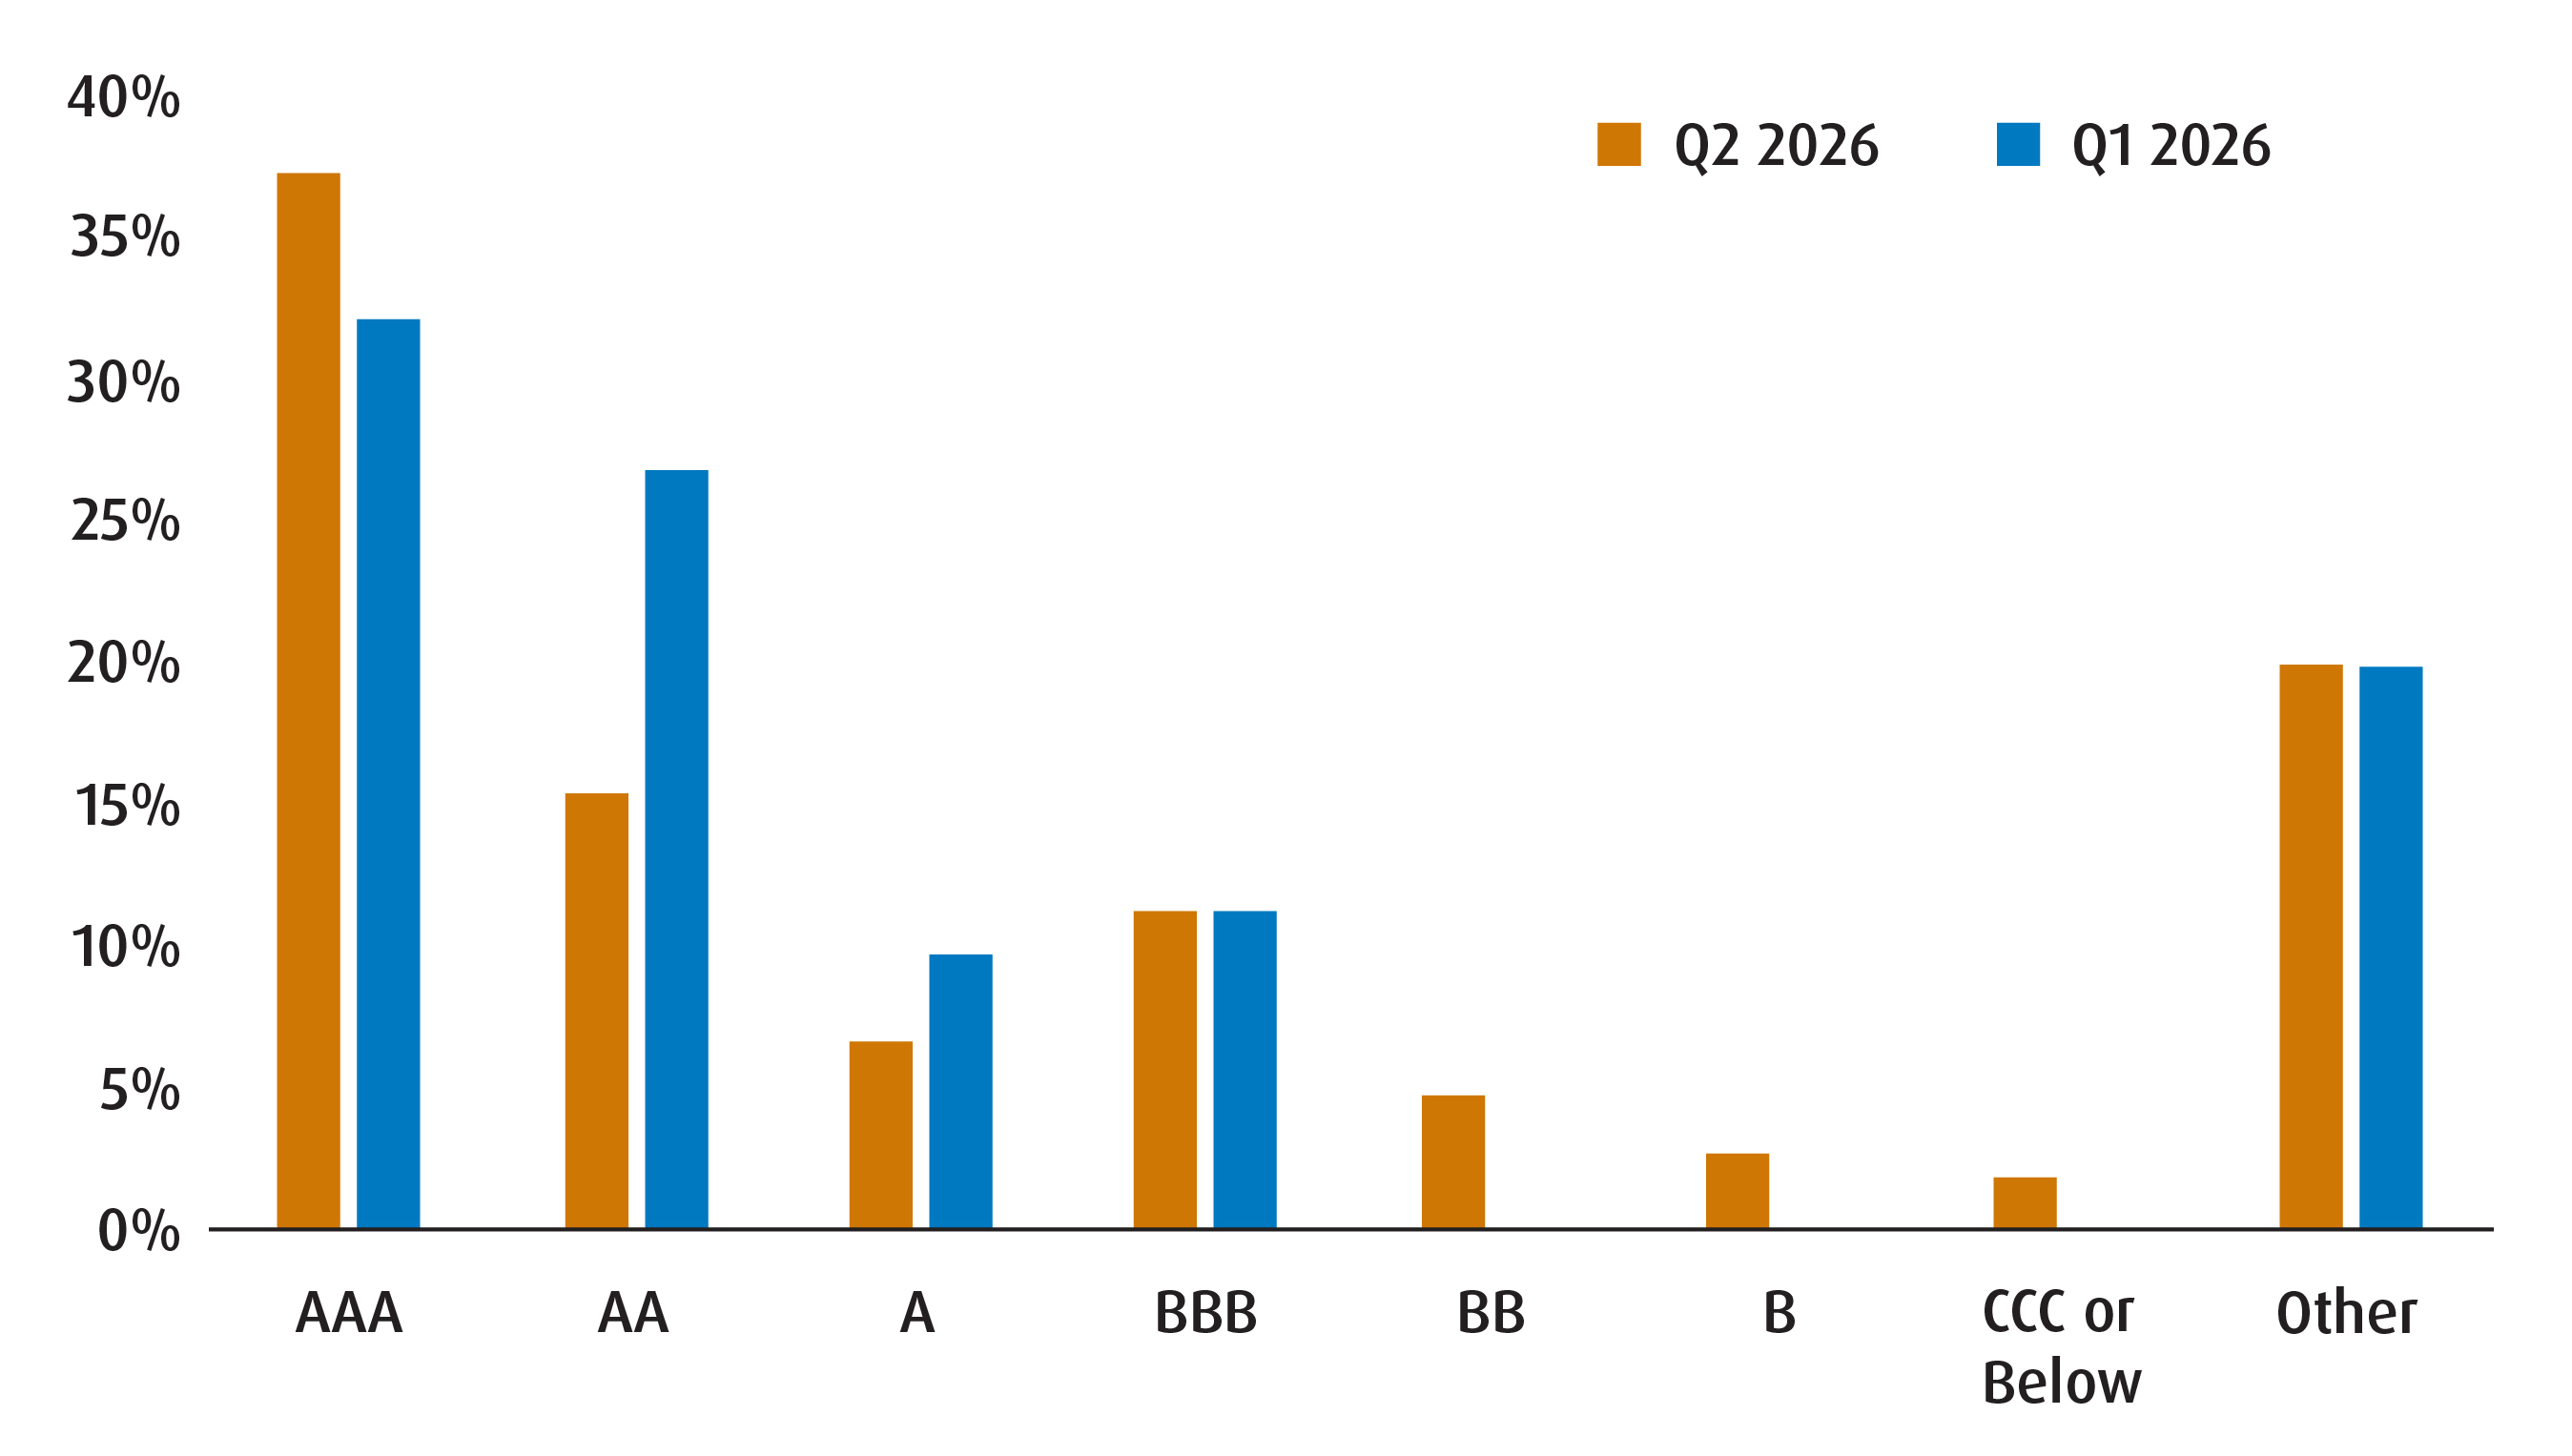
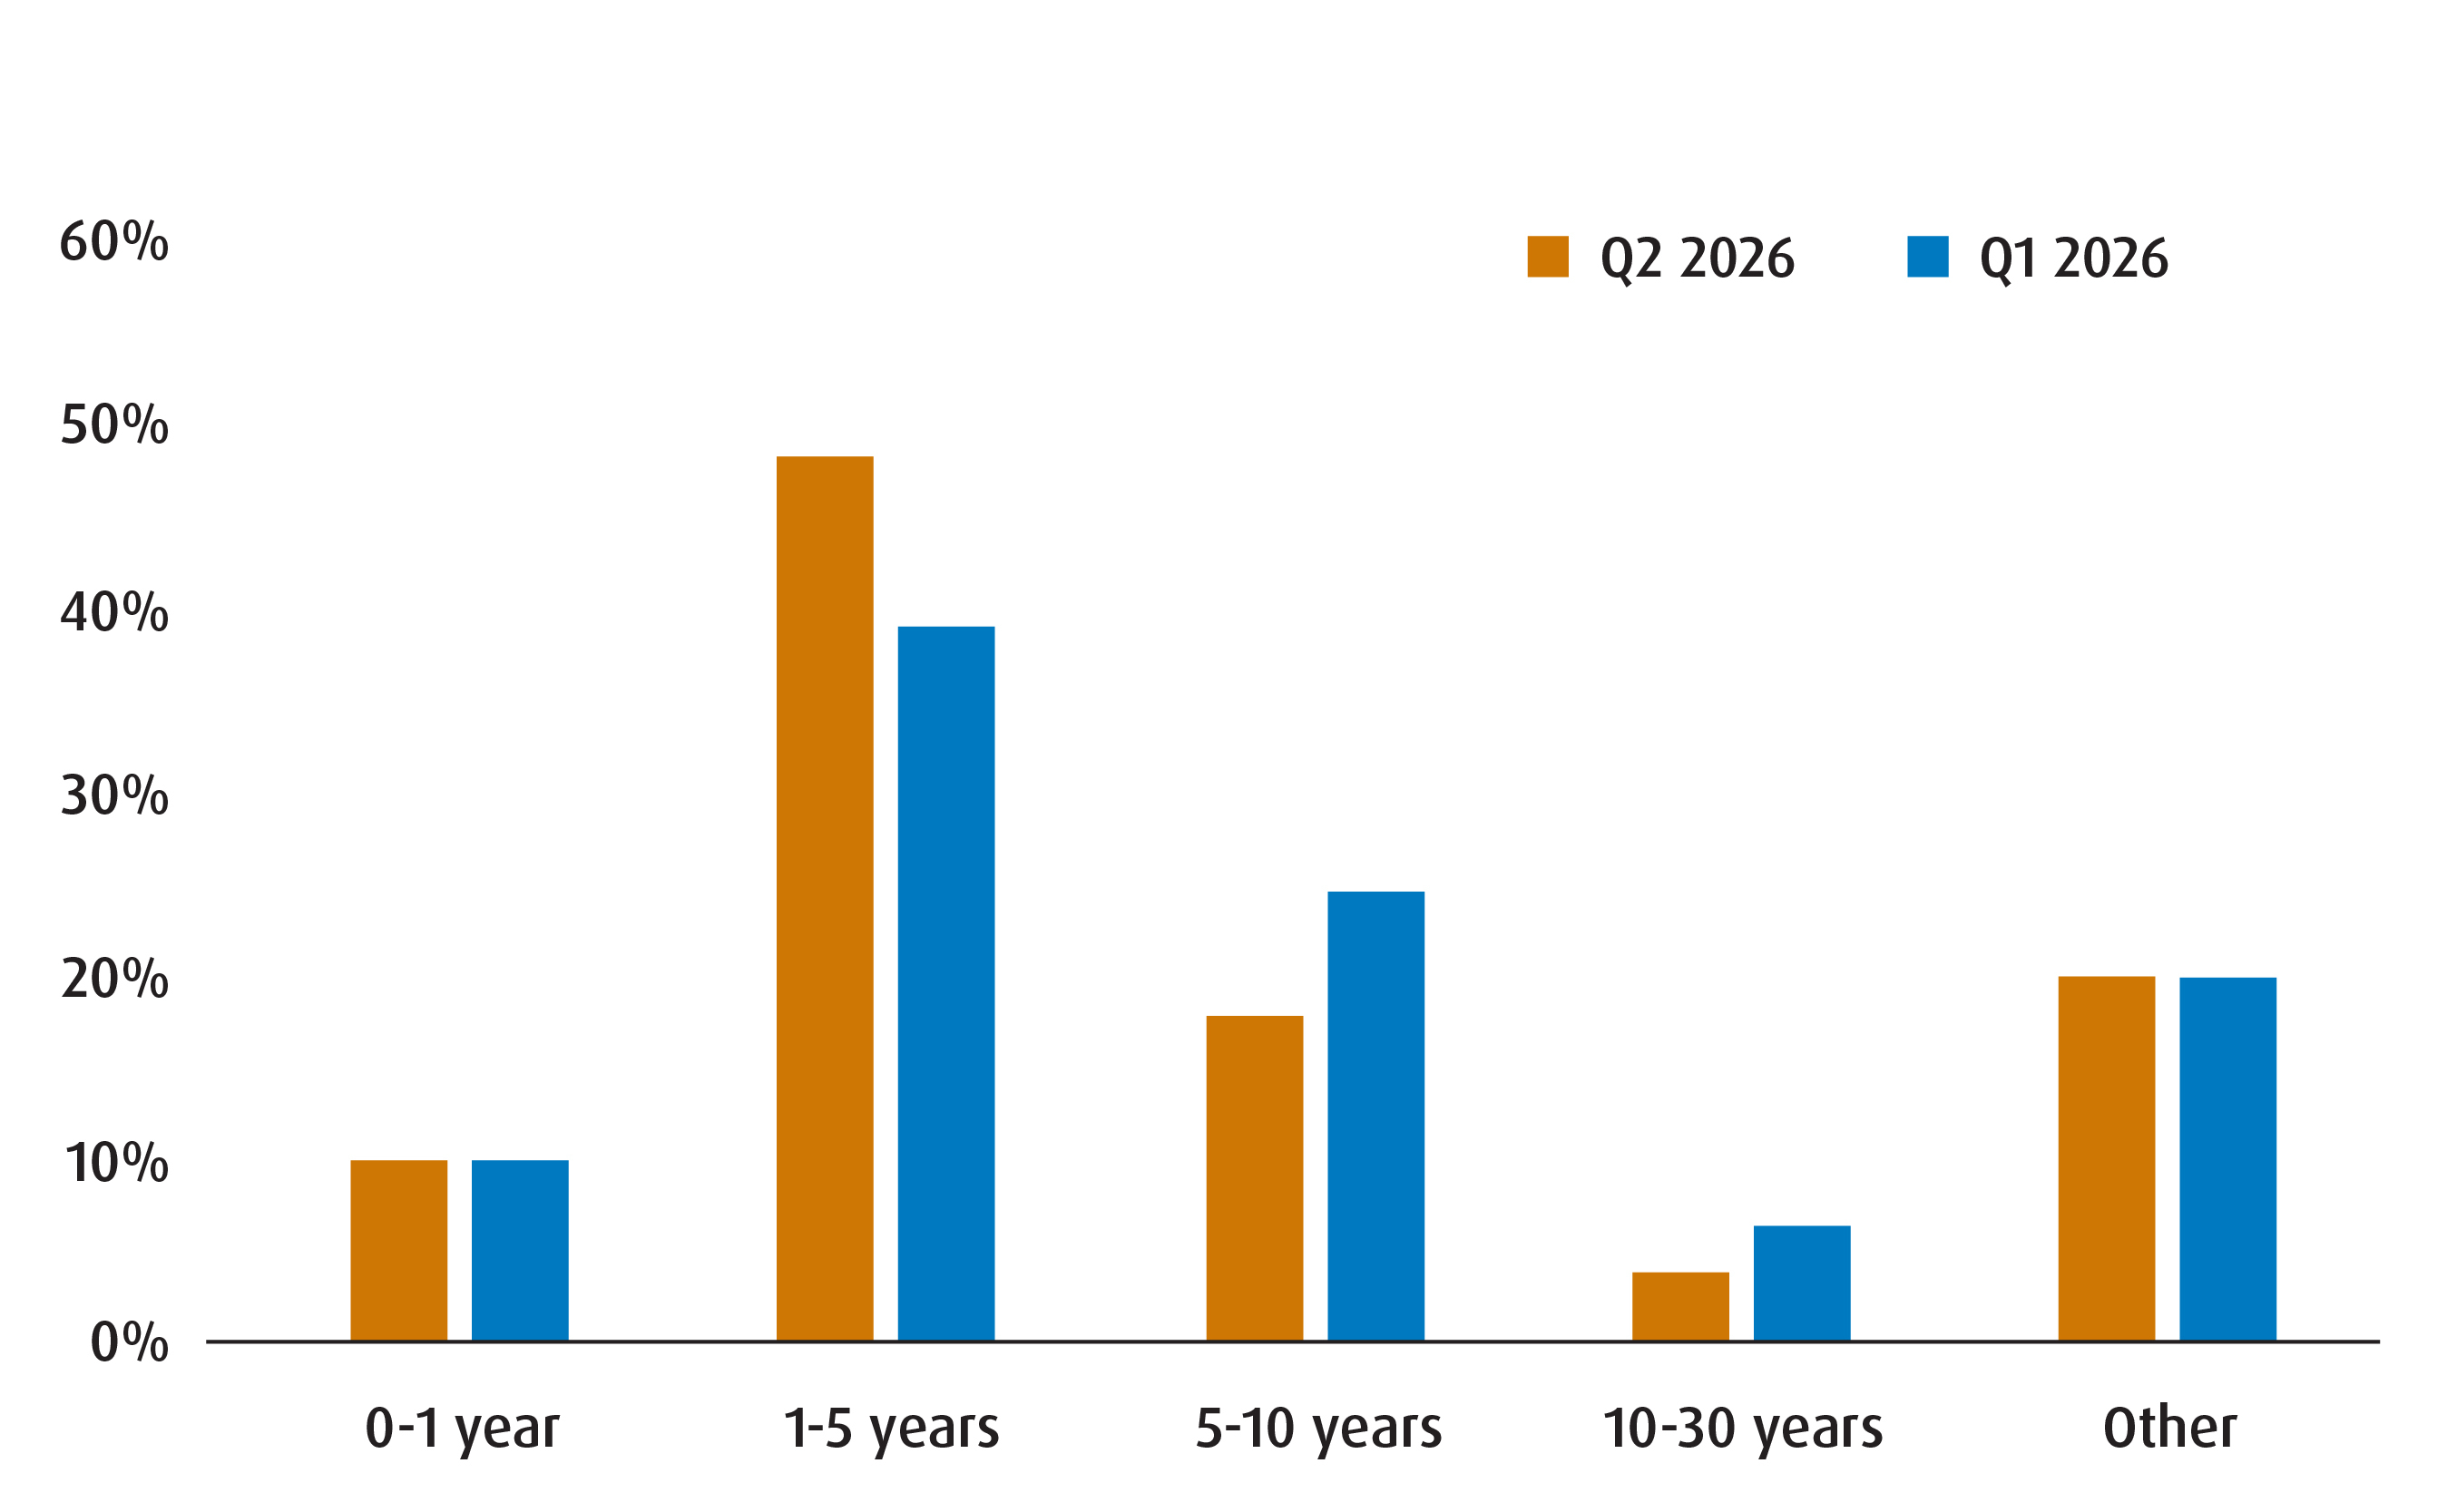
Chart 2 - Term Summary
Disclaimers
For Advisor Use Only.
The portfolio holdings and asset allocations are subject to change without notice and individual holdings only represent a small percentage of portfolio holdings. They are not recommendations to buy or sell any particular security.
Any statement that necessarily depends on future events may be a forward-looking statement. Forward-looking statements are not guarantees of performance. They involve risks, uncertainties and assumptions. Although such statements are based on assumptions that are believed to be reasonable, there can be no assurance that actual results will not differ materially from expectations. Investors are cautioned not to rely unduly on any forward-looking statements. In connection with any forward-looking statements, investors should carefully consider the areas of risk described in the most recent prospectus.
The viewpoints expressed by the author represents their assessment of the markets at the time of publication. Those views are subject to change without notice at any time. The information provided herein does not constitute a solicitation of an offer to buy, or an offer to sell securities nor should the information be relied upon as investment advice. Past performance is no guarantee of future results.
This communication is for information purposes. The information contained herein is not, and should not be construed as, investment, tax or legal advice to any party. Particular investments and/or trading strategies should be evaluated relative to the individual’s investment objectives and professional advice should be obtained with respect to any circumstance.
Index returns do not reflect transactions costs or the deduction of other fees and expenses and it is not possible to invest directly in an Index. Past performance is not indicative of future results.
The ETFs referred to herein are not sponsored, endorsed, or promoted by MSCI and MSCI bear no liability with respect to an ETF or any index on which such ETF is based. The ETF’s prospectus contains a more detailed description of the limited relationship that MSCI has with the Manager and any related ETF.
The Index is a product of S&P Dow Jones Indices LLC or its affiliates (“SPDJI”), and has been licensed for use by the Manager. S&P®, S&P 500®, US 500, The 500, iBoxx®, iTraxx® and CDX® are trademarks of S&P Global, Inc. or its affiliates (“S&P”) and Dow Jones® is a registered trademark of Dow Jones Trademark Holdings LLC (“Dow Jones”), and these trademarks have been licensed for use by SPDJI and sublicensed for certain purposes by the Manager. The ETF is not sponsored, endorsed, sold or promoted by SPDJI, Dow Jones, S&P, their respective affiliates, and none of such parties make any representation regarding the advisability of investing in such product(s) nor do they have any liability for any errors, omissions, or interruptions of the Index.
You cannot invest directly in an index.
Commissions, management fees and expenses all may be associated with investments in exchange-traded funds. Please read the ETF Facts or prospectus of the BMO ETFs before investing. The indicated rates of return are the historical annual compounded total returns including changes in unit value and reinvestment of all dividends or distributions and do not take into account sales, redemption, distribution or optional charges or income taxes payable by any unitholder that would have reduced returns. Exchange-traded funds are not guaranteed, their values change frequently and past performance may not be repeated.
For a summary of the risks of an investment in the BMO ETFs, please see the specific risks set out in the BMO ETF’s prospectus. BMO ETFs trade like stocks, fluctuate in market value and may trade at a discount to their net asset value, which may increase the risk of loss. Distributions are not guaranteed and are subject to change and/or elimination.
Distribution yields are calculated by using the most recent regular distribution, or expected distribution, (which may be based on income, dividends, return of capital, and option premiums, as applicable) and excluding additional year end distributions, and special reinvested distributions annualized for frequency, divided by current net asset value (NAV). The yield calculation does not include reinvested distributions. Distributions are not guaranteed, may fluctuate and are subject to change and/or elimination. Distribution rates may change without notice (up or down) depending on market conditions and NAV fluctuations. The payment of distributions should not be confused with the BMO ETF’s performance, rate of return or yield. If distributions paid by a BMO ETF are greater than the performance of the investment fund, your original investment will shrink. Distributions paid as a result of capital gains realized by a BMO ETF, and income and dividends earned by a BMO ETF, are taxable in your hands in the year they are paid. Your adjusted cost base will be reduced by the amount of any returns of capital. If your adjusted cost base goes below zero, you will have to pay capital gains tax on the amount below zero.
Cash distributions, if any, on units of a BMO ETF (other than accumulating units or units subject to a distribution reinvestment plan) are expected to be paid primarily out of dividends or distributions, and other income or gains, received by the BMO ETF less the expenses of the BMO ETF, but may also consist of non-taxable amounts including returns of capital, which may be paid in the manager’s sole discretion. To the extent that the expenses of a BMO ETF exceed the income generated by such BMO ETF in any given month, quarter, or year, as the case may be, it is not expected that a monthly, quarterly, or annual distribution will be paid. Distributions, if any, in respect of the accumulating units of BMO Short Corporate Bond Index ETF, BMO Short Federal Bond Index ETF, BMO Short Provincial Bond Index ETF, BMO Ultra Short-Term Bond ETF and BMO Ultra Short-Term US Bond ETF will be automatically reinvested in additional accumulating units of the applicable BMO ETF. Following each distribution, the number of accumulating units of the applicable BMO ETF will be immediately consolidated so that the number of outstanding accumulating units of the applicable BMO ETF will be the same as the number of outstanding accumulating units before the distribution. Non-resident unitholders may have the number of securities reduced due to withholding tax. Certain BMO ETFs have adopted a distribution reinvestment plan, which provides that a unitholder may elect to automatically reinvest all cash distributions paid on units held by that unitholder in additional units of the applicable BMO ETF in accordance with the terms of the distribution reinvestment plan. For further information, see the distribution policy in the BMO ETFs’ prospectus.
BMO ETFs are managed by BMO Asset Management Inc., an investment fund manager, a portfolio manager, and a separate legal entity from Bank of Montreal.
BMO Global Asset Management is a brand name under which BMO Asset Management Inc. and BMO Investments Inc. operate.
“BMO (M-bar roundel symbol)” is a registered trademark of Bank of Montreal, used under licence.