Following the money market


Takeaways
- Now that the Fed is easing again, the question is what will happen to the massive amount of assets that are held in money market accounts.
- Yield sensitive investors may seek to move into dividend-oriented equity strategies or products, but that also equates to a move up the risk spectrum.
- There is a case to be made that some flow might end up in the front-end (2y-to-5y) of the UST curve,1 but we suspect that part of the curve is still vulnerable going forward.
- For now, we expect those flows to remain ‘sticky’ – which favours outperformance of the ultra-short end of the curve. We are adding the BMO USD Cash Management ETF (Ticker: ZUCM) to our tactical portfolio.
As of September 17th, the Investment Company Institute (or ICI) estimates that there is US$7.28trln parked in American money market funds. That is twice the number that were held in such funds at the end of 2019 (US$3.6trln).
The “doubling” in flow is the result of two primary drivers. First, it is likely that a decent portion of the Covid stimulus checks that went out to U.S. households found their way into savings and investment accounts that held short-term, liquid assets – including money market shares. Second (and more importantly), the Federal Reserve (Fed) ended up raising short-term policy rates to their highest level in a generation. That meant that the liquidity and capital preservation appeal of money market funds was also augmented by higher yields. Those yields were above 5% for much of 2023 and 2024 – two of the highest years on record for inward flows.
But with the Federal Open Market Committee (FOMC) re-starting its easing cycle, markets are now pricing in a terminal rate that is just below 3.00% in the next year. If the market is right, that will also mean lower yields for the ultra-short end and that money market funds will be reinvesting proceeds at lower rates. In theory, that should imply that yield-sensitive investors will look elsewhere and that inflows into money market funds may slow from here.
Where that marginal dollar will flow is the key. We understand there may be temptation to assume that dividend-focused equities should benefit but that also means a shift up in the risk spectrum for a lot of conservative investors. There is also a potential case to be made for a shift of that flow into the front-end of the US curve (2y-to-5y) which would mean an increase in duration risk for investors. However, there are two problems that we have with that view:
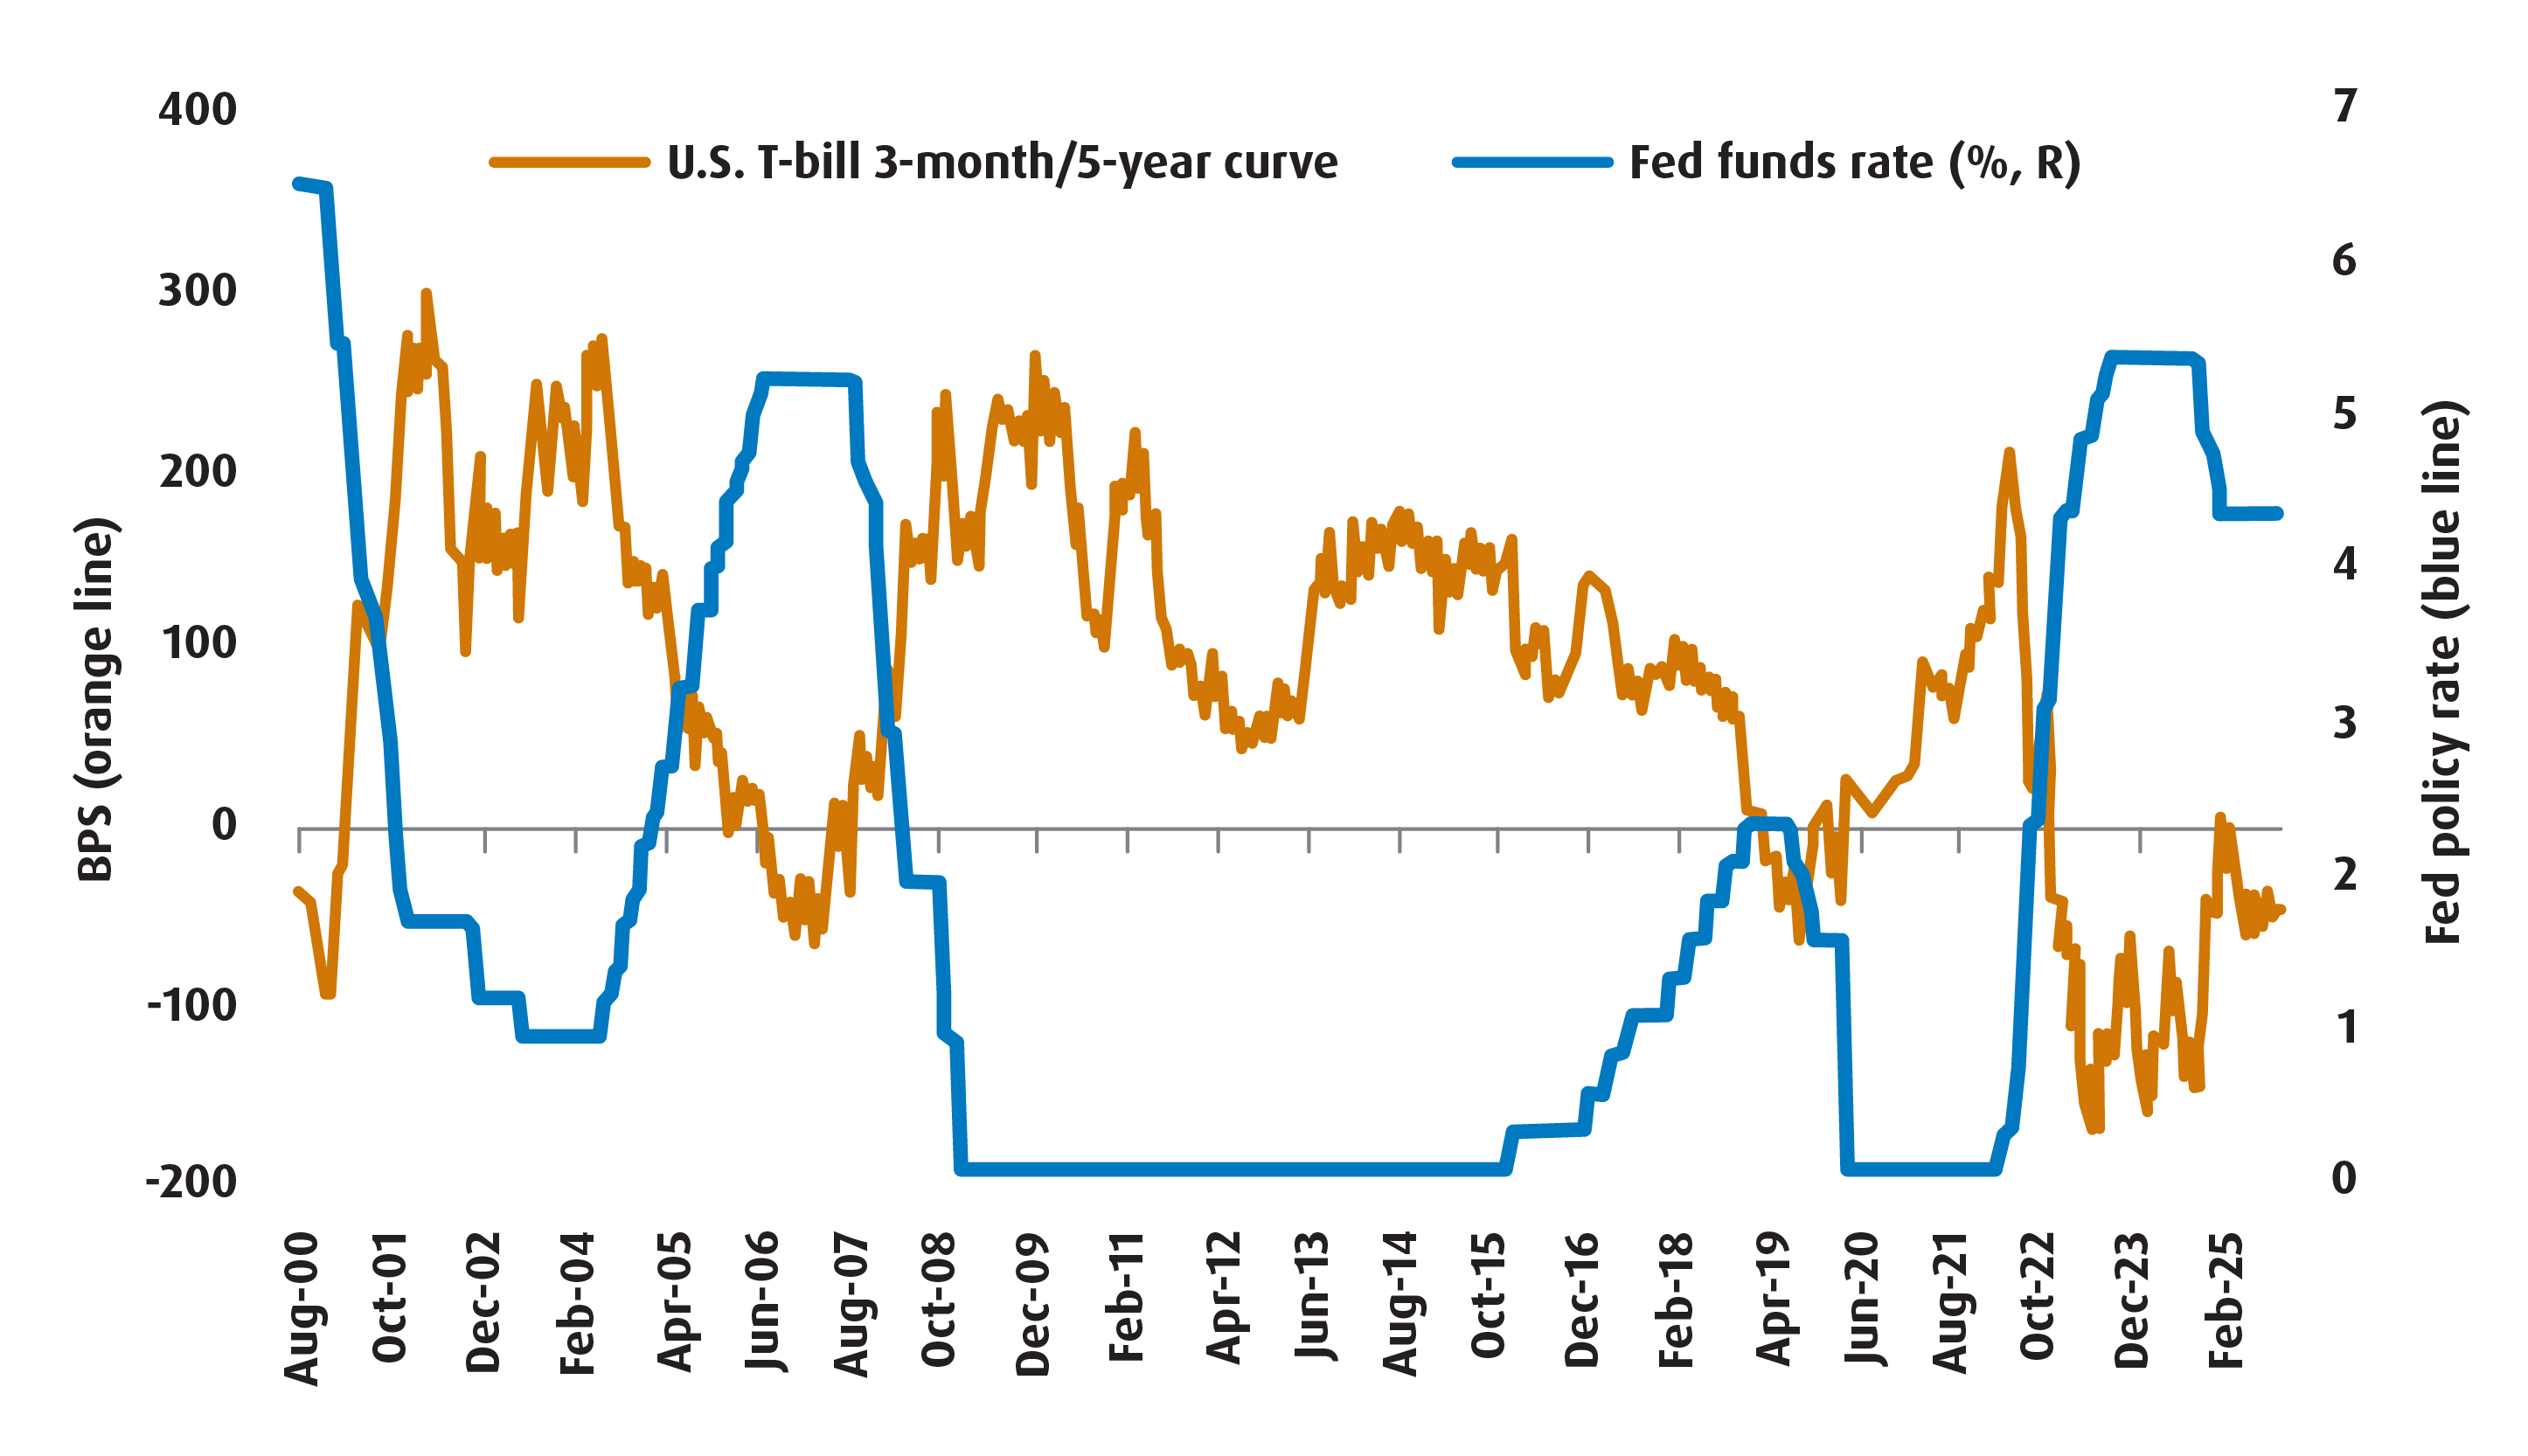
- First, the 3m /5y part of the UST curve is still inverted.2 Generally, this part of the curve should steepen as the Fed eases rates further from here (Chart 2) – which means that T-bill yields drop by more and funds that track those should outperform relative to those that track the 2y-5y part of the UST curve.
- Second, as mentioned above, the market is already pricing the Fed to reach its terminal rate by the end of next year. That tilts the risk towards higher coupon yields from here given the still strong U.S. fundamental backdrop.
Chart 1 – Total U.S. Money Market Assets and the Fed Funds Rate
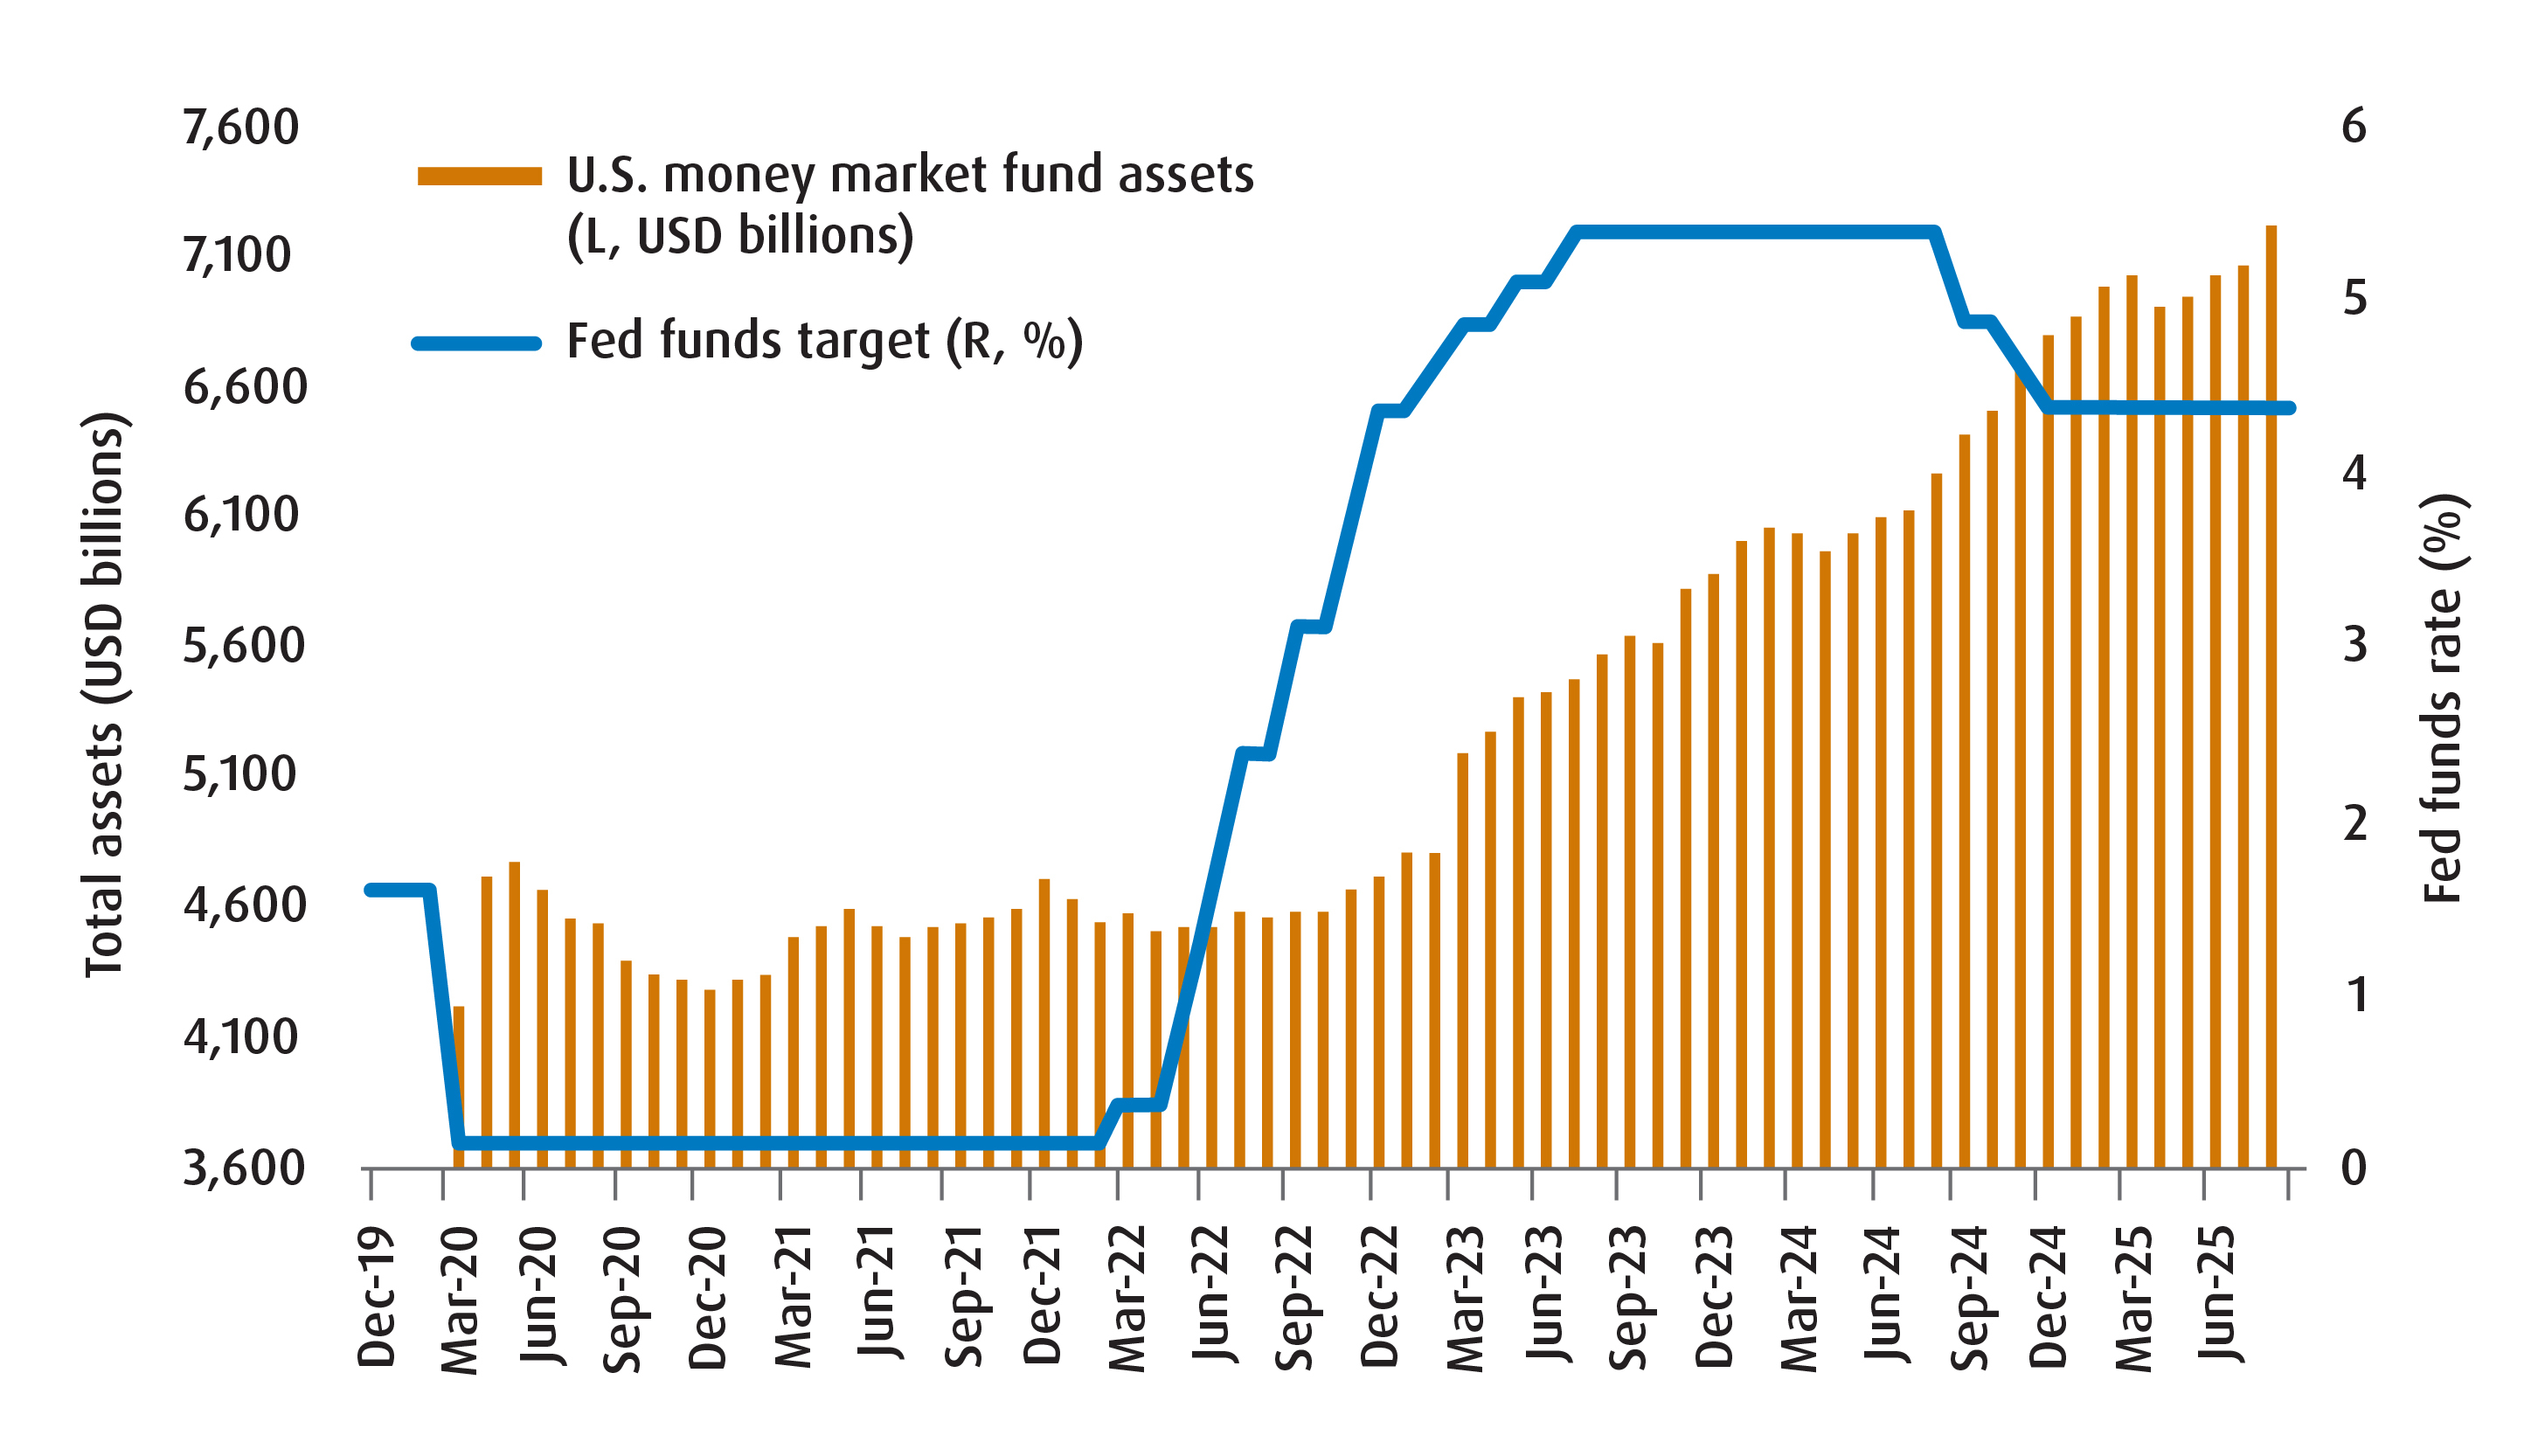
Chart 2 – The U.S. 3-month/5-year curve will usually steepen when the Fed eases
Both of those points tell us that the 2y-5y part of the curve is still more vulnerable to the fundamentals relative to T-bills.
As such, we don’t see a compelling case to be made for flows to migrate from money market funds to that part of the curve just yet. This could change if incoming U.S. data tells us that the situation in the labour sector is worse than originally thought and that markets have to reprice the Fed funds terminal rate lower. But we don’t think we’re there at this point.
Which leads us back to our question – where will that money flow if not towards money market assets? Unfortunately, there isn’t a clear answer to that just yet. Instead, it may still make sense for money market flows to remain sticky until there is a clearer sense of whether the markets need to reprice U.S. fundamentals.
Until then, we see a more compelling case for funds that track ultra-shorts to outperform. And to be sure, we’ve added an allocation to ZUCM to our tactical portfolio for that reason.
1 The UST Curve, or U.S. Treasury Yield Curve, shows yields and the maturity dates of U.S. Treasury securities.
2 The US 3m/5y curve is a spread between the US 3m T-bill and the US 5y yield.
Performance (%)
Ticker |
Year-to-date |
1-month |
3-month |
6-month |
1-year |
3-year |
5-year |
10-year |
Since inception |
Inception date |
-1.77 |
-0.52 |
1.14 |
-3.08 |
6.40 |
- |
- |
- |
5.81 |
09/27/2023 |
Source: Bloomberg, as of August 31, 2025.
Disclaimers:
For Advisor use.
The communication is for information purposes. The information contained herein is not, and should not be construed as, investment, tax or legal advice to any party. Particular investments and/or trading strategies should be evaluated relative to the individual’s investment objectives and professional advice should be obtained with respect to any circumstance.
The viewpoints expressed by the author represents their assessment of the markets at the time of publication. Those views are subject to change without notice at any time. The information provided herein does not constitute a solicitation of an offer to buy, or an offer to sell securities nor should the information be relied upon as investment advice. Past performance is no guarantee of future results. This communication is intended for informational purposes only.
The portfolio holdings are subject to change without notice and only represent a small percentage of portfolio holdings. They are not recommendations to buy or sell any particular security.
The ETF referred to herein is not sponsored, endorsed, or promoted by MSCI and MSCI bears no liability with respect to the ETF or any index on which such ETF is based. The ETF’s prospectus contains a more detailed description of the limited relationship MSCI has with the Manager and any related ETF.
Any statement that necessarily depends on future events may be a forward-looking statement. Forward-looking statements are not guarantees of performance. They involve risks, uncertainties and assumptions. Although such statements are based on assumptions that are believed to be reasonable, there can be no assurance that actual results will not differ materially from expectations. Investors are cautioned not to rely unduly on any forward-looking statements. In connection with any forward-looking statements, investors should carefully consider the areas of risk described in the most recent prospectus.
Distribution yields are calculated by using the most recent regular distribution, or expected distribution, (which may be based on income, dividends, return of capital, and option premiums, as applicable) and excluding additional year end distributions, and special reinvested distributions annualized for frequency, divided by current net asset value (NAV). The yield calculation does not include reinvested distributions.
Distributions are not guaranteed, may fluctuate and are subject to change and/or elimination. Distribution rates may change without notice (up or down) depending on market conditions and NAV fluctuations.
The payment of distributions should not be confused with the BMO ETF’s performance, rate of return or yield. If distributions paid by a BMO ETF are greater than the performance of the investment fund, your original investment will shrink. Distributions paid as a result of capital gains realized by a BMO ETF, and income and dividends earned by a BMO ETF, are taxable in your hands in the year they are paid.
Your adjusted cost base will be reduced by the amount of any returns of capital. If your adjusted cost base goes below zero, you will have to pay capital gains tax on the amount below zero.
Cash distributions, if any, on units of a BMO ETF (other than accumulating units or units subject to a distribution reinvestment plan) are expected to be paid primarily out of dividends or distributions, and other income or gains, received by the BMO ETF less the expenses of the BMO ETF, but may also consist of non-taxable amounts including returns of capital, which may be paid in the manager’s sole discretion. To the extent that the expenses of a BMO ETF exceed the income generated by such BMO ETF in any given month, quarter, or year, as the case may be, it is not expected that a monthly, quarterly, or annual distribution will be paid. Distributions, if any, in respect of the accumulating units of BMO Short Corporate Bond Index ETF, BMO Short Federal Bond Index ETF, BMO Short Provincial Bond Index ETF, BMO Ultra Short-Term Bond ETF and BMO Ultra Short-Term US Bond ETF will be automatically reinvested in additional accumulating units of the applicable BMO ETF. Following each distribution, the number of accumulating units of the applicable BMO ETF will be immediately consolidated so that the number of outstanding accumulating units of the applicable BMO ETF will be the same as the number of outstanding accumulating units before the distribution. Non-resident unitholders may have the number of securities reduced due to withholding tax. Certain BMO ETFs have adopted a distribution reinvestment plan, which provides that a unitholder may elect to automatically reinvest all cash distributions paid on units held by that unitholder in additional units of the applicable BMO ETF in accordance with the terms of the distribution reinvestment plan. For further information, see the distribution policy in the BMO ETFs’ prospectus.
Past Performance is not indicative of future results.
Commissions, management fees and expenses all may be associated with investments in exchange traded funds. Please read the ETF Facts or prospectus of the BMO ETFs before investing. The indicated rates of return are the historical annual compounded total returns including changes in unit value and reinvestment of all dividends or distributions and do not take into account sales, redemption, distribution or optional charges or income taxes payable by any unitholder that would have reduced returns. Exchange traded funds are not guaranteed, their values change frequently and past performance may not be repeated.
For a summary of the risks of an investment in the BMO ETFs, please see the specific risks set out in the BMO ETF’s prospectus. BMO ETFs trade like stocks, fluctuate in market value and may trade at a discount to their net asset value, which may increase the risk of loss. Distributions are not guaranteed and are subject to change and/or elimination.
BMO ETFs are managed by BMO Asset Management Inc., which is an investment fund manager and a portfolio manager, and a separate legal entity from Bank of Montreal.
BMO Global Asset Management is a brand name under which BMO Asset Management Inc. and BMO Investments Inc. operate.
“BMO (M-bar roundel symbol)” is a registered trademark of Bank of Montreal, used under licence.