3 reasons why a broad commodities exposure can benefit client portfolios


There has been a lot of demand for the safe haven of gold in 2025, while global central banks as well as investors in general remain bullish. Yet the precious metal is part of a wider commodities complex that holds several benefits that can aid client portfolios.
Conversations with advisors and clients looking to diversify their commodity exposure beyond gold have led BMO ETFs to introduce the BMO Broad Commodity ETF or ZCOM.
Fund in focus
What is ZCOM?
- All-in-one, low-cost commodity exposure (management fee: 0.29%).
- Tracks or seeks to replicate, to the extent possible, the performance of the Bloomberg Commodity Index Total Return (BCOM TR), following 24 commodities: precious metals (23%), industrial metals (15%), agriculture (29%), energy (27%), & livestock (6%).
- Rebalances annually. Risk rating: Medium.1
*Bloomberg as of September 30, 2025.
Global central banks are still bullish gold, with survey data showing that they are still looking to increase their allocations over the next several years. This is a bullish signal which could see gold hit US$4,500 per ounce by mid-2026.
Clients may ask – why not just buy gold? A few reasons.
- Diversified commodity exposures have a low correlation3 to equities and reduce concentration risk. Gold can still correct while inflation remains high.
- Shortages in industrial metals, or surges in oil prices are common during periods of geopolitical risk, and benefit commodities.
- Agriculture tends to outperform during climate related events. For example, coffee prices have doubled over the last 2 years because of droughts and tariffs (geopolitical risk).
- Commodities may experience a price boom because of trade frictions and barriers that are leading to increases.
Adding commodities ETFs to a portfolio can help investors tap into new opportunities while strengthening diversification. As the table below shows, commodities have shown low to negative correlation with stocks and bonds.
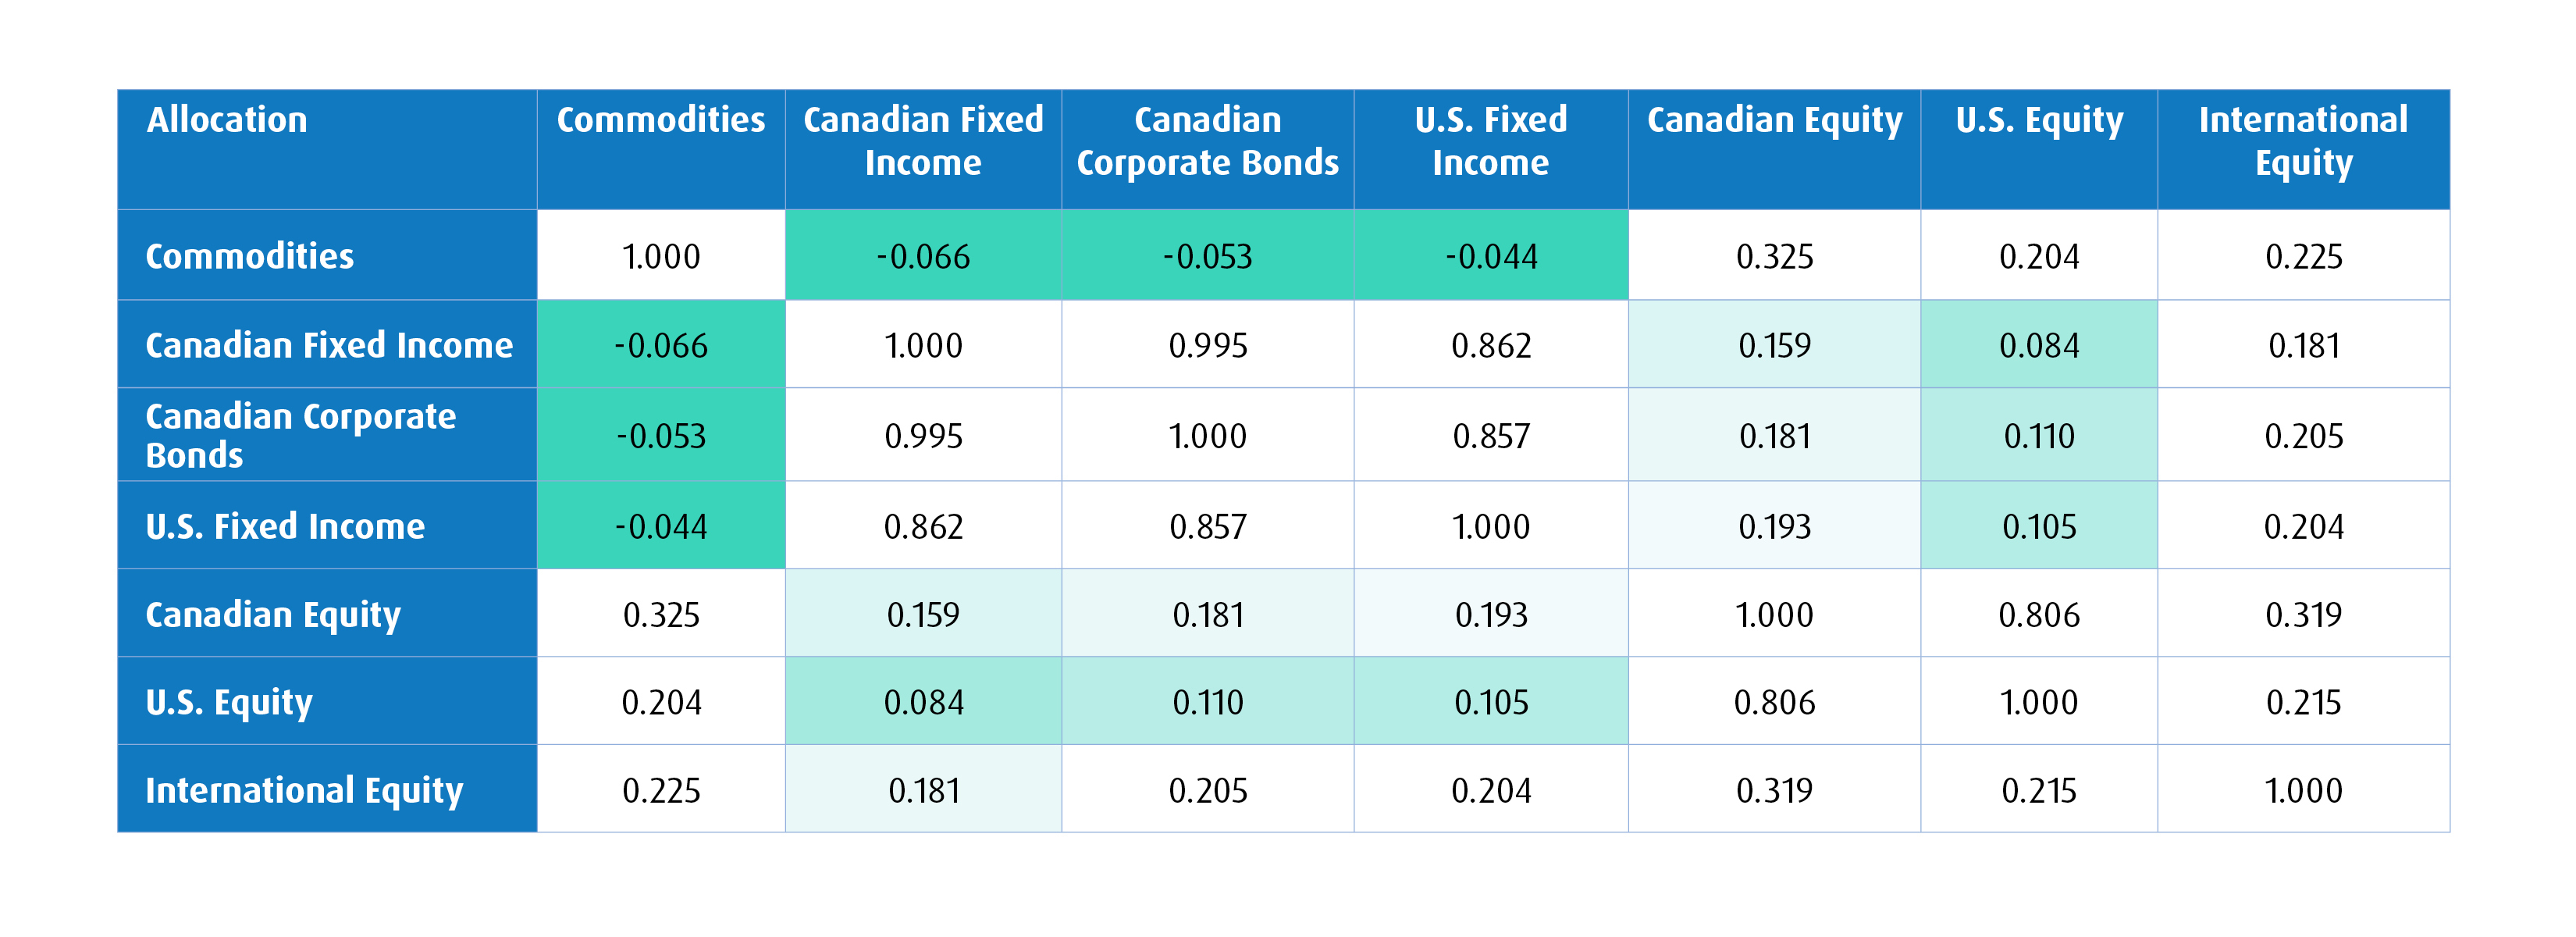
Correlation table: the darker the green represents how correlations differ. A number between -1 and +1 indicates how strong the relationship is. A value close to 1 or -1 indicates a strong relationship, while a value closer to 0 indicates a weak or nonexistent relationship.
Source: Bloomberg, as of September 30, 2025. Commodities = BCOM Total Return Index, Canadian Fixed Income = FTSE Canada Universe Bond Index, Canadian Corporate Bonds = FTSE Canada All Corporate Bond Index, U.S. Fixed Income = Bloomberg Barclays U.S. Aggregate Index, Canadian Equity = S&P/TSX Composite, U.S. Equity = S&P 500, International Equity = MSCI EAFE.
3 reasons commodities benefit portfolio construction
From a portfolio construction perspective, we’ve identified three key reasons an exposure to ZCOM can benefit your client:
- Commodities are an excellent diversifier. BCOM TR has low to negative correlations with stocks and bonds. Consider 2022, when both equities and bonds were firmly in the negative. The BCOM index was +16.09% in that year. Correlations between stocks and bonds tend to be higher during inflationary periods, and expectations remain elevated for persistently stickier inflation.
- Commodities are an excellent inflation hedge for portfolios. U.S. consumer price index (CPI4) data going back to 1977 show that in months where CPI has increased more than 25 basis points, commodities have delivered more than double the returns of stocks and bonds.
- Commodities help reduce standard deviation5 versus average model 60-40 portfolios (see chart below).
The case to shift away from 60/40: Stocks and bonds tend to correlate more when core inflation is higher
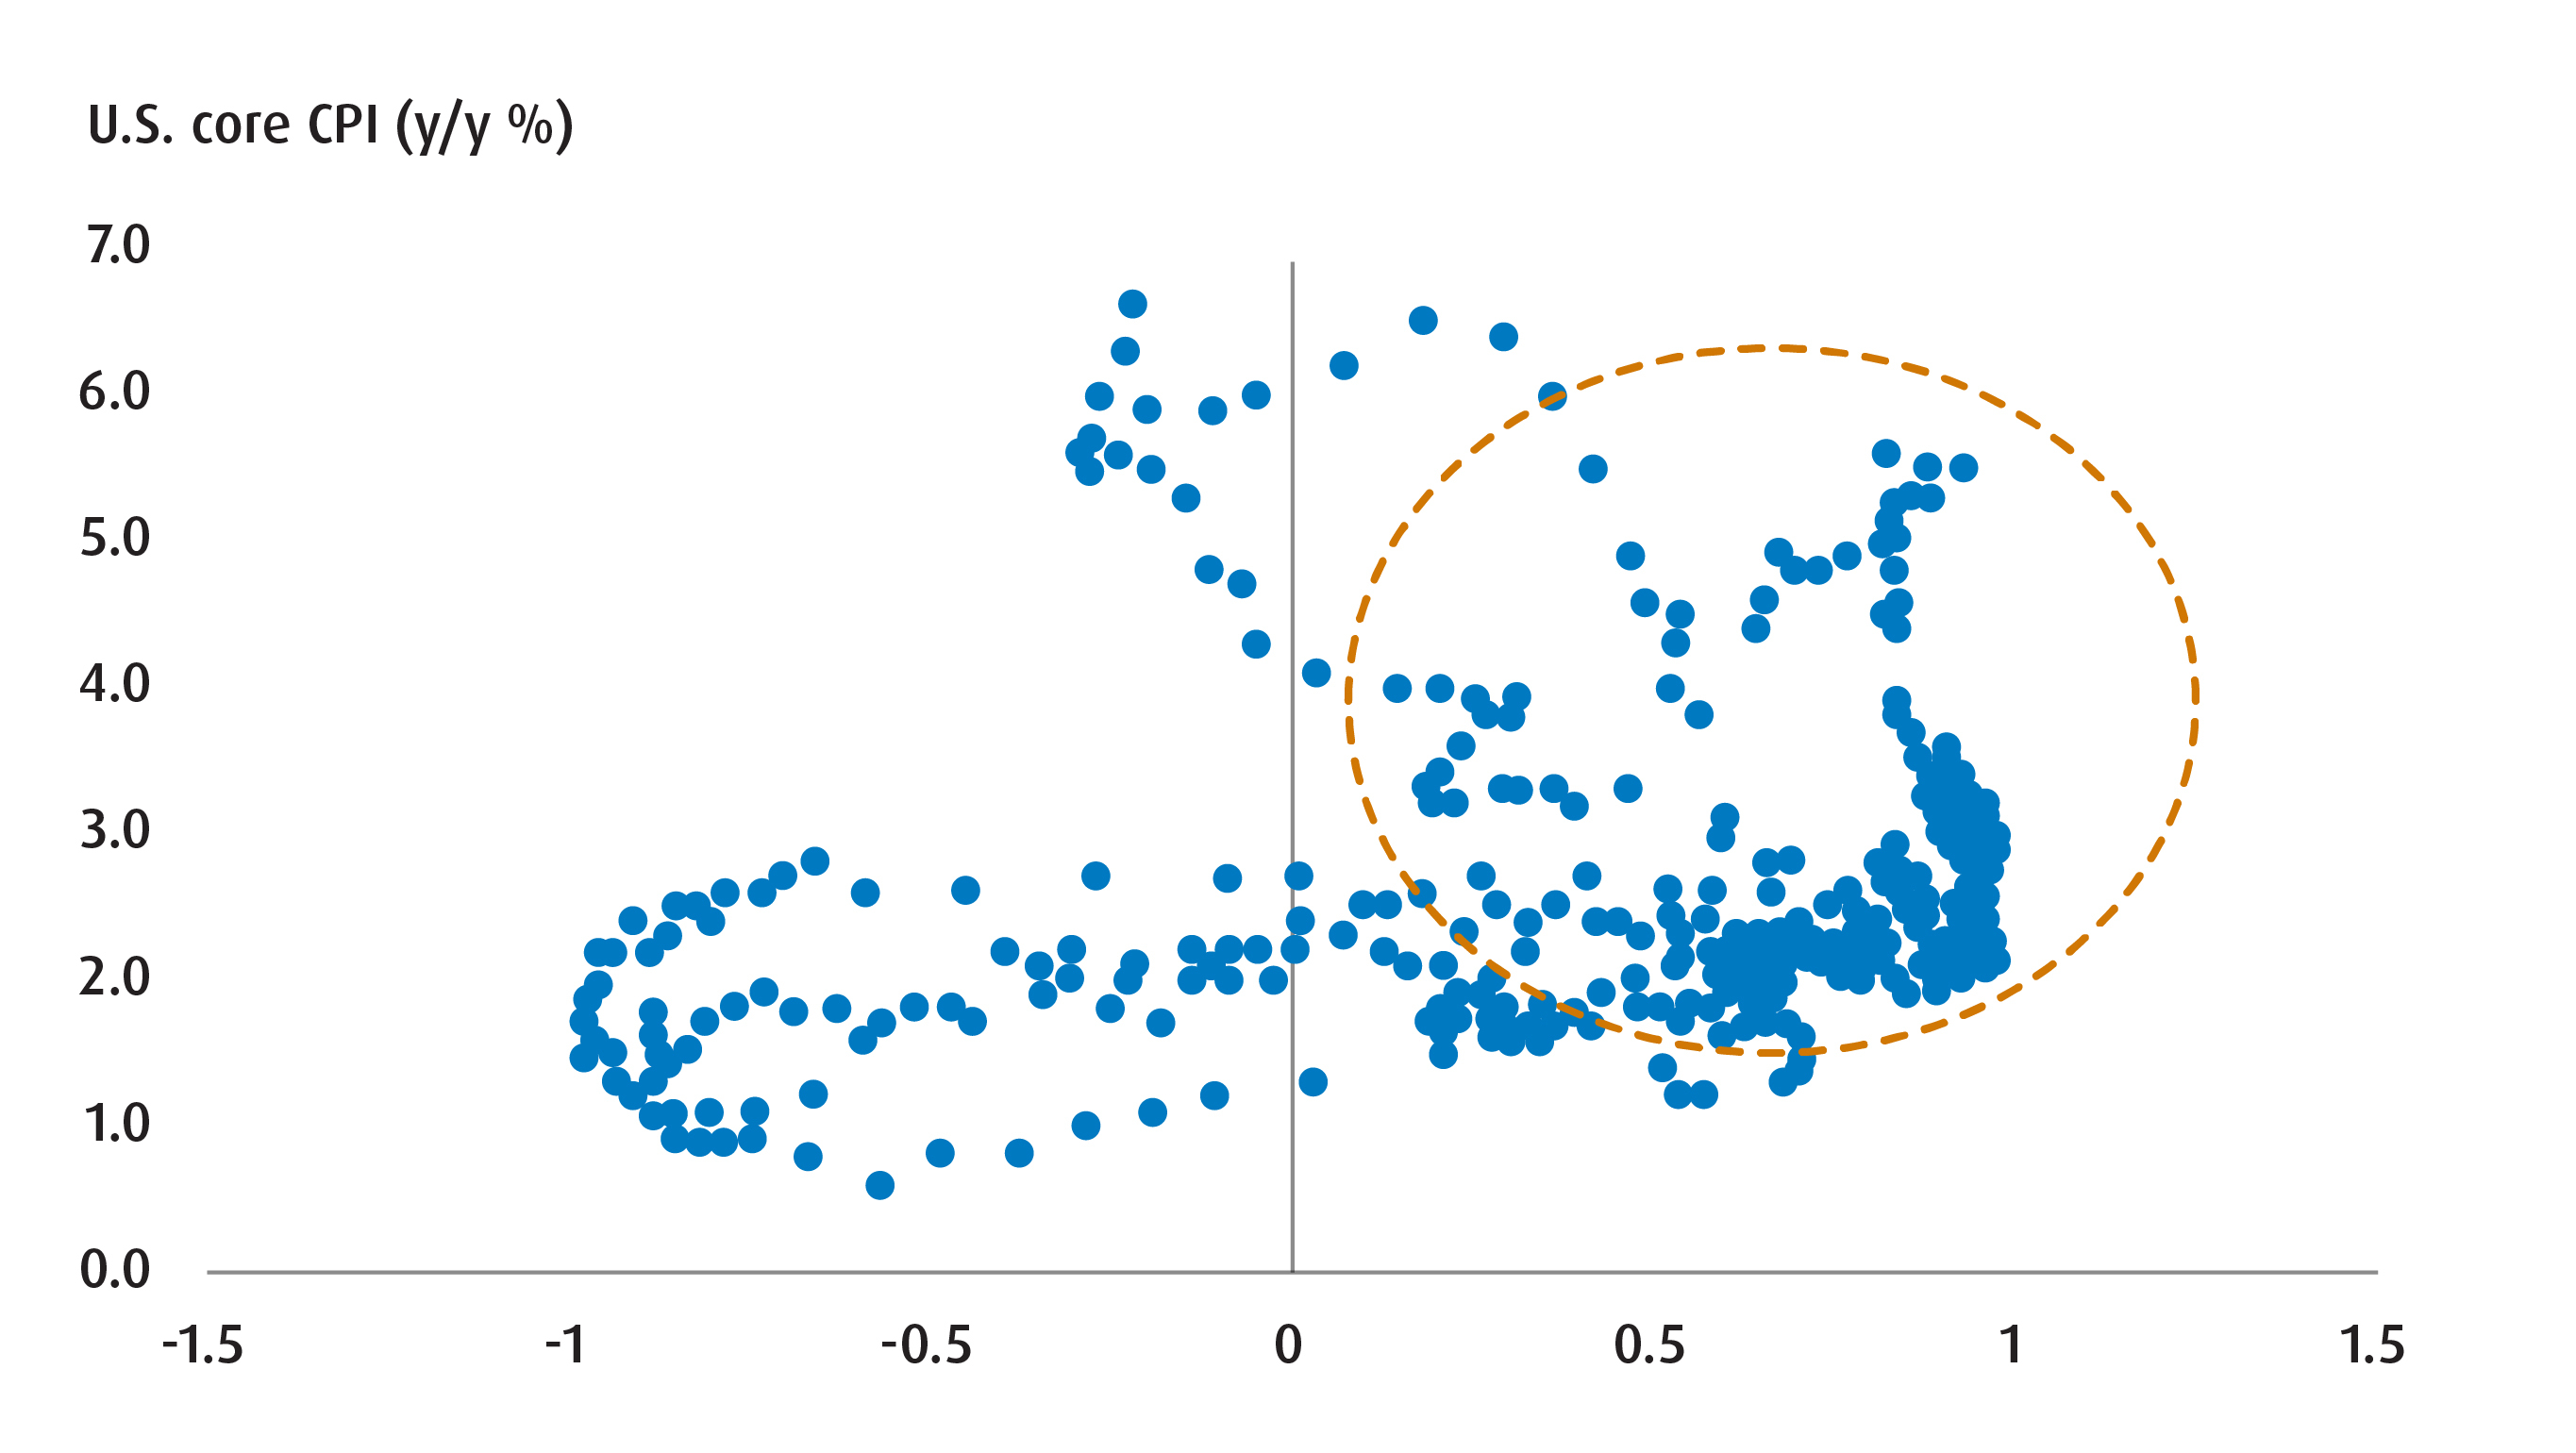
Source: BMO Global Asset Management. 3-year correlation between S&P 500 and U.S. Treasury Index.
In addition, the return structure of ZCOM is diversified. The primary driver of returns is commodities prices, but investors can also benefit from two additional components: roll return, stemming from the closing and opening of new futures contracts,2 as well as collateral return. ZCOM uses ultra short-term, high-quality U.S. corporate bonds to potentially generate additional yield above U.S. treasuries.
Returns driven by 3 components
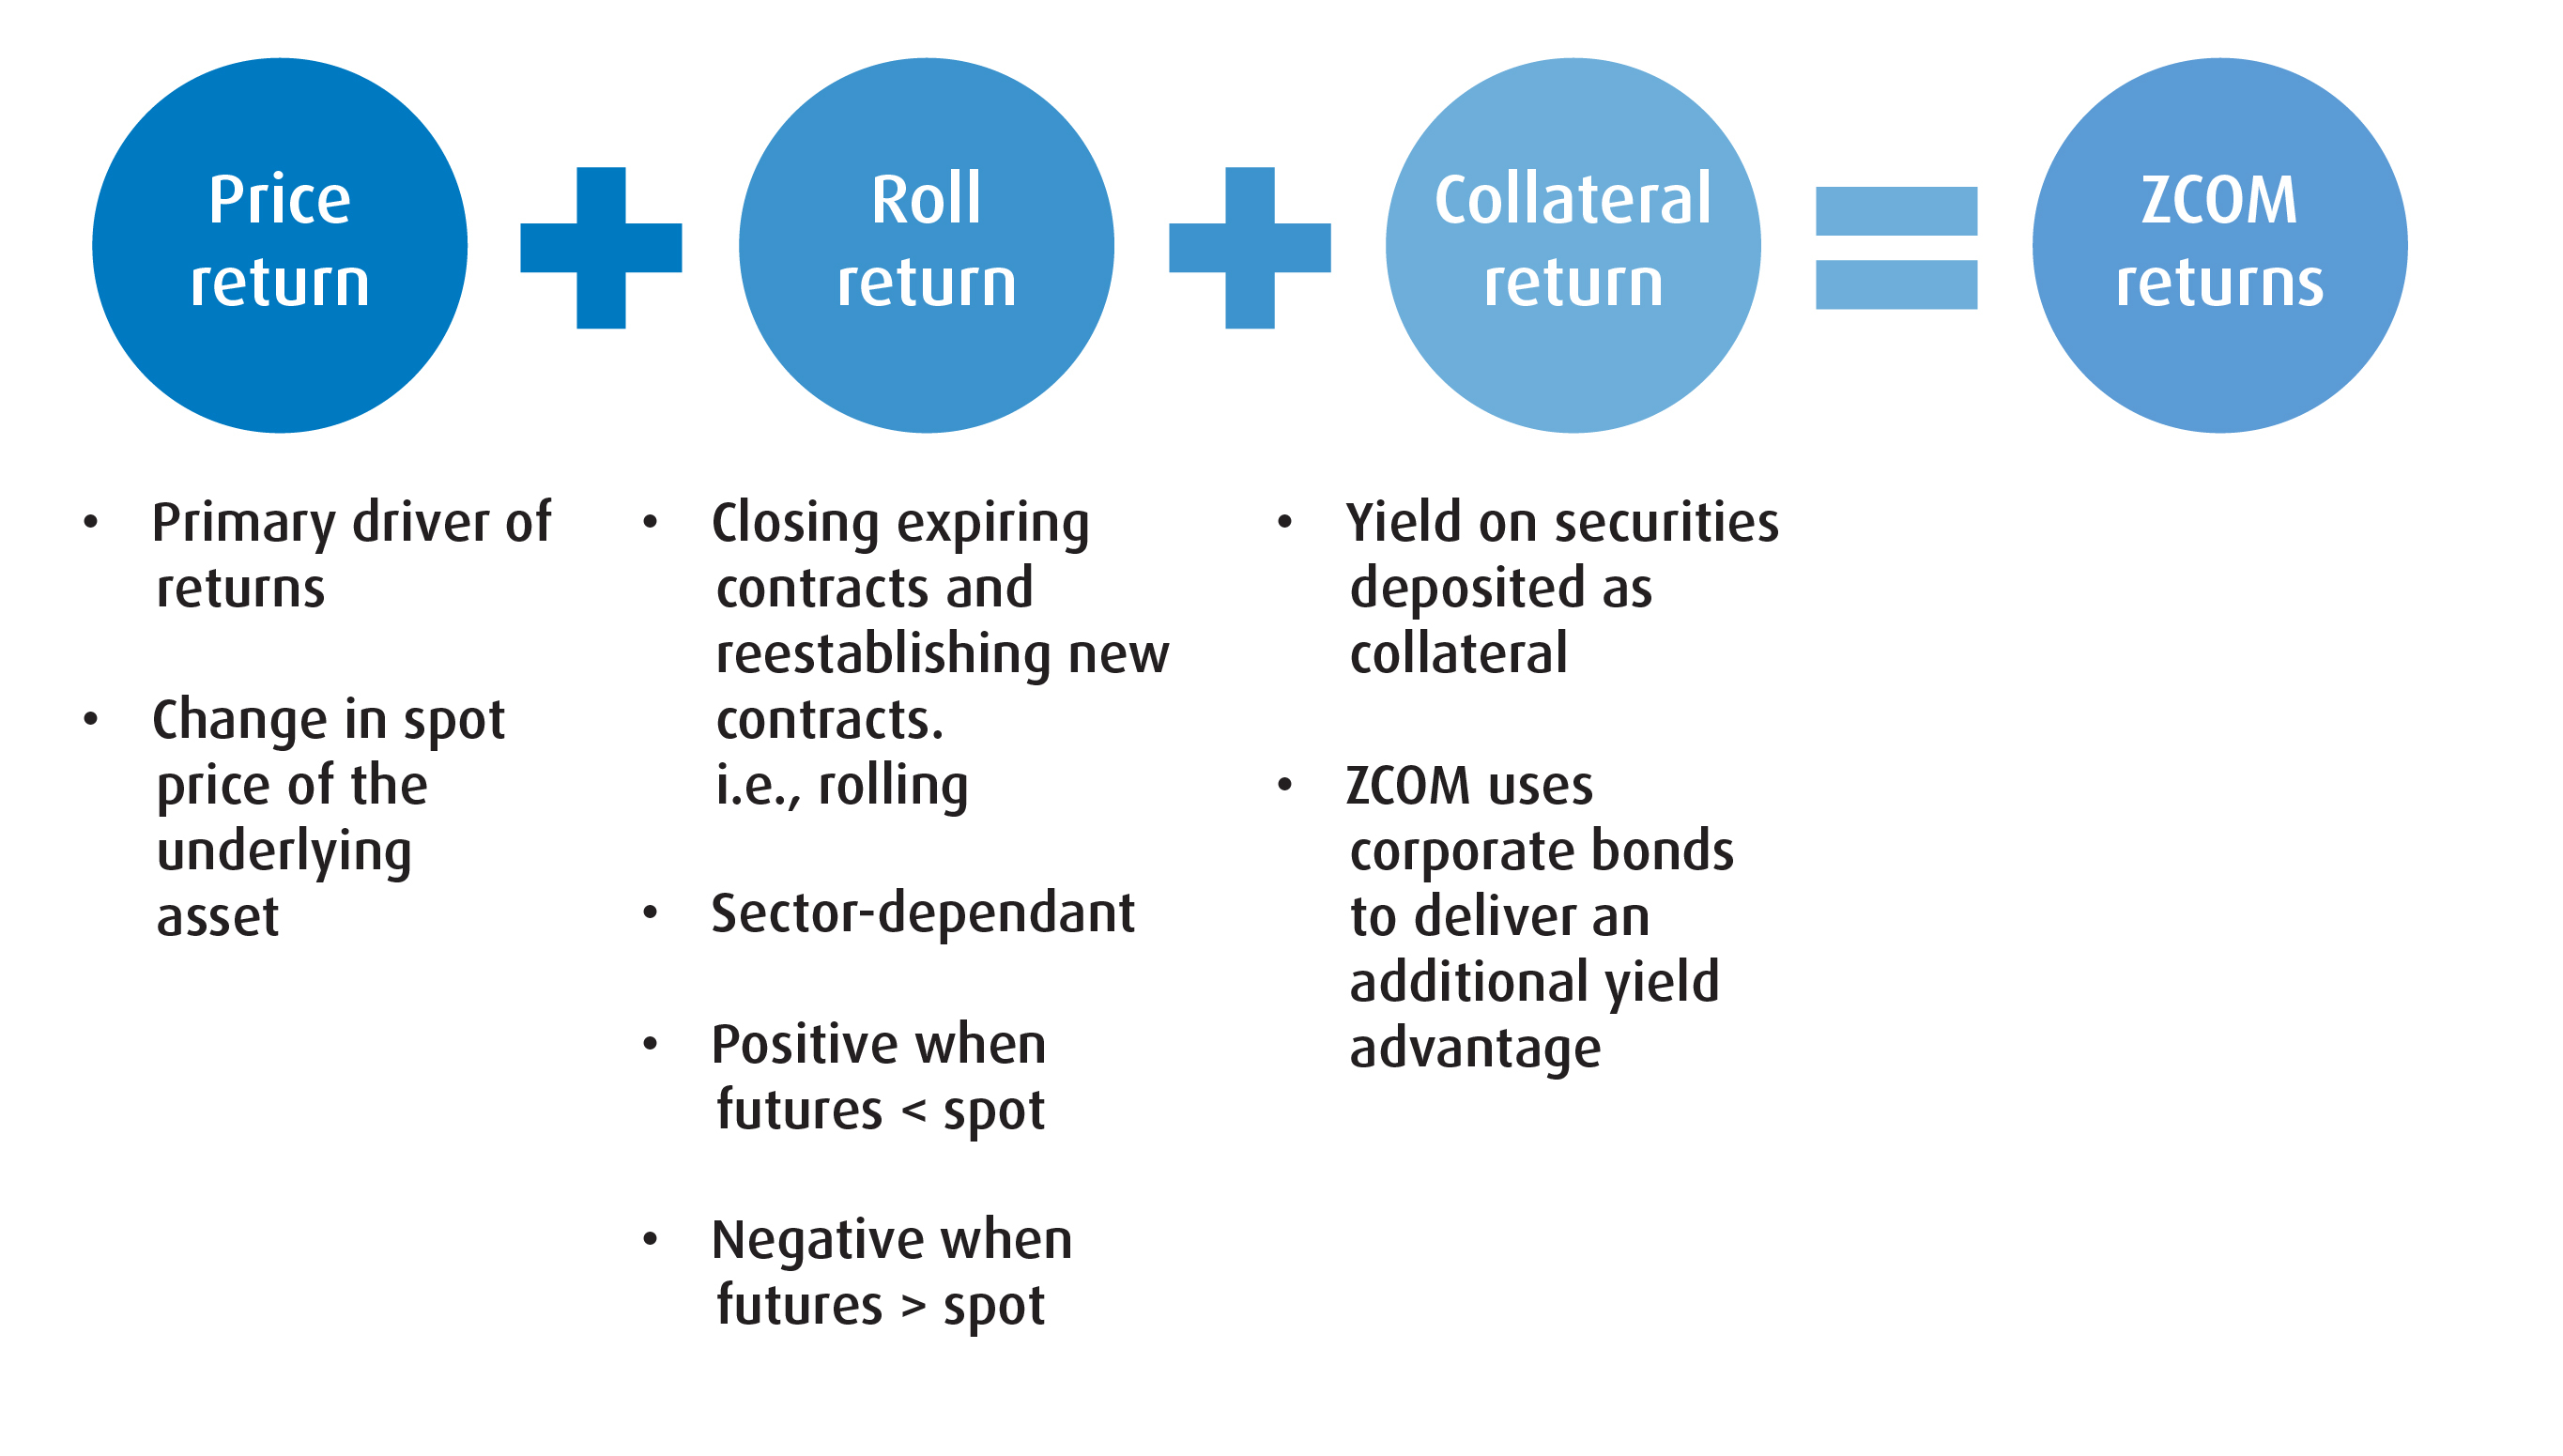
Source: BMO Global Asset Management. For illustrative purposes.
Gold + greater diversification, inflation protection
Commodity cycles are typically quite long because supply cannot increase overnight in large scale mining, energy and agricultural projects. Commodity prices can increase with supply constraints, as well as from geopolitical shocks and broad macroeconomic conditions.
The gold outlook remains bullish, however investors seeking to diversify their commodity exposure to gold plus other precious and industrial metals, energy, agriculture and livestock can consider ZCOM, for low correlation to equities and return potential.
In the current market of geopolitical frictions and trade barriers, commodities may help guard against rising consumer prices and build overall portfolio resiliency.
1 All investments involve risk. The value of an ETF can go down as well as up and you could lose money. The risk of an ETF is rated based on the volatility of the ETF’s returns using the standardized risk classification methodology mandated by the Canadian Securities Administrators. Historical volatility doesn’t tell you how volatile an ETF will be in the future. An ETF with a risk rating of “low” can still lose money. For more information about the risk rating and specific risks that can affect an ETF’s returns, see the BMO ETFs’ prospectus.
2 Futures Contract: a standardized legal agreement to buy or sell a specific asset at a predetermined price at a specified time in the future.
3 Correlation: a statistical measure describing the strength and direction of a relationship between two or more variables. Positive correlation indicates similar movements, up or down together, while negative correlation indicates opposite movements (when one rises, the other falls).
4 Consumer Price Index (CPI): a measure that tracks the average change over time in the prices paid by consumers for a basket of goods and services — such as food, housing, transportation, and healthcare. It’s a key indicator of inflation and helps show how the cost of living is rising or falling.
5 Standard Deviation: a measure of risk in terms of the volatility of returns. It represents the historical level of volatility in returns over set periods. A lower standard deviation means the returns have historically been less volatile and vice-versa. Historical volatility may not be indicative of future volatility.
Disclaimers
For Advisor Use.
This material is for information purposes only. The information contained herein is not, and should not be construed as investment, tax or legal advice to any party. Particular investments and/or trading strategies should be evaluated and professional advice should be obtained with respect to any circumstance.
Any statement that necessarily depends on future events may be a forward-looking statement. Forward-looking statements are not guarantees of performance. They involve risks, uncertainties and assumptions. Although such statements are based on assumptions that are believed to be reasonable, there can be no assurance that actual results will not differ materially from expectations. Investors are cautioned not to rely unduly on any forward-looking statements. In connection with any forward-looking statements, investors should carefully consider the areas of risk described in the most recent prospectus.
Index returns do not reflect transactions costs or the deduction of other fees and expenses and it is not possible to invest directly in an Index. Past performance is not indicative of future results.
“BLOOMBERG®” and the Bloomberg Index are service marks of Bloomberg Finance L.P. and its affiliates, including Bloomberg Index Services Limited (“BISL”), the administrator of the Index (collectively, “Bloomberg”) and have been licensed for use for certain purposes by BMO Asset Management Inc. (the “Licensee”). Bloomberg is not affiliated with the Licensee, and Bloomberg does not approve, endorse, review, or recommend the ETF. Bloomberg does not guarantee the timeliness, accuracy, or completeness of any data or information relating to the ETF.
Commodity-linked derivative instruments are financial contracts whose value is derived from the price of an underlying commodity.
The BMO Broad Commodity ETF is an exchange traded alternative mutual fund within the meaning of NI 81-102. As an alternative mutual fund, the BMO ETF has the ability to invest in asset classes and use investment strategies that are not permitted for conventional mutual funds, including the ability to invest in other alternative mutual funds, employ leverage and borrow cash to use for investment purposes and increased ability to invest in commodities. While these strategies will be used in accordance with the BMO ETF’s investment objective and strategies, during certain market conditions, they may accelerate the pace at which an investor’s investment decreases in value.
Distribution yields are calculated by using the most recent regular distribution, or expected distribution, (which may be based on income, dividends, return of capital, and option premiums, as applicable) and excluding additional year end distributions, and special reinvested distributions annualized for frequency, divided by current net asset value (NAV). The yield calculation does not include reinvested distributions. Distributions are not guaranteed, may fluctuate and are subject to change and/or elimination. Distribution rates may change without notice (up or down) depending on market conditions and NAV fluctuations. The payment of distributions should not be confused with the BMO ETF’s performance, rate of return or yield. If distributions paid by a BMO ETF are greater than the performance of the investment fund, your original investment will shrink. Distributions paid as a result of capital gains realized by a BMO ETF, and income and dividends earned by a BMO ETF, are taxable in your hands in the year they are paid. Your adjusted cost base will be reduced by the amount of any returns of capital. If your adjusted cost base goes below zero, you will have to pay capital gains tax on the amount below zero.
Cash distributions, if any, on units of a BMO ETF (other than accumulating units or units subject to a distribution reinvestment plan) are expected to be paid primarily out of dividends or distributions, and other income or gains, received by the BMO ETF less the expenses of the BMO ETF, but may also consist of non-taxable amounts including returns of capital, which may be paid in the manager’s sole discretion. To the extent that the expenses of a BMO ETF exceed the income generated by such BMO ETF in any given month, quarter, or year, as the case may be, it is not expected that a monthly, quarterly, or annual distribution will be paid. Certain BMO ETFs have adopted a distribution reinvestment plan, which provides that a unitholder may elect to automatically reinvest all cash distributions paid on units held by that unitholder in additional units of the applicable BMO ETF in accordance with the terms of the distribution reinvestment plan. For further information, see the distribution policy in the BMO ETFs’ prospectus.
Commissions, management fees and expenses all may be associated with investments in exchange-traded funds. Please read the ETF Facts or prospectus of the BMO ETFs before investing. Exchange-traded funds are not guaranteed, their values change frequently and past performance may not be repeated.
For a summary of the risks of an investment in the BMO ETFs, please see the specific risks set out in the BMO ETF’s prospectus. BMO ETFs trade like stocks, fluctuate in market value and may trade at a discount to their net asset value, which may increase the risk of loss. Distributions are not guaranteed and are subject to change and/or elimination.
BMO ETFs are managed and administered by BMO Asset Management Inc., an investment fund manager and a portfolio manager, and a separate legal entity from Bank of Montreal. BMO Global Asset Management is a brand name under which BMO Asset Management Inc. and BMO Investments Inc. operate.
“BMO (M-bar roundel symbol)” is a registered trademark of Bank of Montreal, used under licence.
Published: October 2025.