No Guarantees on Fed Cuts from Here: How to Play a Pause
A Fed that is less likely to ease may mean additional headwinds for broad risk assets


Key Takeaways
- There’s a good chance the market is misreading the Federal Reserve. U.S. swaps pricing implies multiple Fed cuts through 2026, but strong growth (~4%, Q31) and inflation near 3% suggest a limited need for aggressive easing.
- Our own feel is that the short-term U.S. neutral rate is higher. That suggests that the Fed funds rate stays higher for longer.
- Portfolio Implications: Position defensively— we favor Quality/low volatility equities, Health Care and Staples. Expect U.S. dollar (USD) strength and pressure on the front end of the UST yield curve.2
We recently rewatched the classic filmRaiders of the Lost Ark, and couldn’t help but draw a comparison between market participants expecting the Fed to cut rates aggressively to Indiana Jones running away from the boulder toward safety in the opening scene.
Indeed, if we examine current pricing for the Federal Open Market Committee (FOMC) in the swaps market, there is a 63% chance that the Fed will cut by 25 basis points (bps) at the December meeting. What’s more is that the market expects a gradual easing throughout 2026 to take the Fed funds rate below the 3.0% level by the end of next year (from an effective rate of 3.9% now). Stop counting on your fingers, folks – that equates to four more cuts from here (see Chart 1).
Chart 1 – Market Implied Fed Funds Rates for 2026 FOMC Dates
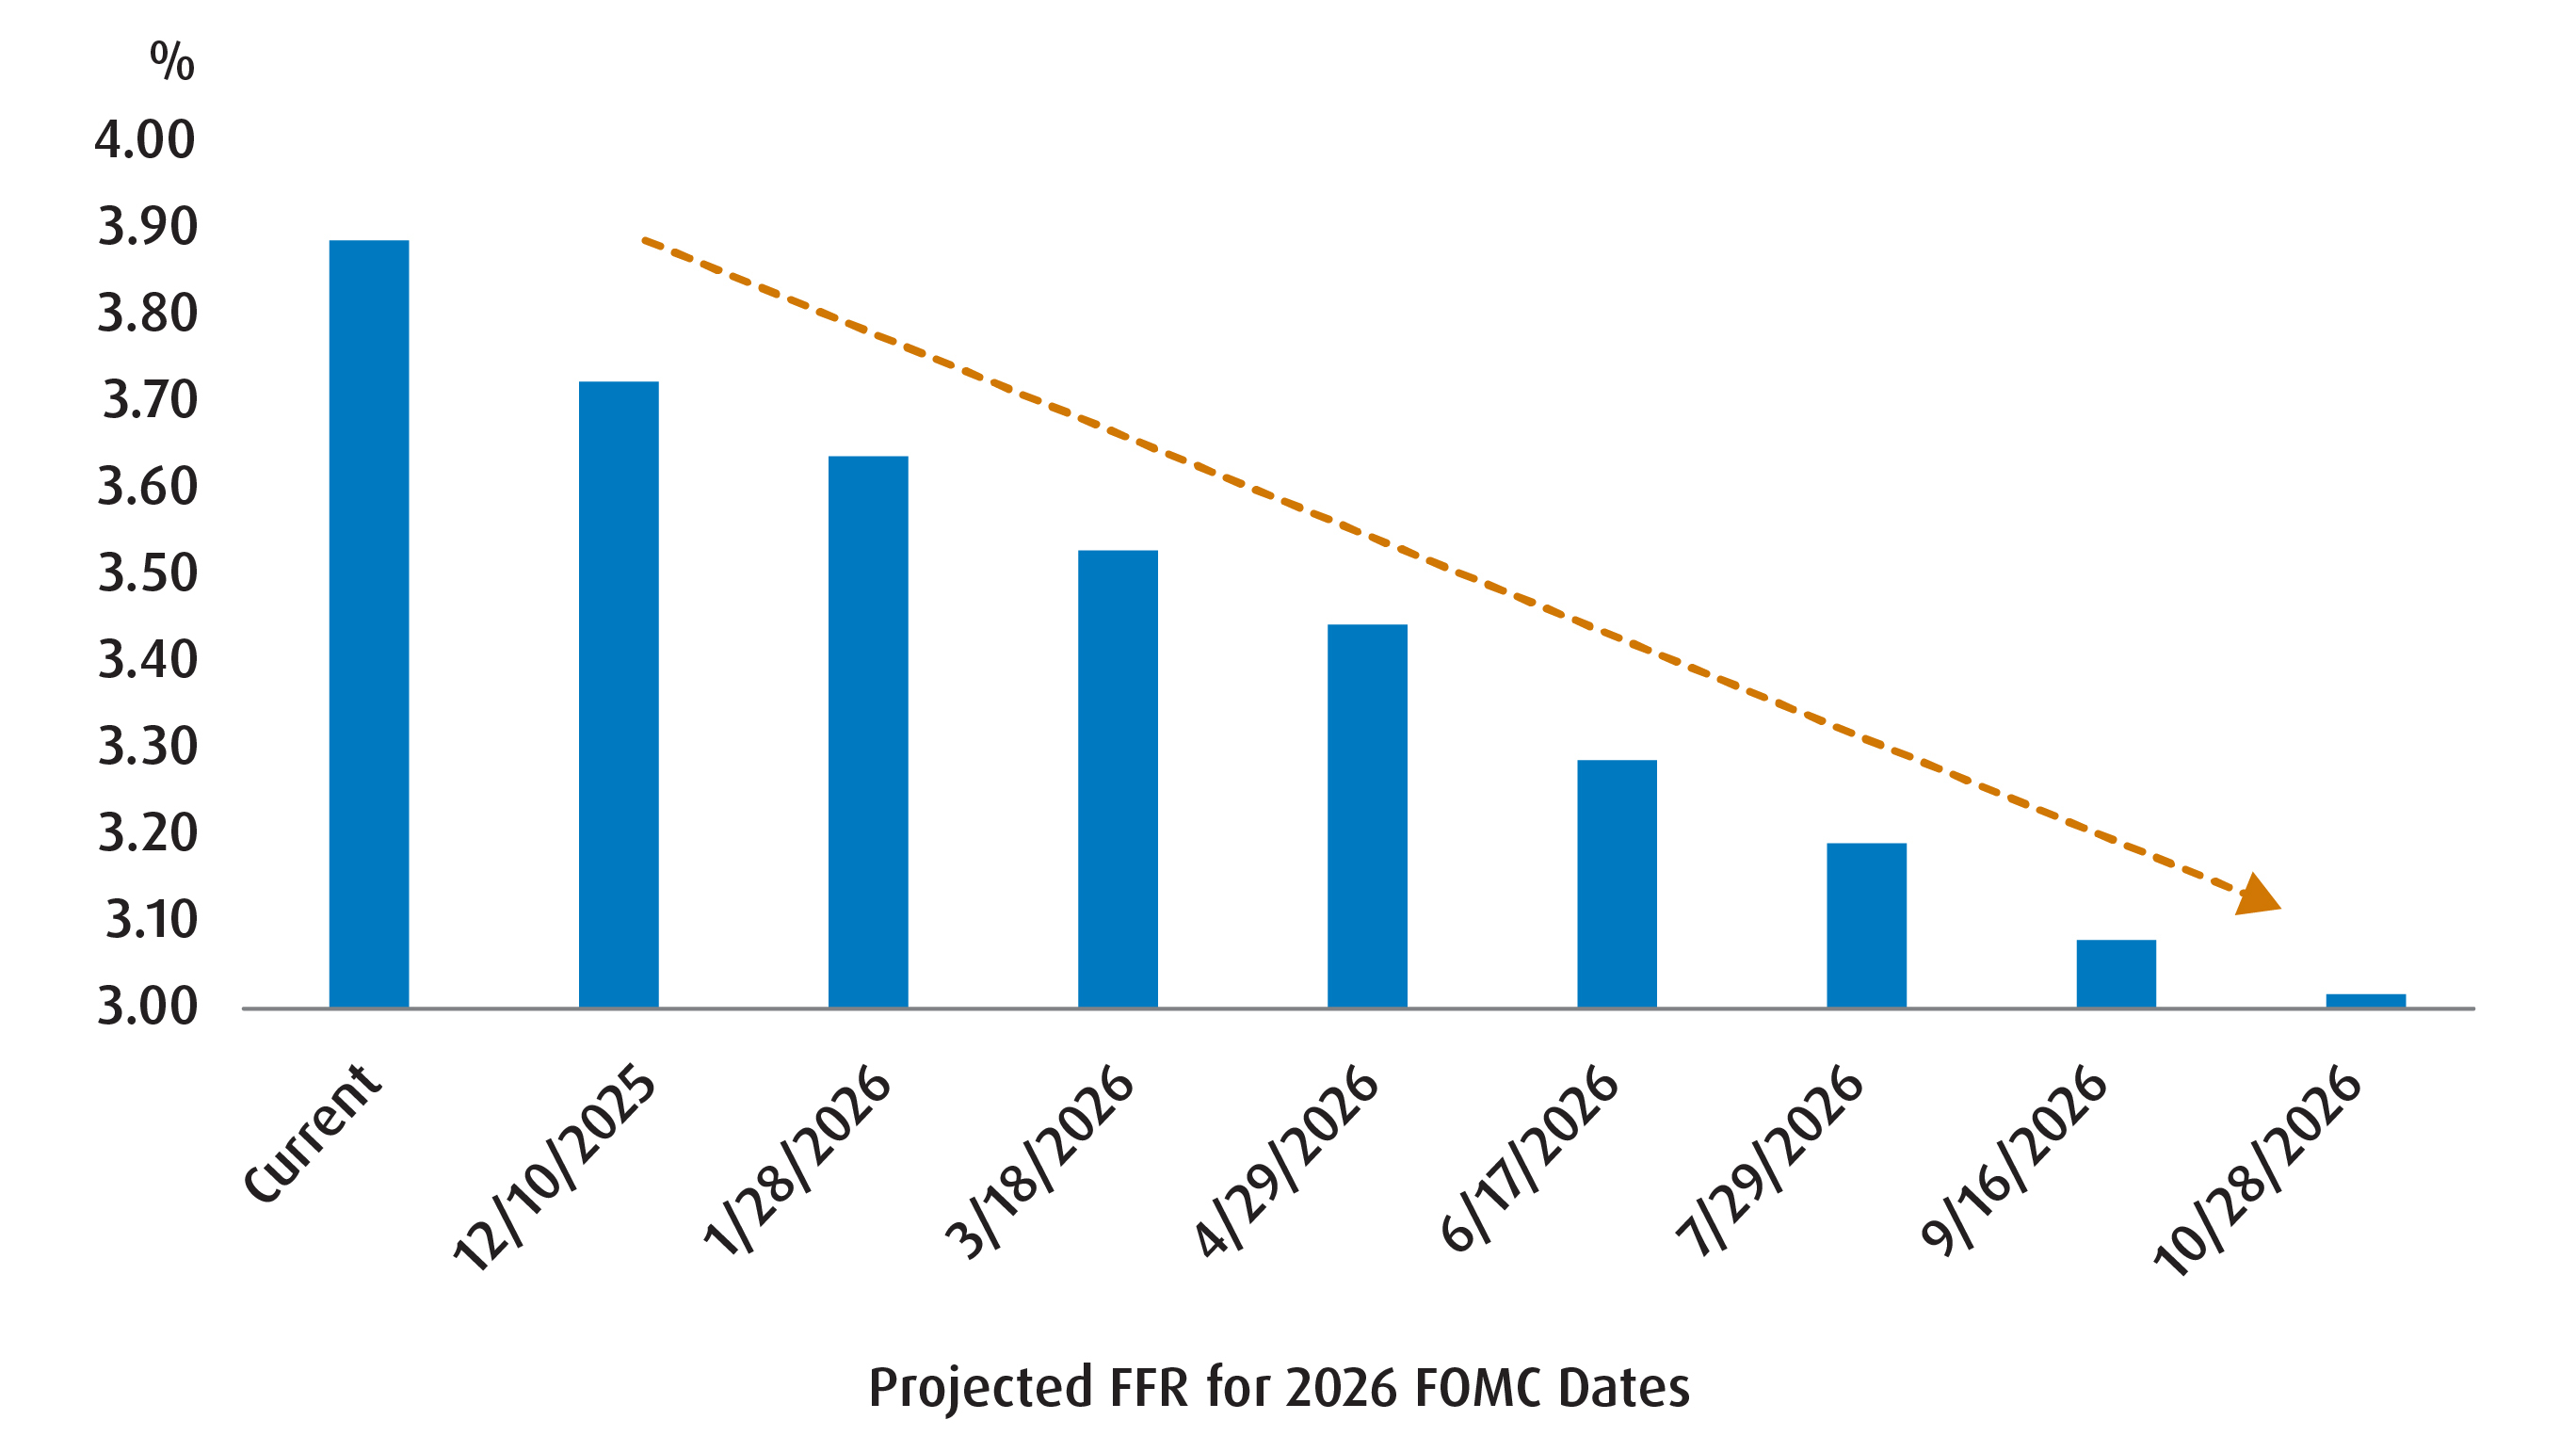
Source: BMO Global Asset Management, Bloomberg.
But if you look at the body of evidence presented in the data so far, it’s not so clear that the Fed should be easing by that much.
While we won’t have a preliminary estimate for Q3 growth until December, current nowcast trackers have it coming in at just above 4%.1 If true, that would mean that the U.S. economy has averaged just over 2% growth (Q/Q, annualized) over the past four quarters. Certainly, we can attribute a fair chunk of that to AI-related capex, but the available retail sales data also tells us that consumer spending also played a key role in driving that growth.
Economic growth at that clip shouldn’t be something that concerns the Fed.
The Bureau of Labor Statistics (BLS) did cancel the release of the October Consumer Price Index (CPI) print, but it’s unlikely that would have provided definitive proof that the Fed is making progress on it’s inflation mandate. Both CPI and PCE (another key inflation measure3 ) are currently tracking closer to 3% as opposed to the 2% target (Chart 2). Also, household expectations of longer-term inflation are still a bit too high for comfort. The textbook would suggest that the Fed needs to keep rates on hold at this point.
Chart 2 – Both CPI and PCE Are Still Well Above the Fed’s Price Objective
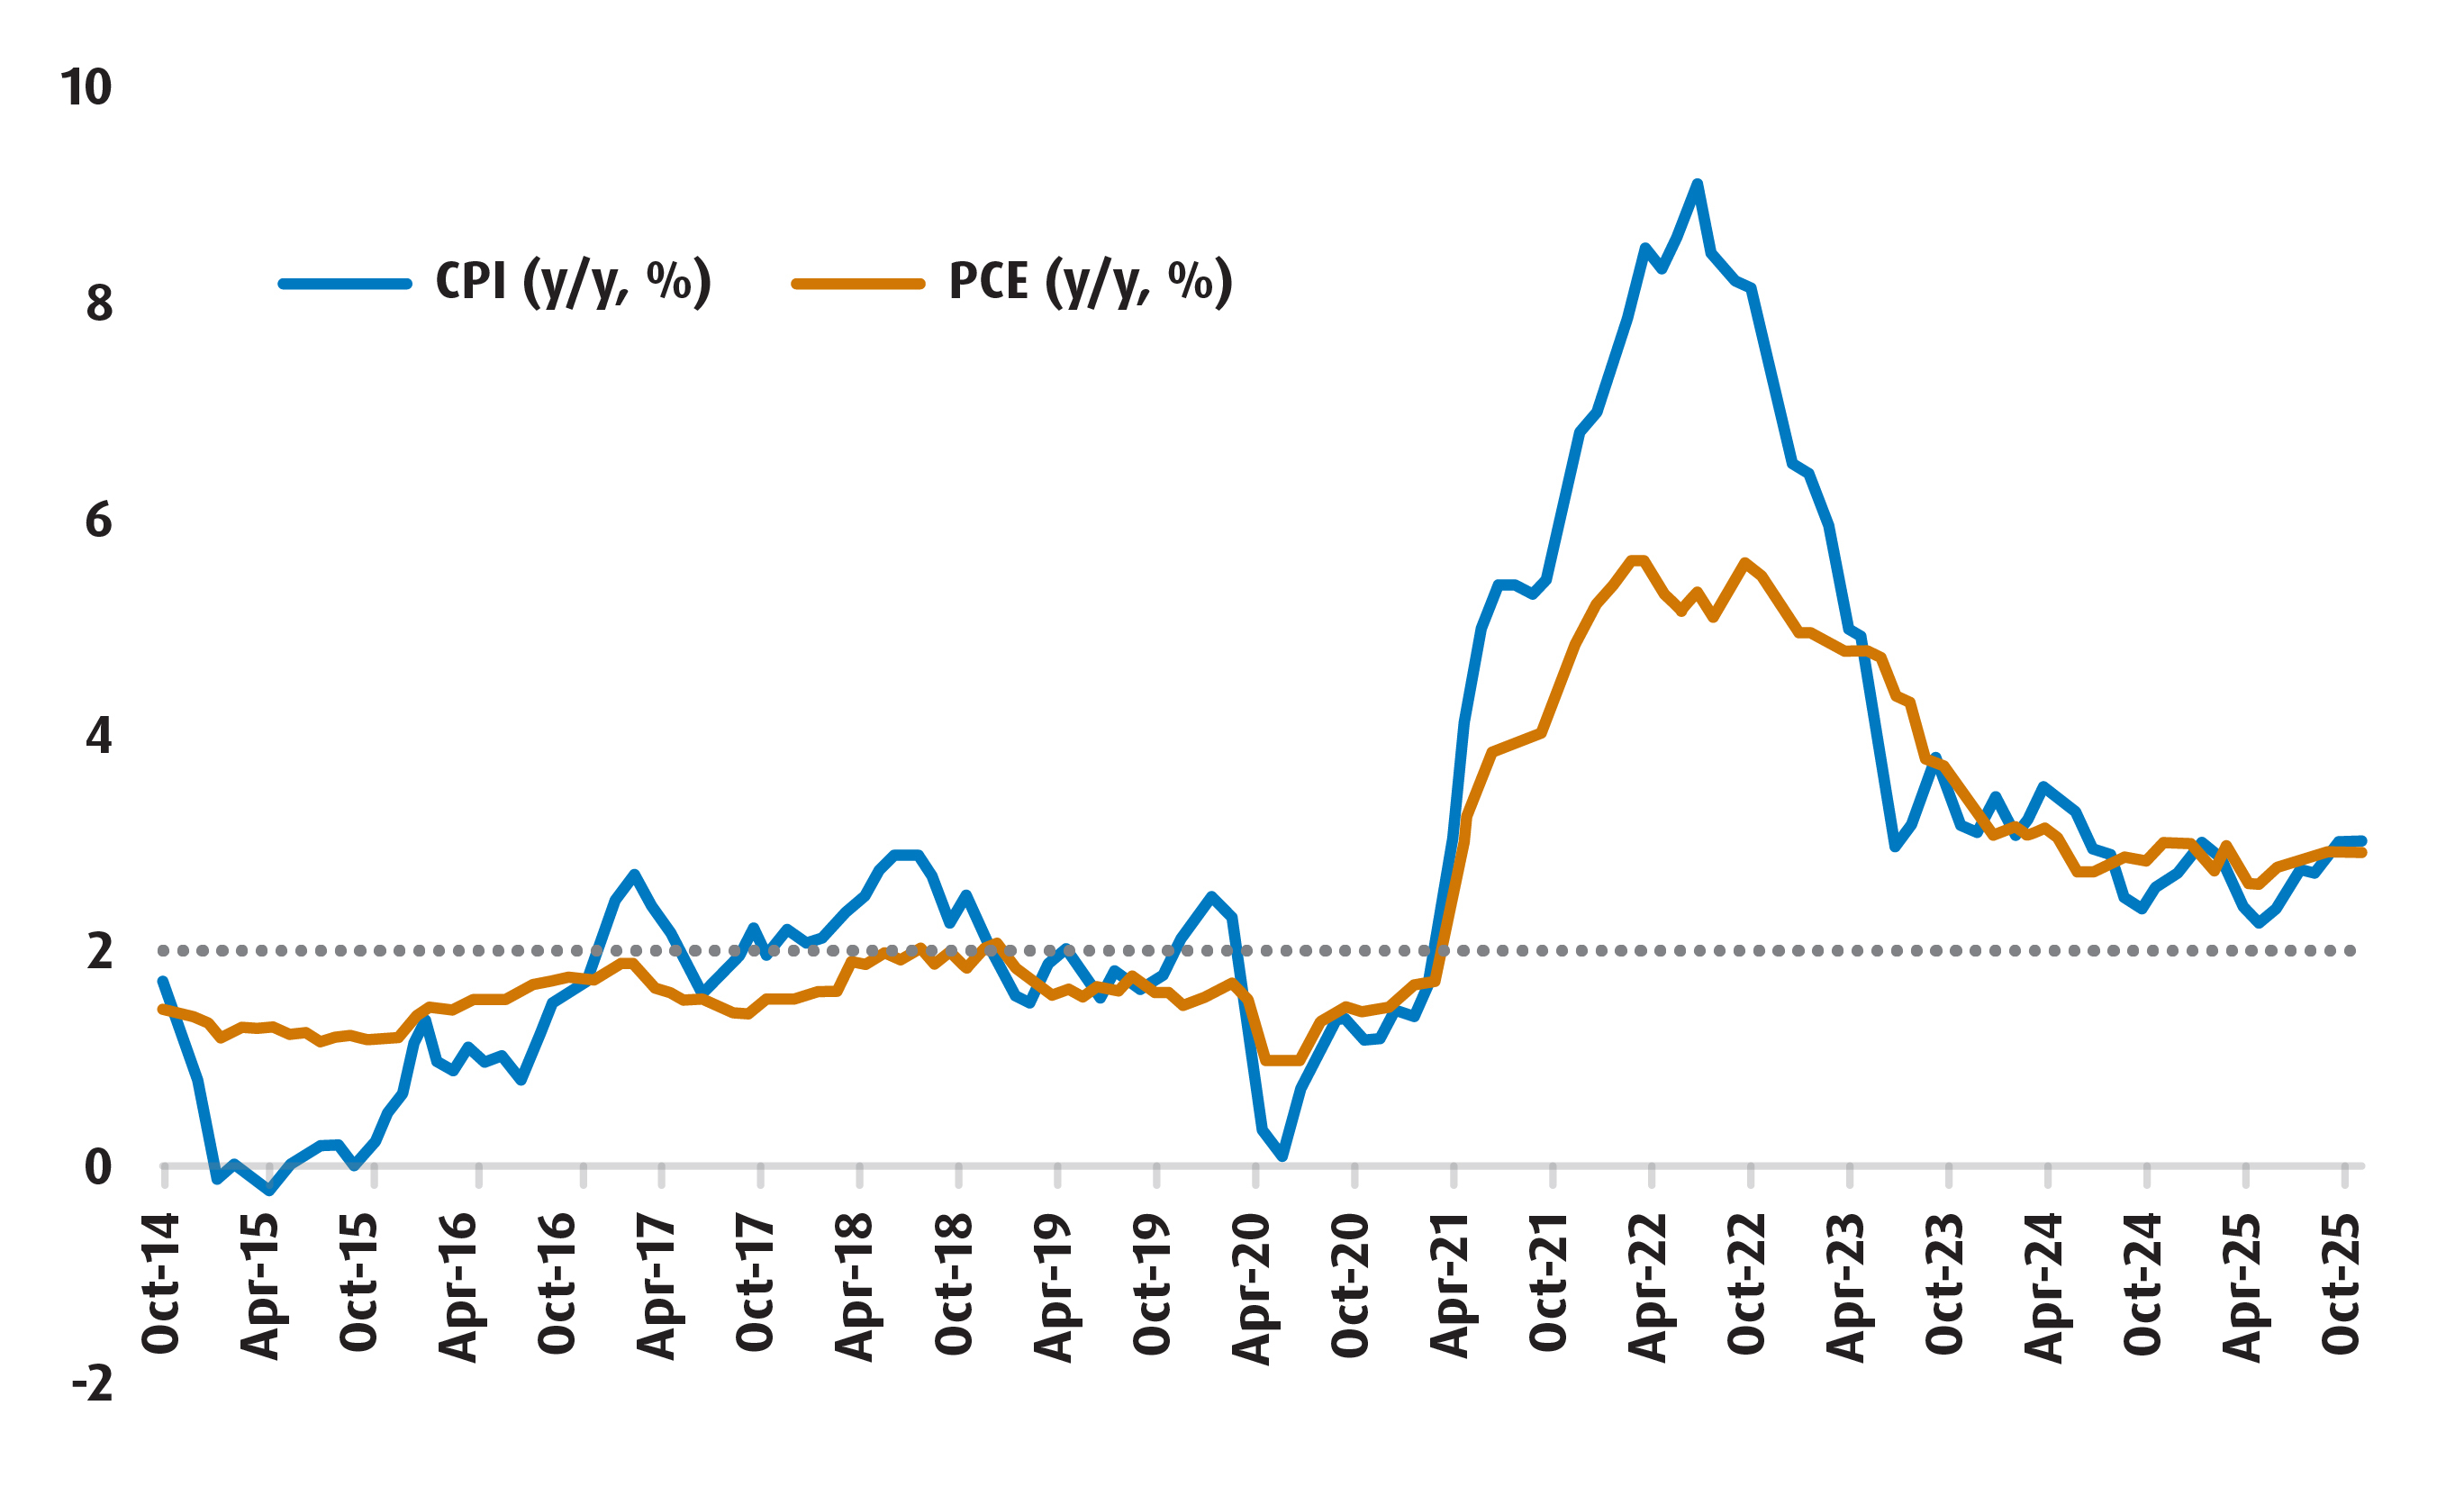
Source: BLS, BMO Global Asset Management, as of October 31, 2025.
Arguments in favour of Fed rate cuts through 2026 lean heavily on two assumptions: first, that the labour market is showing signs of stress, and second, that politics will inevitably encroach on decision-making.
On the first point, we’ll concede that the labour market is showing some strain (the unemployment rate is trending higher). However, the updated claims data show that we’re still far from a point where slack is building materially in the U.S. jobs market. At the very least, this implies that the disinflationary impulse from a softer labour backdrop will be slower than what many expect. On the second point, remember that Trump replacing Powell with someone more politically aligned will still represent just one vote out of 12. The Fed deliberates by majority and a Fed Chair has been outvoted before.
So, what does all of this mean? It tells us that the nominal neutral rate in the short-term is likely higher than what many think. If that is the case, then current monetary policy conditions are likely not as restrictive and there’s little reason to expect the Fed to cut by much more going forward.
And to be fair, it does feel like the equity market is picking up on this point. A Fed that is less likely to ease may mean additional headwinds for broad risk assets. If we are correct – then the tactical path forward is clear - tilt your portfolios to be a bit more defensive as we ride out this wave of caution. That will mean the following:
- Quality and low vol outperform as strategies in the coming period (ZUQ and ZLU).
- Health Care and Staples should continue to shine (ZXLV and ZXLP).
- The U.S. dollar rallies (trim your hedges, please).
- The front-end of the UST curve should come under pressure in the near-term.
Tying this back to our intro, an infamous pop-culture joke is that Indiana Jones is actually irrelevant to the outcome of the story ofRaiders of the Lost Ark. In the end, the bad guys ended up finding the Ark anyway and were still destroyed while the hero was tied up. That’s an apt takeaway for anyone that wants to be too activist in a period where the market is likely misreading the Fed.
Performance (%)
Ticker |
Year-to-Date |
1-Month |
3-Monts |
6 Month |
1-Year |
3- Year |
5- Year |
10- Years |
Since Inception |
Inception Date |
6.70% |
-1.96% |
3.24% |
4.66% |
6.66% |
8.42% |
11.12% |
10.00% |
13.39% |
2013-03-19 |
|
10.75% |
2.85% |
8.99% |
19.35% |
15.55% |
25.83% |
17.42% |
15.76% |
16.68% |
2014-11-05 |
|
Returns are not available as there is less than one year’s performance data. |
2025-02-04 |
|||||||||
2025-02-04 |
||||||||||
Source: Bloomberg, as of October 31, 2025
1 Atlanta Fed, GDPNow, as of November 21, 2025.
2 The UST (U.S. Treasury) yield curve: a line graph that visualizes the interest rates of U.S. government debt, showing the relationship between the yield and the maturity of Treasury securities.
3 PCE inflation: a measure of inflation based on the Personal Consumption Expenditures (PCE) Price Index, which tracks the prices of goods and services purchased by U.S. consumers.
Disclaimers:
For Advisor use.
The communication is for information purposes. The information contained herein is not, and should not be construed as, investment, tax or legal advice to any party. Particular investments and/or trading strategies should be evaluated relative to the individual’s investment objectives and professional advice should be obtained with respect to any circumstance.
The viewpoints expressed by the author represents their assessment of the markets at the time of publication. Those views are subject to change without notice at any time. The information provided herein does not constitute a solicitation of an offer to buy, or an offer to sell securities nor should the information be relied upon as investment advice. Past performance is no guarantee of future results. This communication is intended for informational purposes only.
The portfolio holdings are subject to change without notice and only represent a small percentage of portfolio holdings. They are not recommendations to buy or sell any particular security.
The ETF referred to herein is not sponsored, endorsed, or promoted by MSCI and MSCI bears no liability with respect to the ETF or any index on which such ETF is based. The ETF’s prospectus contains a more detailed description of the limited relationship MSCI has with the Manager and any related ETF.
Any statement that necessarily depends on future events may be a forward-looking statement. Forward-looking statements are not guarantees of performance. They involve risks, uncertainties and assumptions. Although such statements are based on assumptions that are believed to be reasonable, there can be no assurance that actual results will not differ materially from expectations. Investors are cautioned not to rely unduly on any forward-looking statements. In connection with any forward-looking statements, investors should carefully consider the areas of risk described in the most recent prospectus.
Distribution yields are calculated by using the most recent regular distribution, or expected distribution, (which may be based on income, dividends, return of capital, and option premiums, as applicable) and excluding additional year end distributions, and special reinvested distributions annualized for frequency, divided by current net asset value (NAV). The yield calculation does not include reinvested distributions.
Distributions are not guaranteed, may fluctuate and are subject to change and/or elimination. Distribution rates may change without notice (up or down) depending on market conditions and NAV fluctuations.
The payment of distributions should not be confused with the BMO ETF’s performance, rate of return or yield. If distributions paid by a BMO ETF are greater than the performance of the investment fund, your original investment will shrink. Distributions paid as a result of capital gains realized by a BMO ETF, and income and dividends earned by a BMO ETF, are taxable in your hands in the year they are paid.
Your adjusted cost base will be reduced by the amount of any returns of capital. If your adjusted cost base goes below zero, you will have to pay capital gains tax on the amount below zero.
Cash distributions, if any, on units of a BMO ETF (other than accumulating units or units subject to a distribution reinvestment plan) are expected to be paid primarily out of dividends or distributions, and other income or gains, received by the BMO ETF less the expenses of the BMO ETF, but may also consist of non-taxable amounts including returns of capital, which may be paid in the manager’s sole discretion. To the extent that the expenses of a BMO ETF exceed the income generated by such BMO ETF in any given month, quarter, or year, as the case may be, it is not expected that a monthly, quarterly, or annual distribution will be paid. Distributions, if any, in respect of the accumulating units of BMO Short Corporate Bond Index ETF, BMO Short Federal Bond Index ETF, BMO Short Provincial Bond Index ETF, BMO Ultra Short-Term Bond ETF and BMO Ultra Short-Term US Bond ETF will be automatically reinvested in additional accumulating units of the applicable BMO ETF. Following each distribution, the number of accumulating units of the applicable BMO ETF will be immediately consolidated so that the number of outstanding accumulating units of the applicable BMO ETF will be the same as the number of outstanding accumulating units before the distribution. Non-resident unitholders may have the number of securities reduced due to withholding tax. Certain BMO ETFs have adopted a distribution reinvestment plan, which provides that a unitholder may elect to automatically reinvest all cash distributions paid on units held by that unitholder in additional units of the applicable BMO ETF in accordance with the terms of the distribution reinvestment plan. For further information, see the distribution policy in the BMO ETFs’ prospectus.
Past Performance is not indicative of future results.
The Select Sector SPDR Trust consists of eleven separate investment portfolios (each a “Select Sector SPDR ETF” or an “ETF” and collectively the “Select Sector SPDR ETFs” or the “ETFs”). Each Select Sector SPDR ETF is an “index fund” that invests in a particular sector or group of industries represented by a specified Select Sector Index. The companies included in each Select Sector Index are selected on the basis of general industry classification from a universe of companies defined by the S&P 500®. The investment objective of each ETF is to provide investment results that, before expenses, correspond generally to the price and yield performance of publicly traded equity securities of companies in a particular sector or group of industries, as represented by a specified market sector index.
The Index is a product of S&P Dow Jones Indices LLC or its affiliates (“SPDJI”), and has been licensed for use by the Manager. S&P®, S&P 500®, US 500, The 500, iBoxx®, iTraxx® and CDX® are trademarks of S&P Global, Inc. or its affiliates (“S&P”) and Dow Jones® is a registered trademark of Dow Jones Trademark Holdings LLC (“Dow Jones”), and these trademarks have been licensed for use by SPDJI and sublicensed for certain purposes by the Manager. The ETF is not sponsored, endorsed, sold or promoted by SPDJI, Dow Jones, S&P, their respective affiliates, and none of such parties make any representation regarding the advisability of investing in such product(s) nor do they have any liability for any errors, omissions, or interruptions of the Index.
The S&P 500 Index is an unmanaged index of 500 common stocks that is generally considered representative of the U.S. stock market. The index is heavily weighted toward stocks with large market capitalizations and represents approximately two-thirds of the total market value of all domestic common stocks.
The S&P 500 Index figures do not reflect any fees, expenses or taxes. An investor should consider investment objectives, risks, fees and expenses before investing.
You cannot invest directly in an index.
Commissions, management fees and expenses all may be associated with investments in exchange traded funds. Please read the ETF Facts or prospectus of the BMO ETFs before investing. The indicated rates of return are the historical annual compounded total returns including changes in unit value and reinvestment of all dividends or distributions and do not take into account sales, redemption, distribution or optional charges or income taxes payable by any unitholder that would have reduced returns. Exchange traded funds are not guaranteed, their values change frequently and past performance may not be repeated.
For a summary of the risks of an investment in the BMO ETFs, please see the specific risks set out in the BMO ETF’s prospectus. BMO ETFs trade like stocks, fluctuate in market value and may trade at a discount to their net asset value, which may increase the risk of loss. Distributions are not guaranteed and are subject to change and/or elimination.
BMO ETFs are managed by BMO Asset Management Inc., which is an investment fund manager and a portfolio manager, and a separate legal entity from Bank of Montreal.
BMO Global Asset Management is a brand name under which BMO Asset Management Inc. and BMO Investments Inc. operate.
“BMO (M-bar roundel symbol)” is a registered trademark of Bank of Montreal, used under licence.