Sectors portfolio: What if the Fed ends up cutting by more?


- Over the past few months, we’ve shifted from a defensive posture to a more neutral one. That reflects our view that the risks to U.S. large caps feel a bit more balanced than they have in previous months.
- Certainly, there have been several catalysts that have dominated the news flow of late (the “One, Big, Beautiful Bill”, Section 899, Israel/Iran). However, the still uncertain and ephemeral nature of these catalysts should serve as a reminder that when it comes to long-term market projections, the fundamentals are what we should always be paying attention to.
- By “fundamentals,” we mean what the incoming economic data is telling us about the underlying nature of the economy as well as whether the market has the Federal Reserve (Fed) properly gauged. Indeed, we can get a feel for the latter by extracting what futures markets are pricing in in terms of Fed rate cuts by the end of 2025 and 2026, and what the overnight index swap (OIS) market is pricing in for the terminal rate for this cycle.
- For instance, the December 2025 contract for the 90-day Fed funds future is currently implying a Fed funds rate of 3.75% by the end of this year. That would imply that the market expects two more cuts from the Federal Open Market Committee (FOMC) before the year is out.
- The December 2026 contract is currently implying a Fed funds rate of 3.075% by the end of next year. That would mean around 125 basis points (bps) of easing (or five 25bps cuts) between now and then.
- For the terminal rate, we can gauge what the market is pricing in by looking at forward 1-month OIS rates over the coming years and finding the lowest rate. A cursory glance also shows that rate at around 3.07% — which is in line with what the December 2026 Fed funds futures contract is implying. The takeaway here is that the market is currently priced for two 25bps cuts this year, and three 25bps cuts next year before it enters an extended pause (Chart 1).
- However, in our minds, the risks for more rate cuts by the end of 2026 are higher than the risks for less. Indeed, we are already seeing a deceleration in prices (albeit the impact of tariffs is uncertain) while cracks in the labour sector are beginning to show. The implication here is that there is room for the market to price in additional easing – which should weigh on front-end UST yields. In line with that view, we’re already seeing a pivot from a few FOMC board members who are expecting a more ‘transitory’ impact on prices from tariffs.
- Bringing it back to sectors, Real Estate and Utilities are the two that have exhibited the strongest inverse correlation to 2-year UST yields since the Fed began this monetary policy cycle in March 2022 (Chart 2). Put simply, if we expect additional Fed cuts to be priced in, then the U.S. 2-year yield should head lower, while Utilities and Real Estate should outperform (if prior patterns are any indication).
- While Utilities should also benefit as the economy moves from expansion to slowdown, Real Estate has favourable seasonality as we head into the summer months (particularly for July and August).
- Additional sectors we like include Technology (momentum) and Materials (earnings growth). Conversely, we are trimming our position in Communications (poor seasonality) and Energy (which remains too volatile).
- Please note – we are initiating our new Sector Portfolio. Within this portfolio, we will be invested in each of the Level 1 GICS sectors using the weight of that sector in the S&P 500 as a benchmark. We will be recalibrating the weights to reflect our own views on a monthly basis from here.
- The July edition of the ‘BMO GAM S&P 500 Sector Portfolio’ is reflected in Chart 3.
Sectors we are overweight:
Chart 1 – What the market is pricing for the Fed rate cycle from here
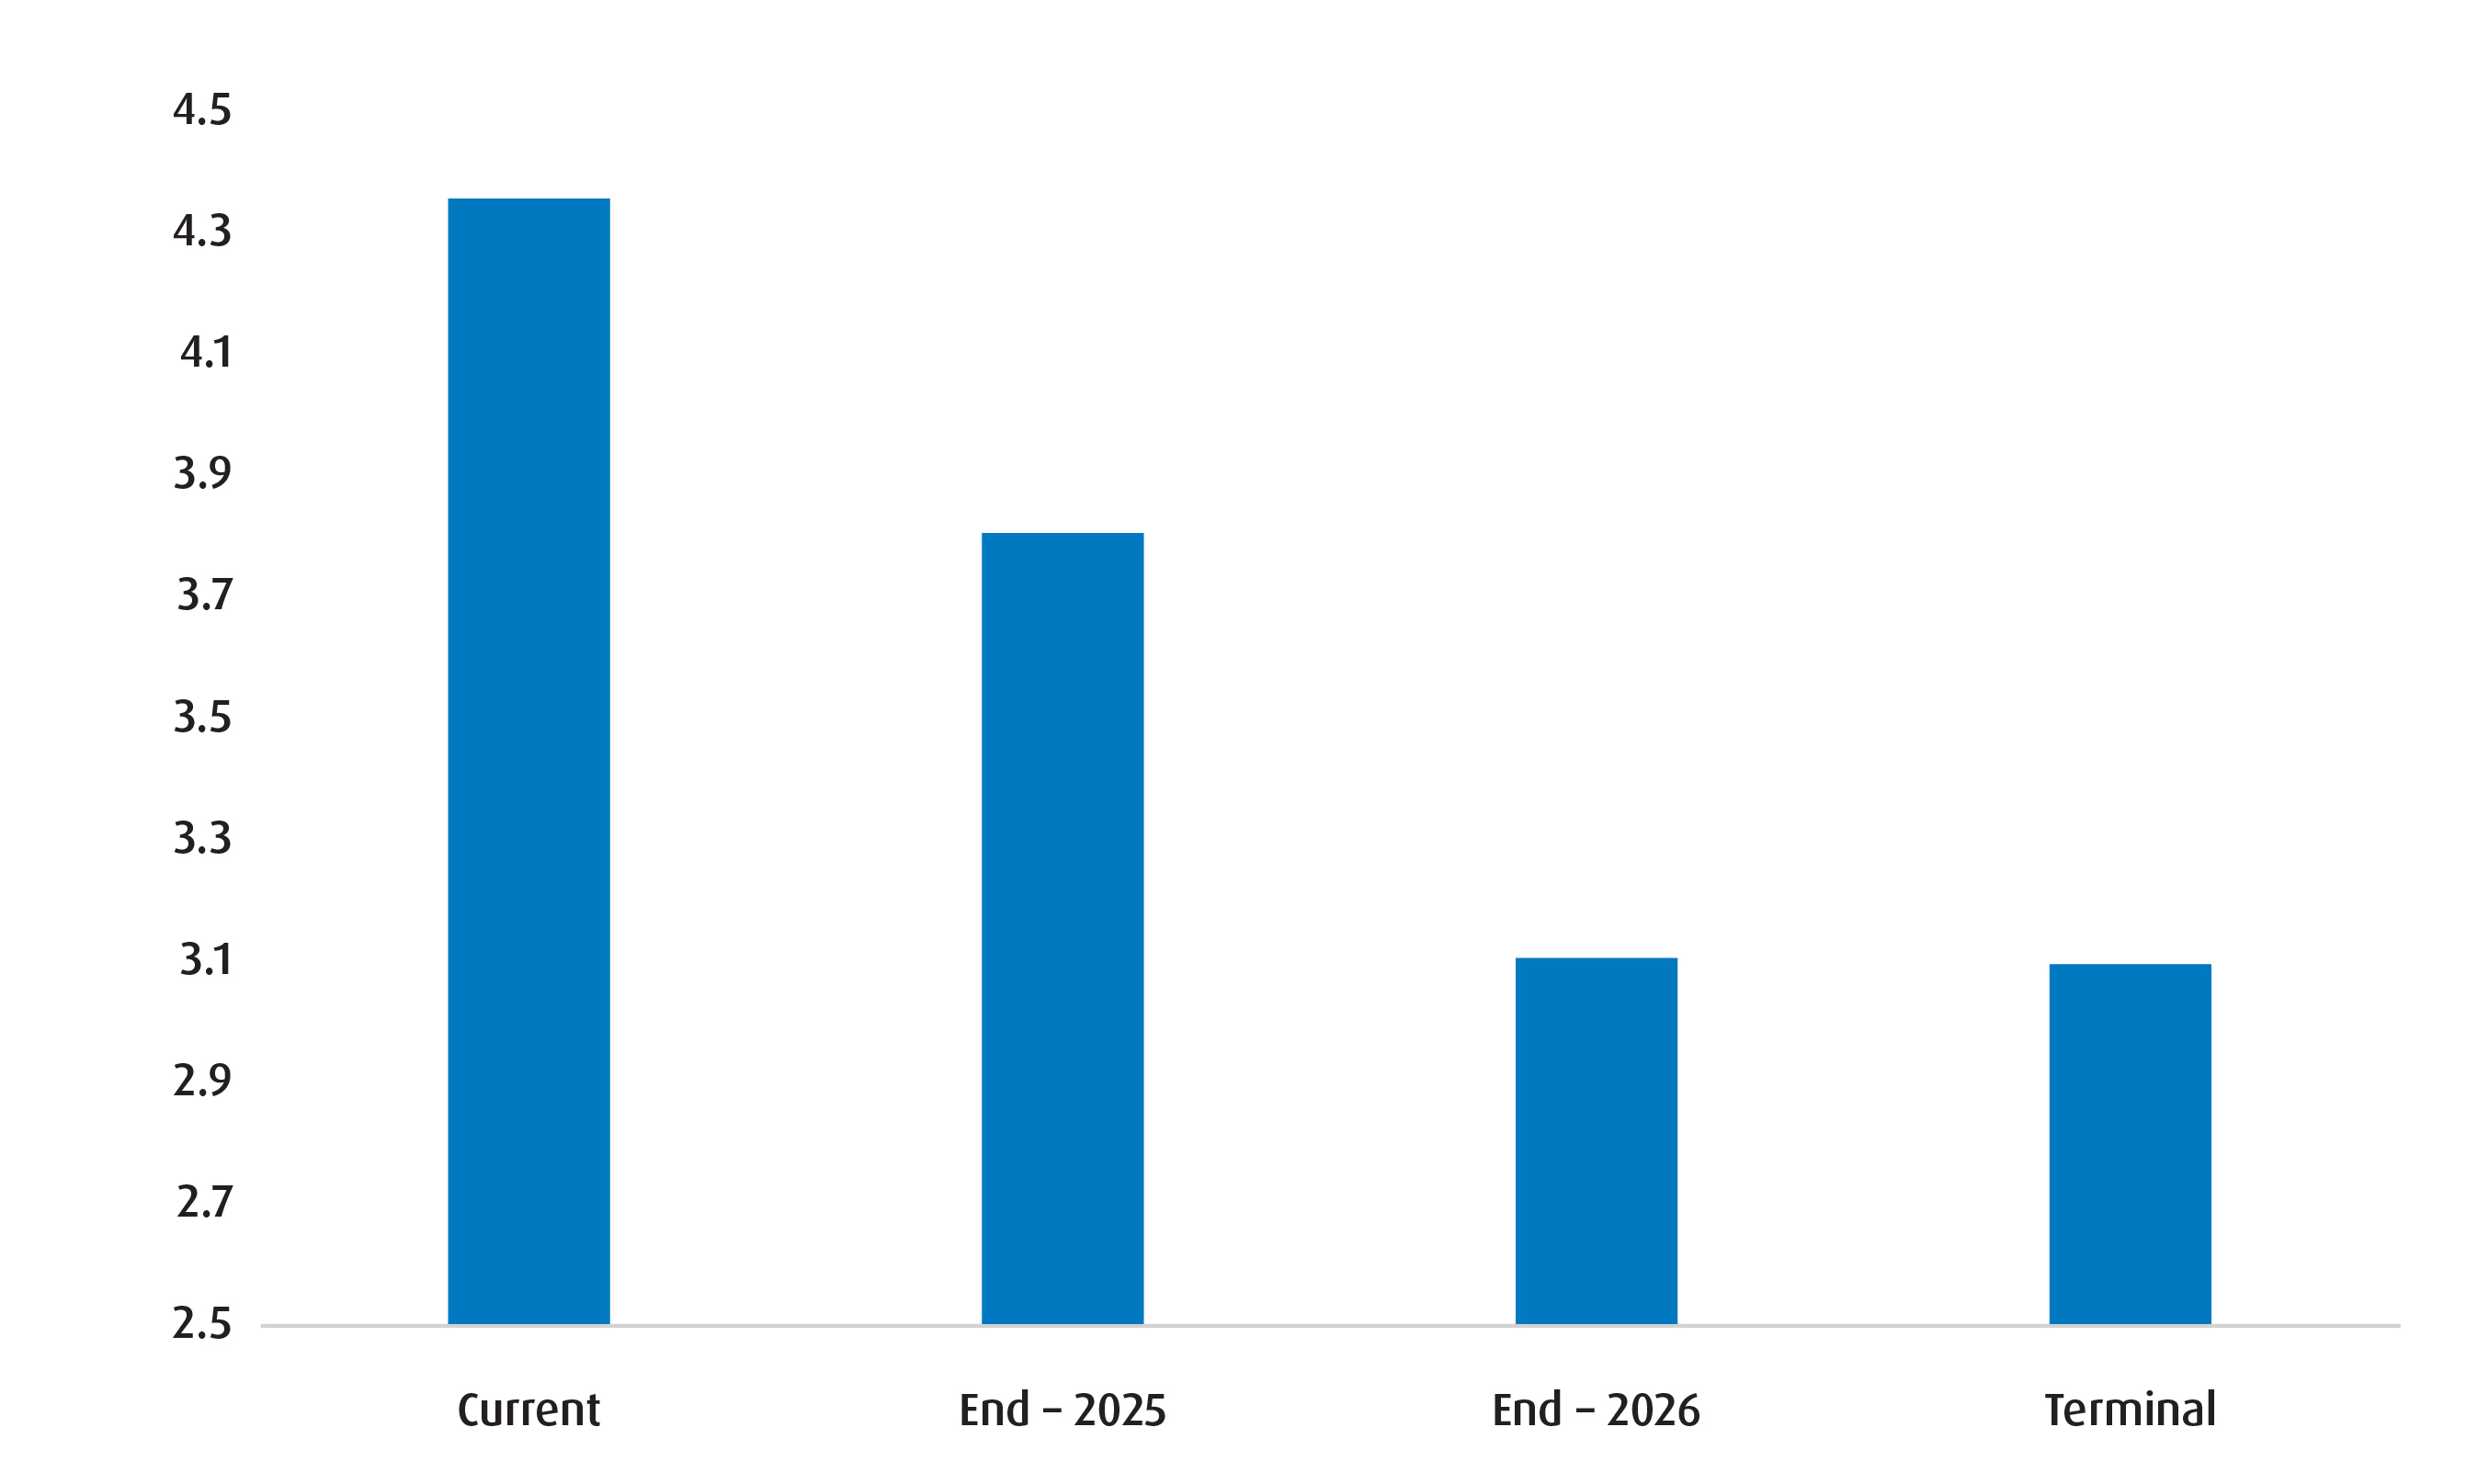
*Current rate is the Fed funds effective rate (4.33%).
**End 2025 and End 2026 rate is found using Fed funds futures, Terminal is found using 1-month forward OIS.
***As of June 25, 2025.
Source: Bloomberg, BMO Global Asset Management.
Chart 2 – Correlation to U.S. 2-year yield (March 2022 – June 2025)
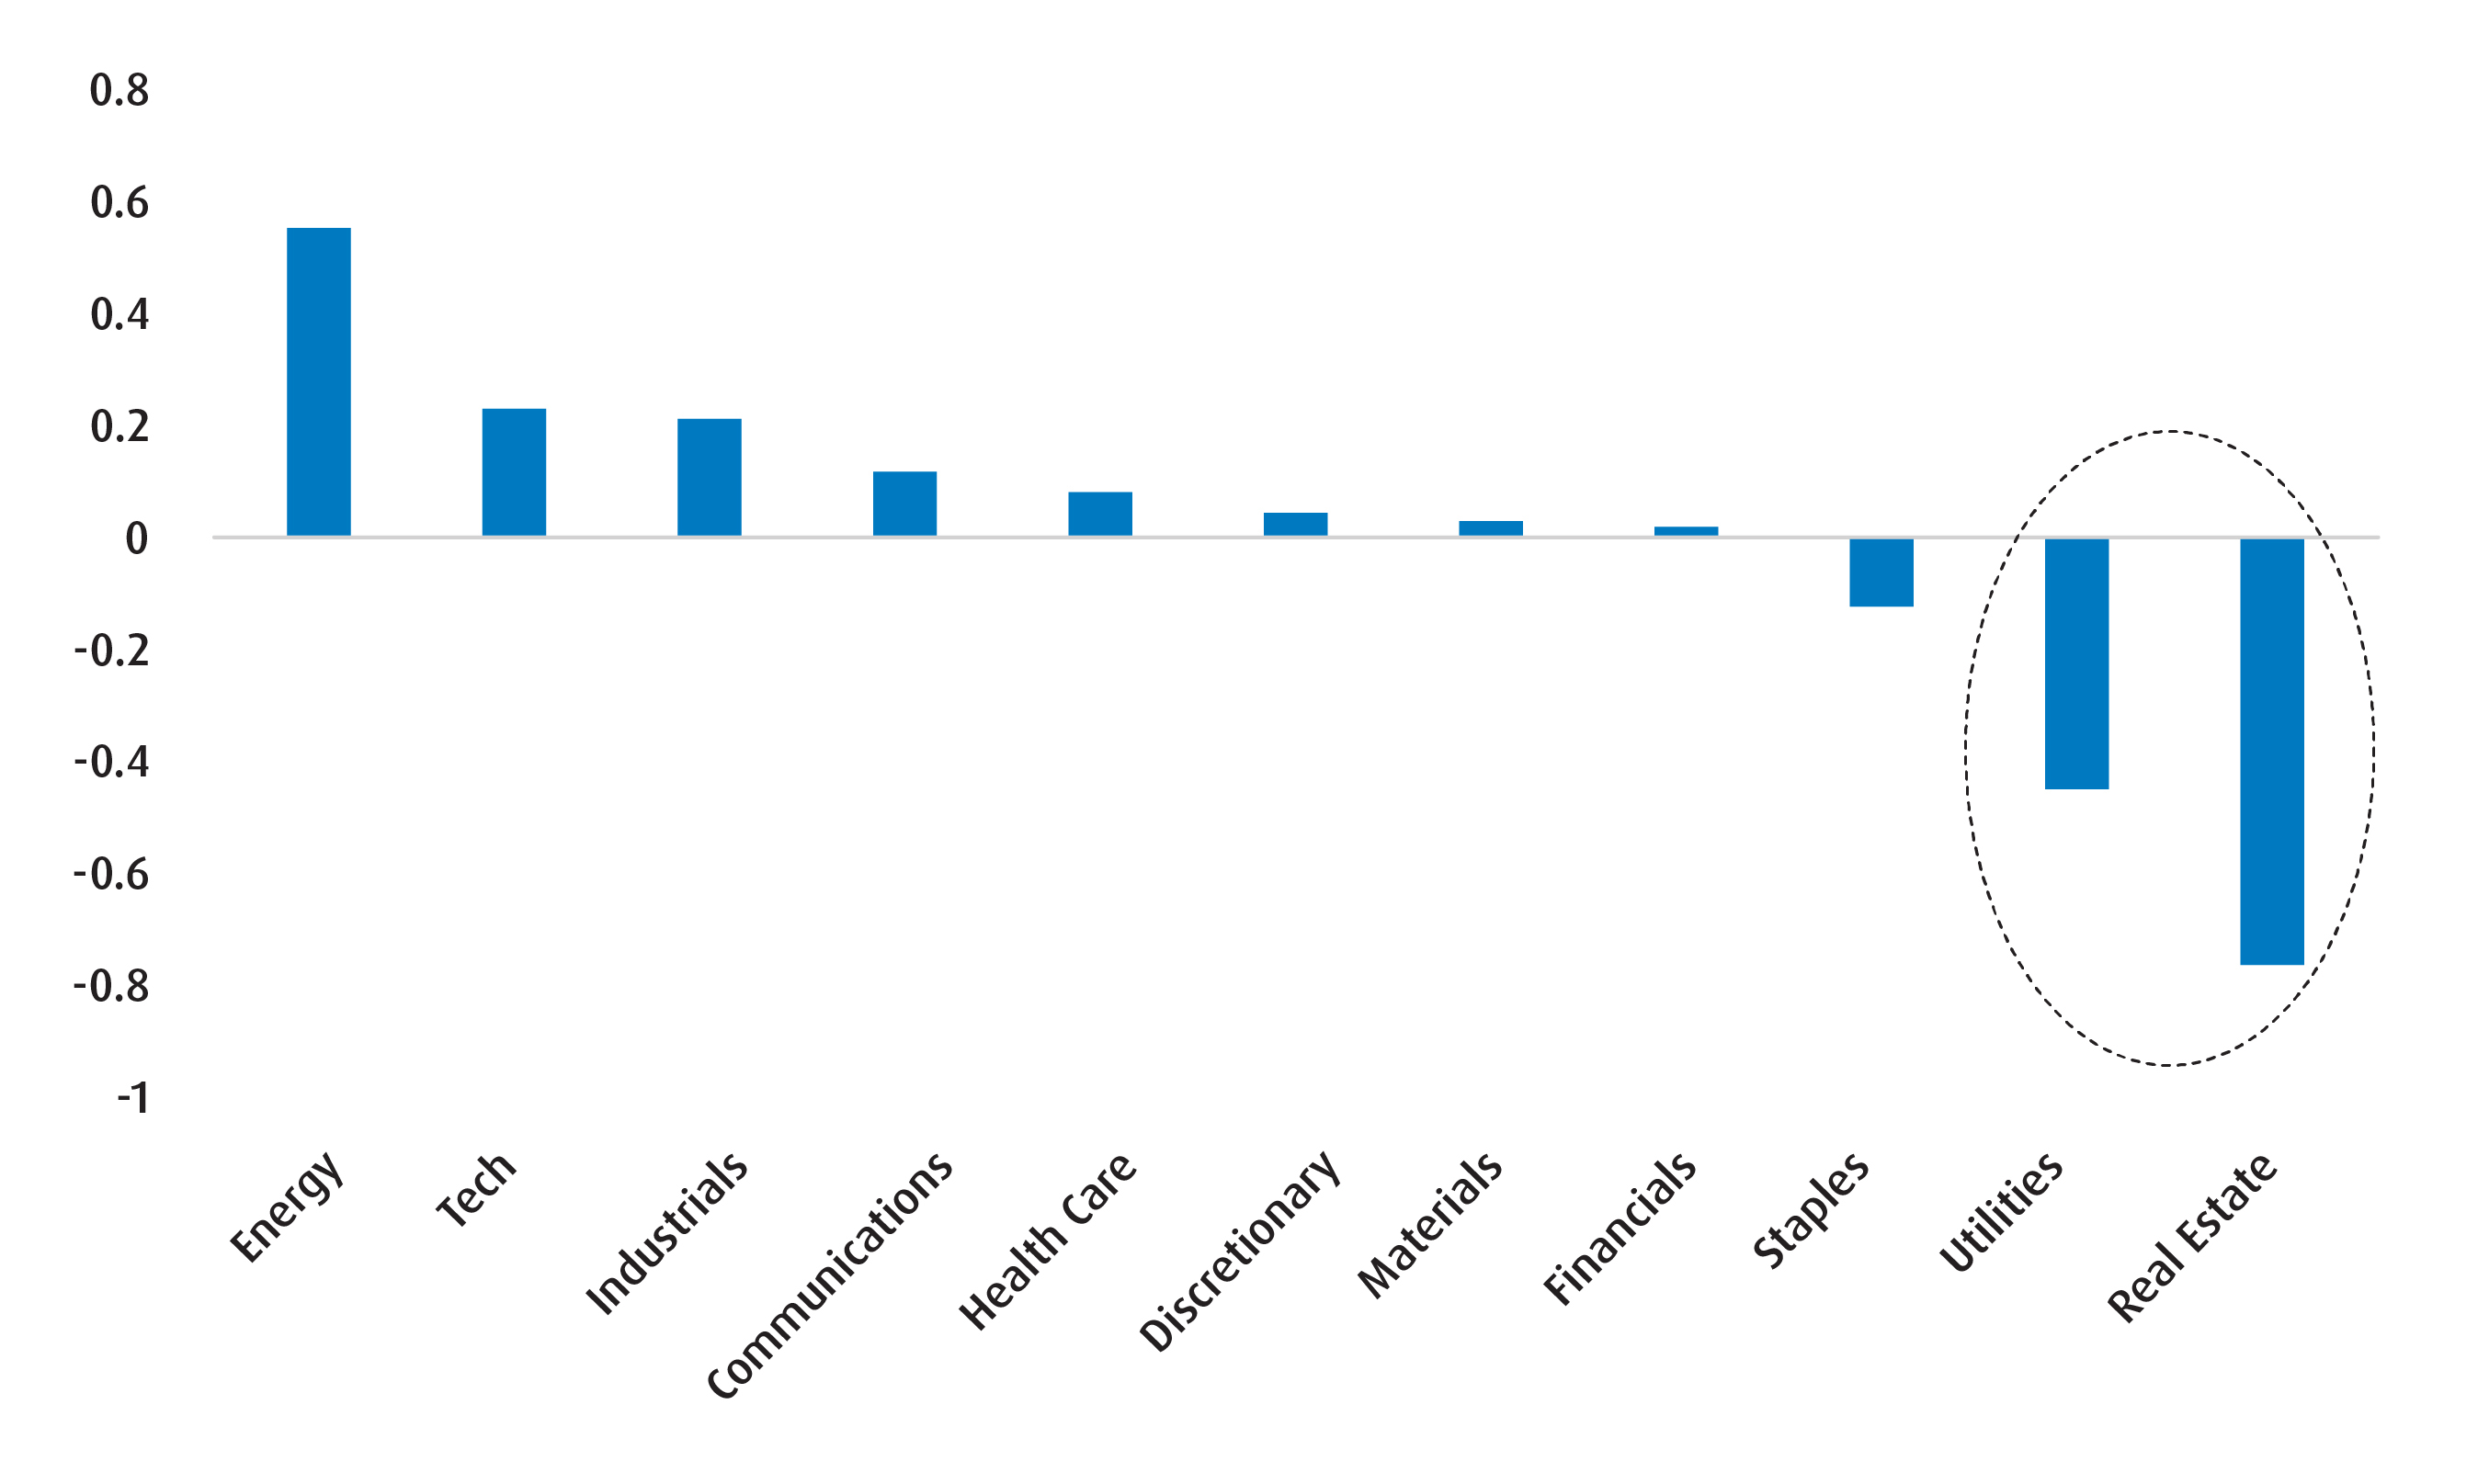
Weekly observations as of June 25, 2025. March 2022 was selected as the starting point given that also coincided with the start of the most recent Fed rate hike cycle. Source: Bloomberg, BMO Global Asset Management.
Chart 3 – BMO GAM S&P 500 sector portfolio for July
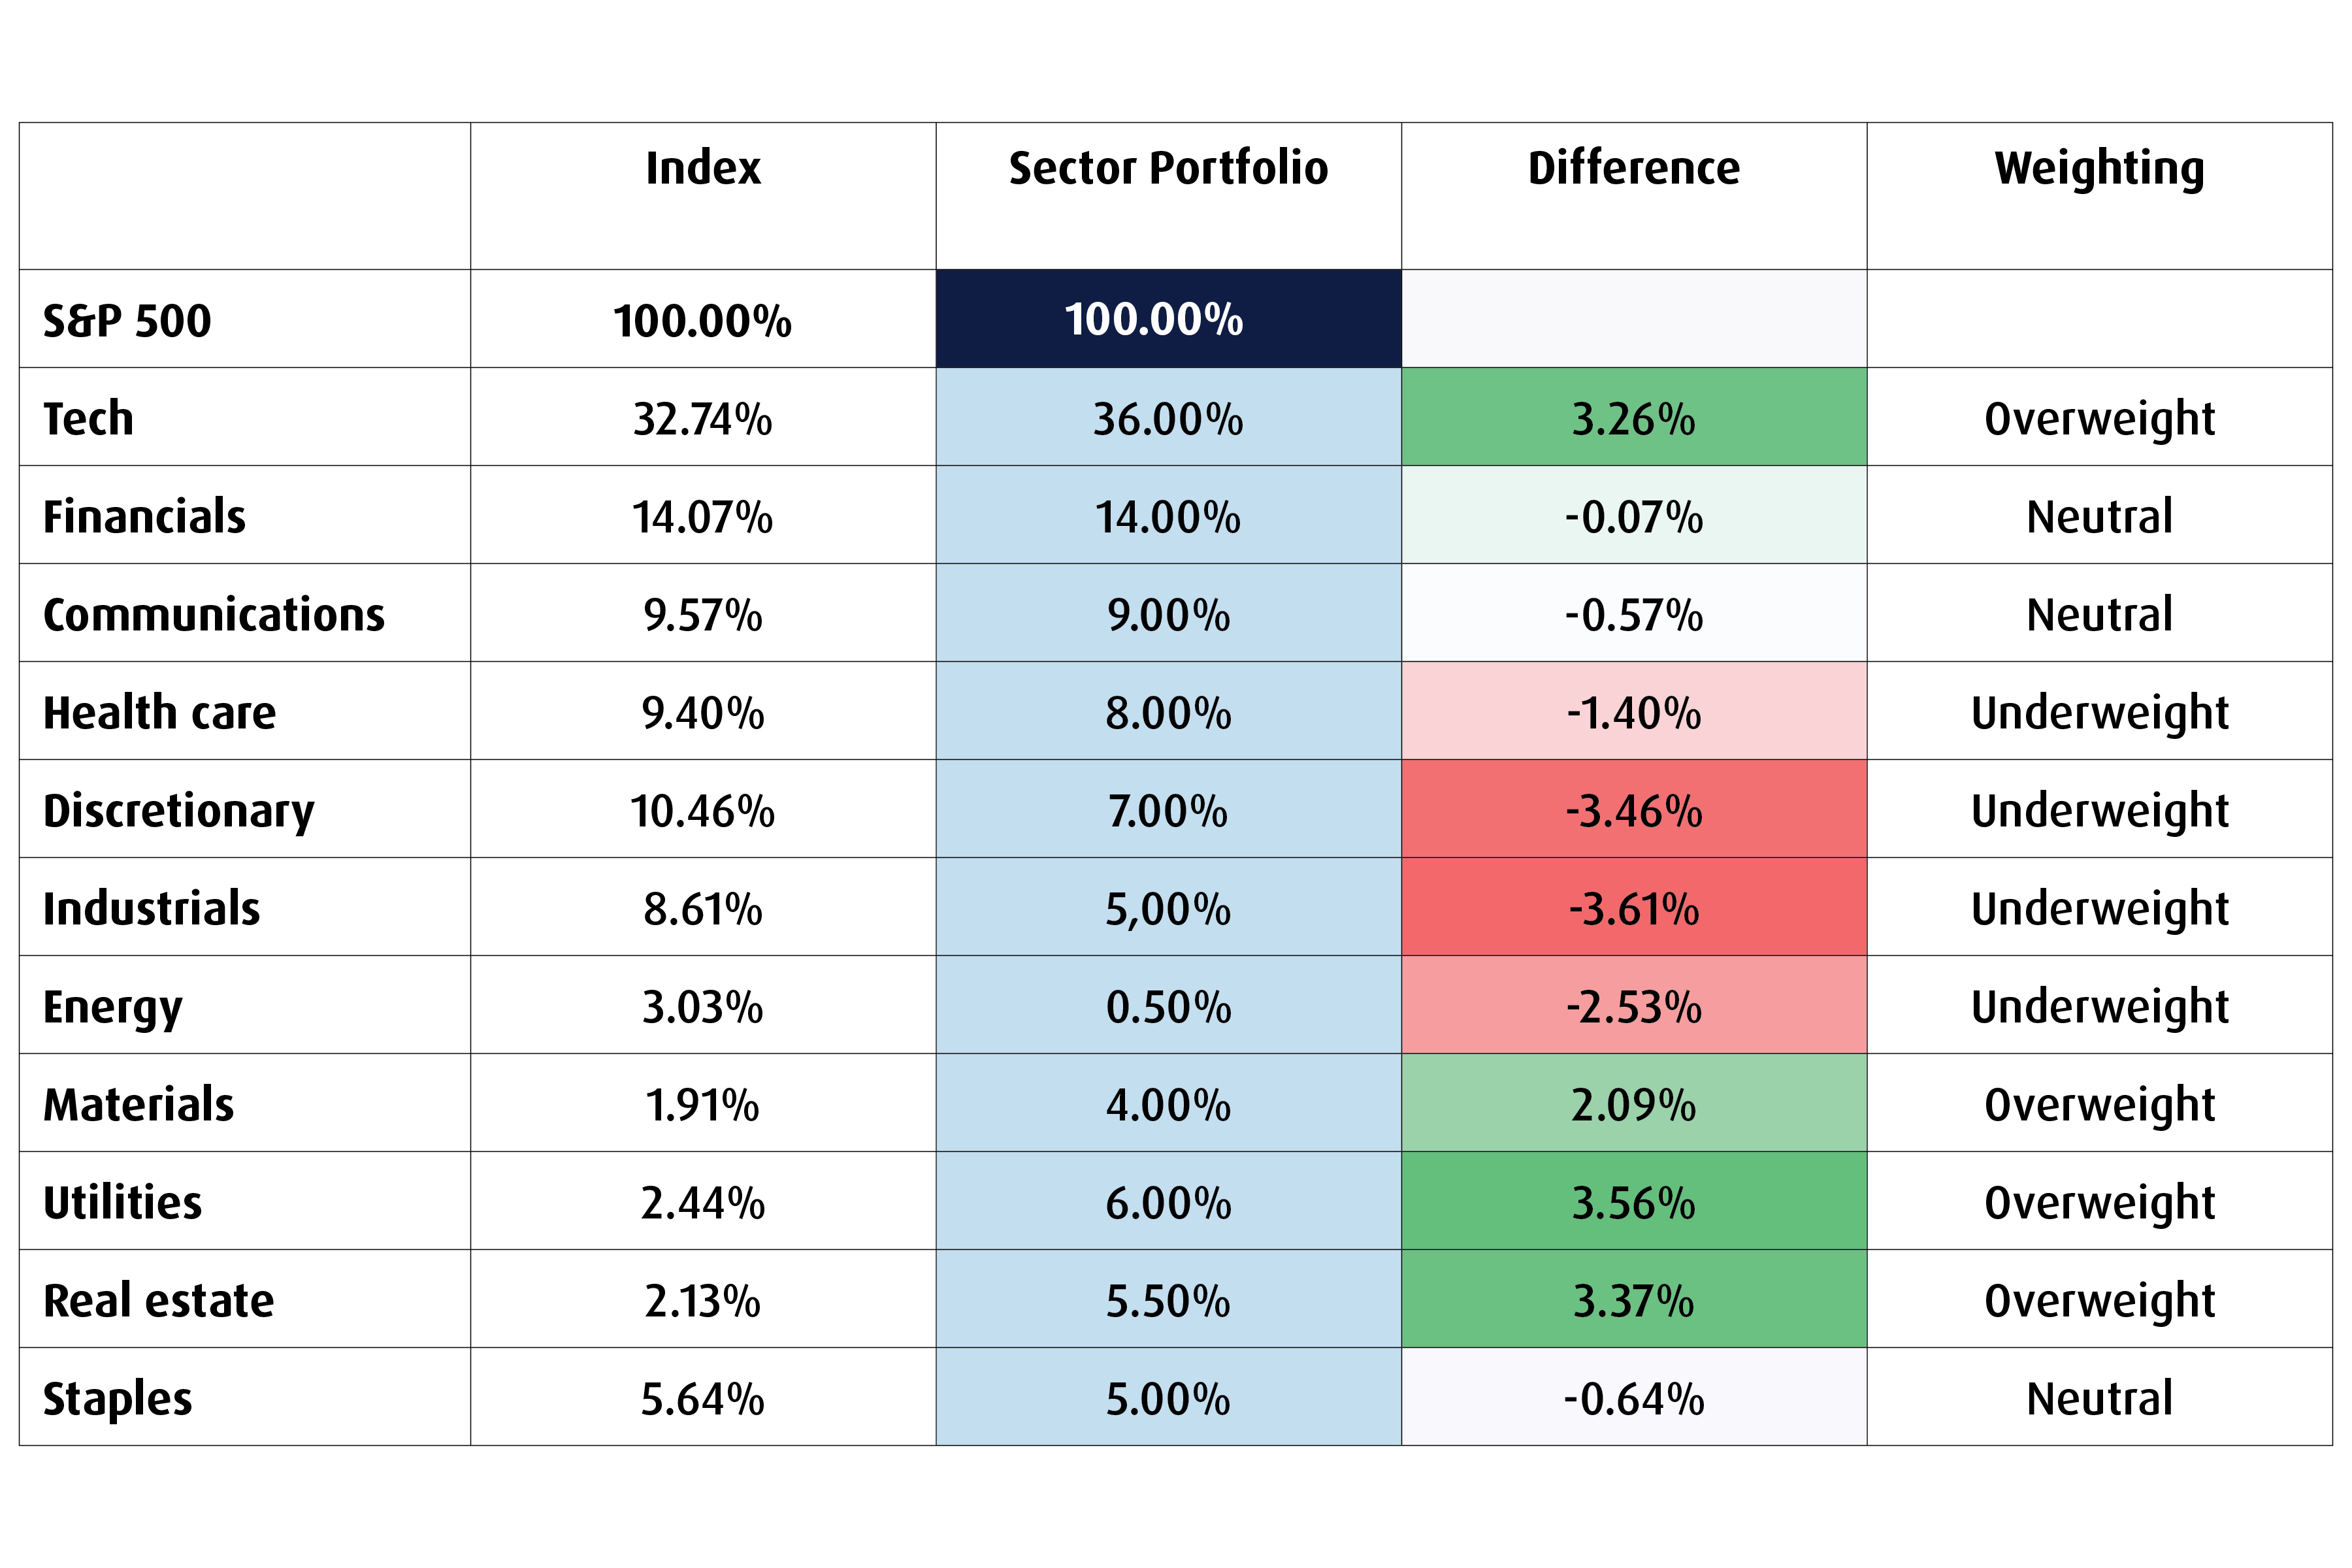
Source: BMO Global Asset Management. July 2025. For illustrative purposes only. Past performance is not indicative of future returns.
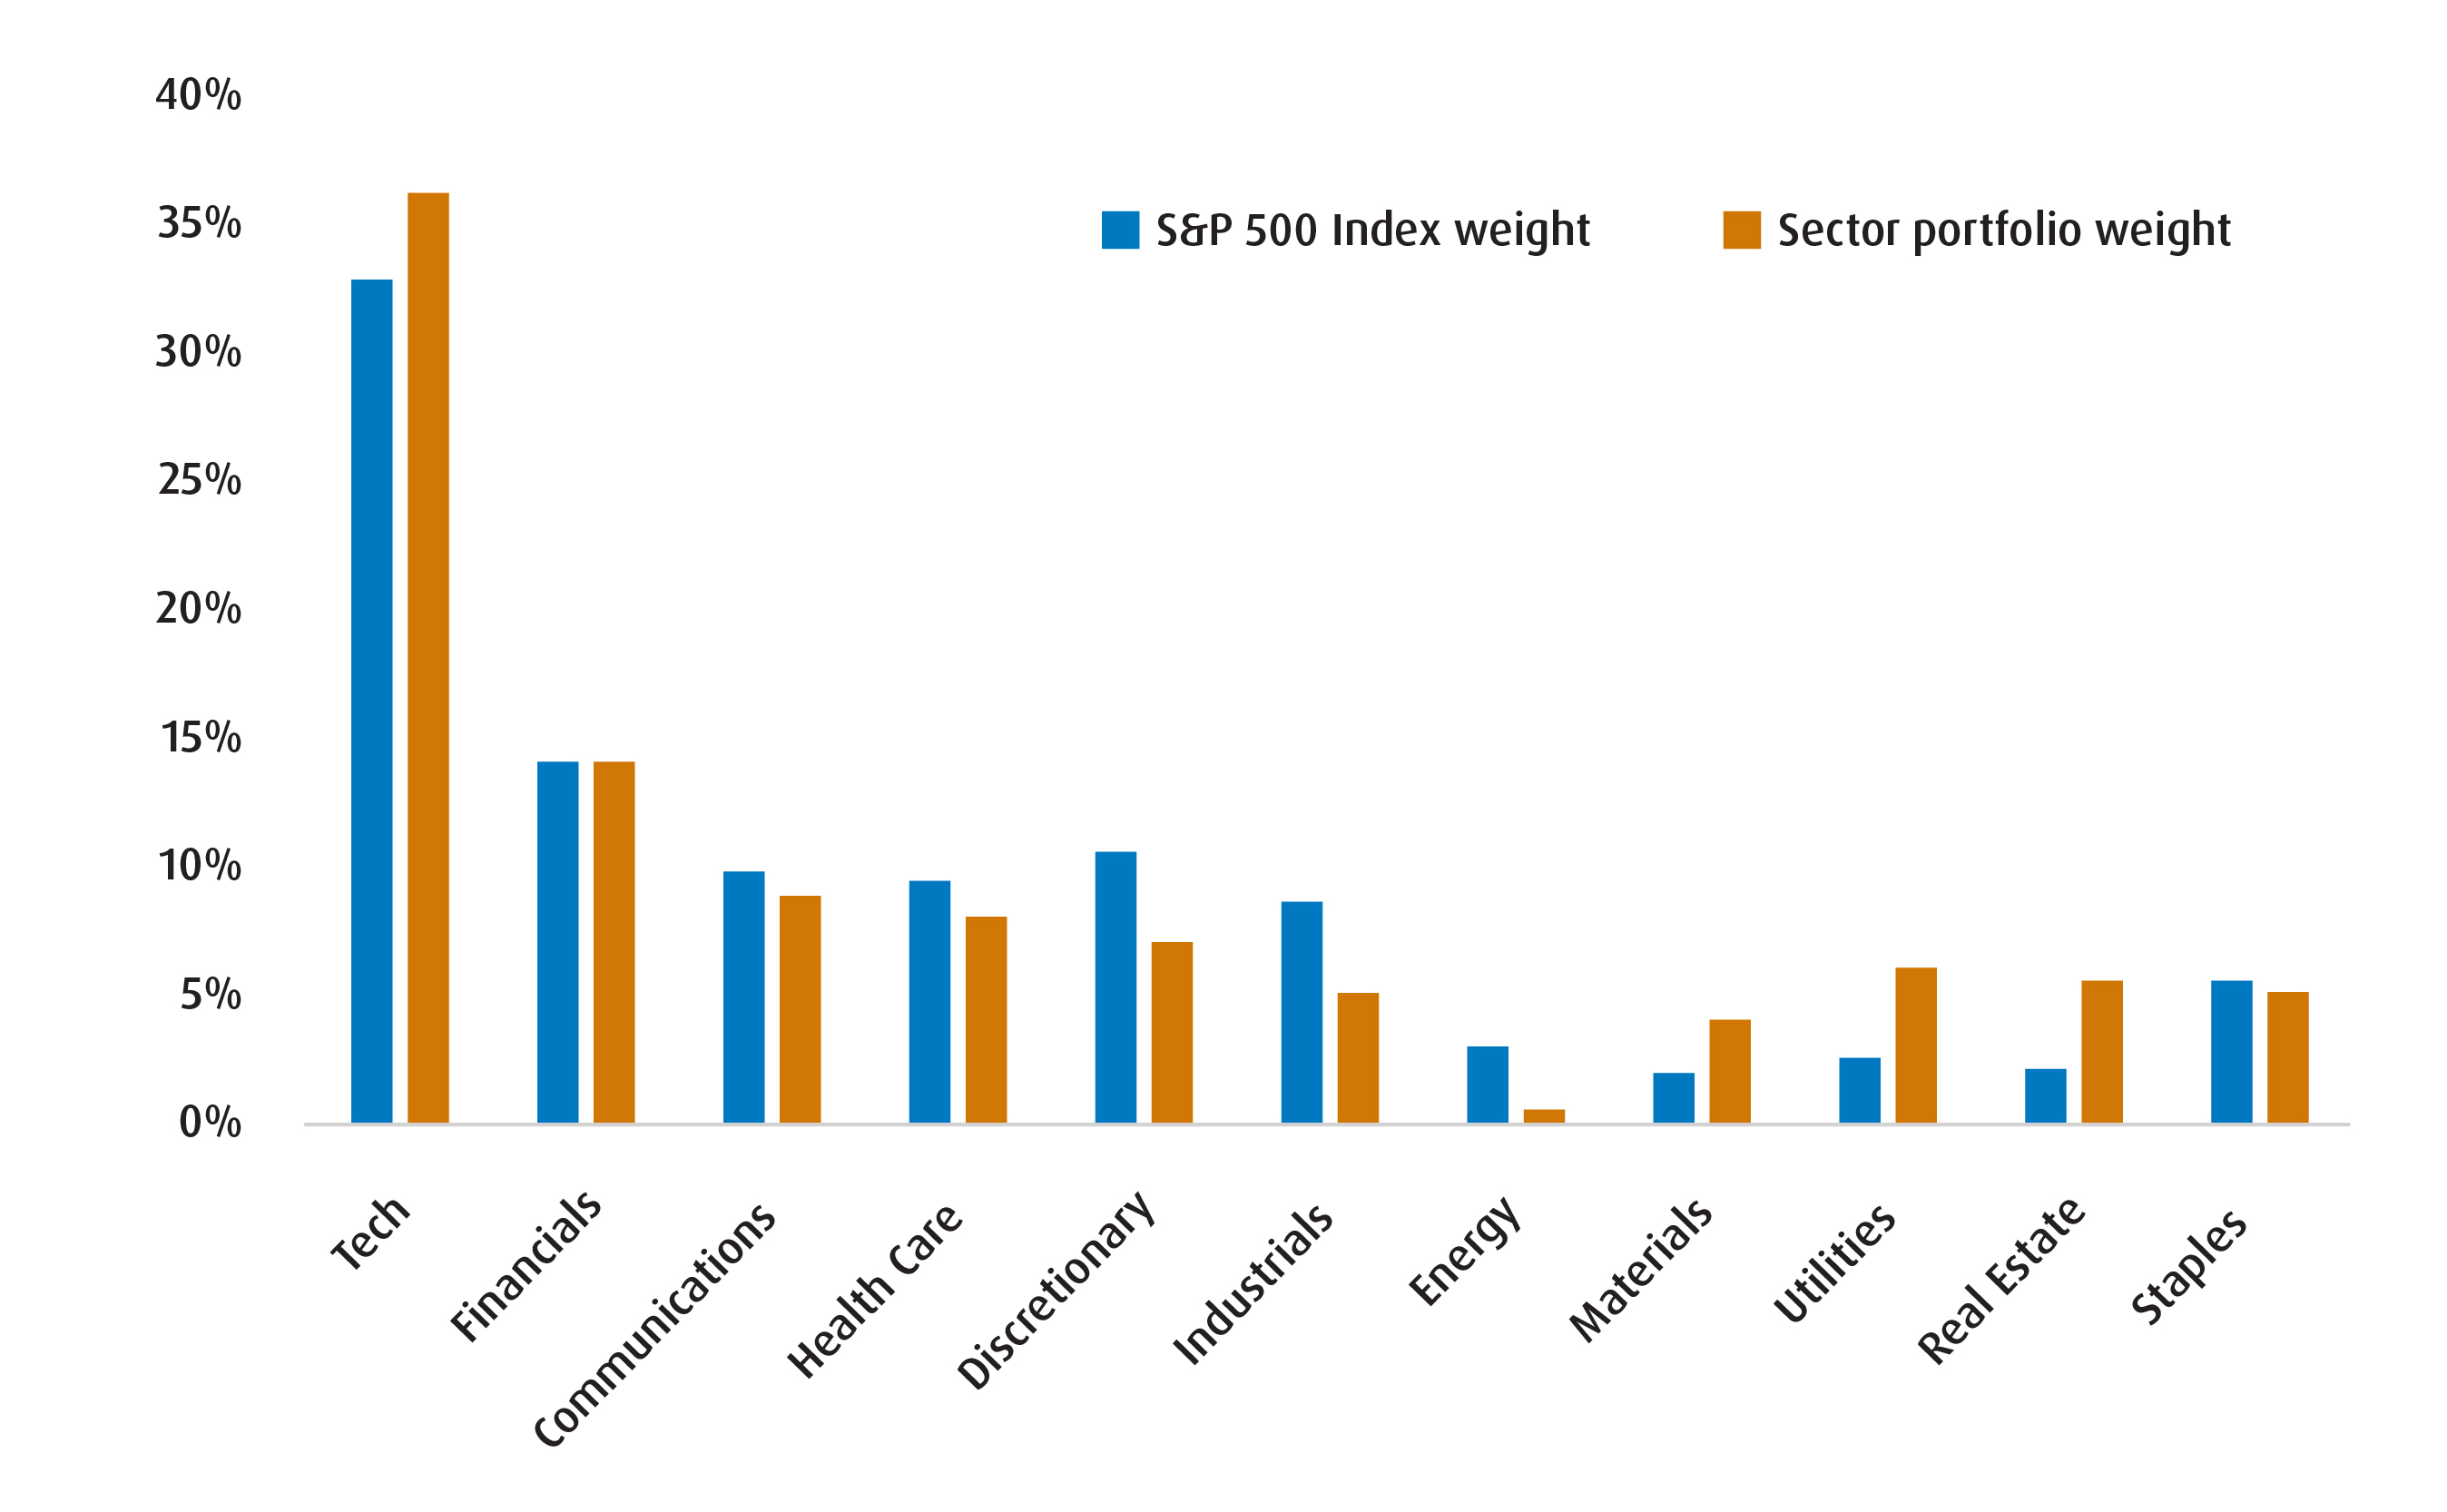
Source: BMO Global Asset Management. July 2025. For illustrative purposes only. Past performance is not indicative of future returns.
Chart 4 – Returns by sector
*MAVG = moving average. Source: BMO Global Asset Management/Bloomberg, as of June 24, 2025. For illustrative purposes only. Past performance is not indicative of future returns. The 50/100 day moving average is calculated by averaging the closing prices of a stock or asset over the past 50/100 trading days, and is used by analysts to identify trends. Green = more bullish signal. Red = more bearish signal.
Chart 5 – Earnings and valuation
Source: BMO Global Asset Management/Bloomberg. Y/Y = year over year. P/E refers to Price-to-Earnings Ratio, which analysts use as a valuation metric. The forward P/E ratio (or forward price-to-earnings ratio) divides the current share price of a company by the estimated future (“forward”) earnings per share (EPS) of that company. Z-Score is a measure of how much a data point varies from the average of the entire data set. A positive z-score says the data point is above average. A negative z-score says the data point is below average. The closer the Z-score is to zero, the closer the value is to the mean. As of June 24, 2025. For illustrative purposes only. Past performance is not indicative of future returns. Green = more bullish signal. Red = more bearish signal.
Chart 6 – Seasonality chart (average rank over past 35 years)
Source: BMO Global Asset Management/Bloomberg. As of June 24, 2025. For illustrative purposes only. Past performance is not indicative of future returns.
Chart 7 – BMO Global Asset Management quant model
Source: BMO Global Asset Management/Bloomberg. Note: Industry Rotation Score = a measure that uses momentum, disposition and growth as inputs to identify potential rotation opportunities. Scale is from -3 to +3, with the higher score indicating a more positive outlook. As of June 24, 2025. For illustrative purposes only. Past performance is not indicative of future returns.
For more market insights and commentary from BMO ETFs Strategist Bipan Rai, please visit and bookmark The Basis Point.
Performance (%)
Ticker |
Year-to-date |
1-month |
3-month |
6-month |
1-year |
3-year |
5-yea |
10-year |
Since inception |
ZXLU |
Returns are not available as there is less than one year’s performance data. |
||||||||
ZXLR |
|||||||||
ZXLK |
|||||||||
ZXLB |
|||||||||
Inception date for all ETFs was February 3, 2025.
For Advisor Use.
Any statement that necessarily depends on future events may be a forward-looking statement. Forward-looking statements are not guarantees of performance. They involve risks, uncertainties and assumptions. Although such statements are based on assumptions that are believed to be reasonable, there can be no assurance that actual results will not differ materially from expectations. Investors are cautioned not to rely unduly on any forward-looking statements. In connection with any forward-looking statements, investors should carefully consider the areas of risk described in the most recent prospectus.
This is for information purposes only. The information contained herein is not, and should not be construed as investment, tax or legal advice to any party. Particular investments and/or trading strategies should be evaluated relative to the individual’s investment objectives and professional advice should be obtained with respect to any circumstance.
The viewpoints expressed by the author represents their assessment of the markets at the time of publication. Those views are subject to change without notice at any time. The information provided herein does not constitute a solicitation of an offer to buy, or an offer to sell securities nor should the information be relied upon as investment advice. Past performance is no guarantee of future results. This communication is intended for informational purposes only.
You cannot invest directly in an index.
Sector ETF products are also subject to sector risk and non-diversification risk, which generally will result in greater price fluctuations than the overall market.
The Select Sector SPDR Trust consists of eleven separate investment portfolios (each a“Select Sector SPDR ETF” or an“ETF” and collectively the“Select Sector SPDR ETFs” or the“ETFs”). Each Select Sector SPDR ETF is an“index fund” that invests in a particular sector or group of industries represented by a specified Select Sector Index. The companies included in each Select Sector Index are selected on the basis of general industry classification from a universe of companies defined by the S&P 500®. The investment objective of each ETF is to provide investment results that, before expenses, correspond generally to the price and yield performance of publicly traded equity securities of companies in a particular sector or group of industries, as represented by a specified market sector index.
The S&P 500, SPDRs, and Select Sector SPDRs are trademarks of The McGraw-Hill Companies, Inc. and have been licensed for use. The stocks included in each Select Sector Index were selected by the compilation agent. Their composition and weighting can be expected to differ to that in any similar indexes that are published by S&P.
The S&P 500 Index is an unmanaged index of 500 common stocks that is generally considered representative of the U.S. stock market. The index is heavily weighted toward stocks with large market capitalizations and represents approximately two-thirds of the total market value of all domestic common stocks. The S&P 500 Index figures do not reflect any fees, expenses or taxes. An investor should consider investment objectives, risks, fees and expenses before investing.
Commissions, management fees and expenses all may be associated with investments in exchange traded funds. Please read the ETF Facts or prospectus of the BMO ETFs before investing. Exchange traded funds are not guaranteed, their values change frequently and past performance may not be repeated.
For a summary of the risks of an investment in the BMO ETFs, please see the specific risks set out in the prospectus. BMO ETFs trade like stocks, fluctuate in market value and may trade at a discount to their net asset value, which may increase the risk of loss. Distributions are not guaranteed and are subject to change and/or elimination.
BMO ETFs are managed by BMO Asset Management Inc., which is an investment fund manager and a portfolio manager, and a separate legal entity from Bank of Montreal.
BMO Global Asset Management is a brand name under which BMO Asset Management Inc. and BMO Investments Inc. operate.
“BMO (M-bar roundel symbol)” is a registered trademark of Bank of Montreal, used under licence.