Sectors Portfolio: Full of Surprises


- Q2 2026 earnings season is in full swing, and it has been full of positive surprises, reinforcing the resilience of the US equities. With roughly 60% of the S&P 500 having reported, 86% of the companies have delivered positive earnings surprise which is above the 5-year average of 78%. Despite higher yields in the long-end, earnings continue to surprise to the upside, reflecting an economy that remains stronger than expected.
- The biggest surprises are still coming from familiar names. Amazon and Alphabet have each delivered earnings surprises of roughly 214%, driving much of the earnings strength in Consumer Discretionary and Communication Services, respectively. Despite this, they also highlight that market leadership remains concentrated in a few names. Meanwhile, Real Estate has emerged as the weakest sector this earnings season (Chart 2).
- Not all surprises have come from Big Tech. One of the more notable developments this earnings season has been the resilience of the Financials. The combination of improving fundamentals, reasonable valuations, and a strong capital markets backdrop leaves the sector well positioned.
- While AI-related demand continues to anchor tech sector performance, forward 12-month earnings expectations declined modestly over the past month following an extended period of upgrades. Valuations remain below long-term norms, and leverage ratios continue to show healthy balance sheets, suggesting the sector still has fundamental support.
- The energy sector continues to screen as one of the strongest sectors for expected earnings growth, yet recent months have highlighted how quickly sentiment can shift as geopolitical risk premiums rise and fall. While earnings support remains robust, the sector’s outlook is less predictable than other sectors, justifying a neutral stance.
- Earnings momentum in the Materials sector has slowed since last month. With that in mind, we are reducing our weight slightly.
- Industrials continue to benefit from long-term structural themes, but valuations are becoming difficult to ignore. Exposure to AI infrastructure, electrification, automation and reshoring remains a powerful tailwind for the sector. However, much of that optimism is already reflected in current valuations. We continue to stay constructive, but the risk-reward is less compelling after a strong period of outperformance, keeping our positioning neutral.
- We remain more cautious on the defensive sectors. Healthcare has recovered sharply, but valuations have moved well above historical norms while earnings revisions have softened. Consumer Staples, Utilities and Real Estate continue to face a combination of slower growth, elevated financing costs and weaker earnings momentum.
- For the portfolio: We are making the following changes:
- Financials: Our position is overweight, as we remain constructive.
- Healthcare: Our position is neutral. We are trimming our weight relative to last month.
- Discretionary: Our position is still neutral, but weight is slightly higher than last month to be in line with index weight.
- Industrials: Our position is still neutral, but weight is slightly higher than last month to be in line with index weight.
- Materials: Our position is still overweight, but weight is lower than last month.
- Staples: Our position is still neutral, but weight is slightly lower than last month.
Sectors in focus:
- Financials (BMO SPDR Financials Select Sector Index ETF – ZXLF)
- Health Care (BMO SPDR Health Care Select Sector Index ETF – ZXLV)
- Industrials (BMO SPDR Industrials Select Sector Index ETF – ZXLI)
- Materials (BMO SPDR Materials Select Sector Index ETF -ZXLB)
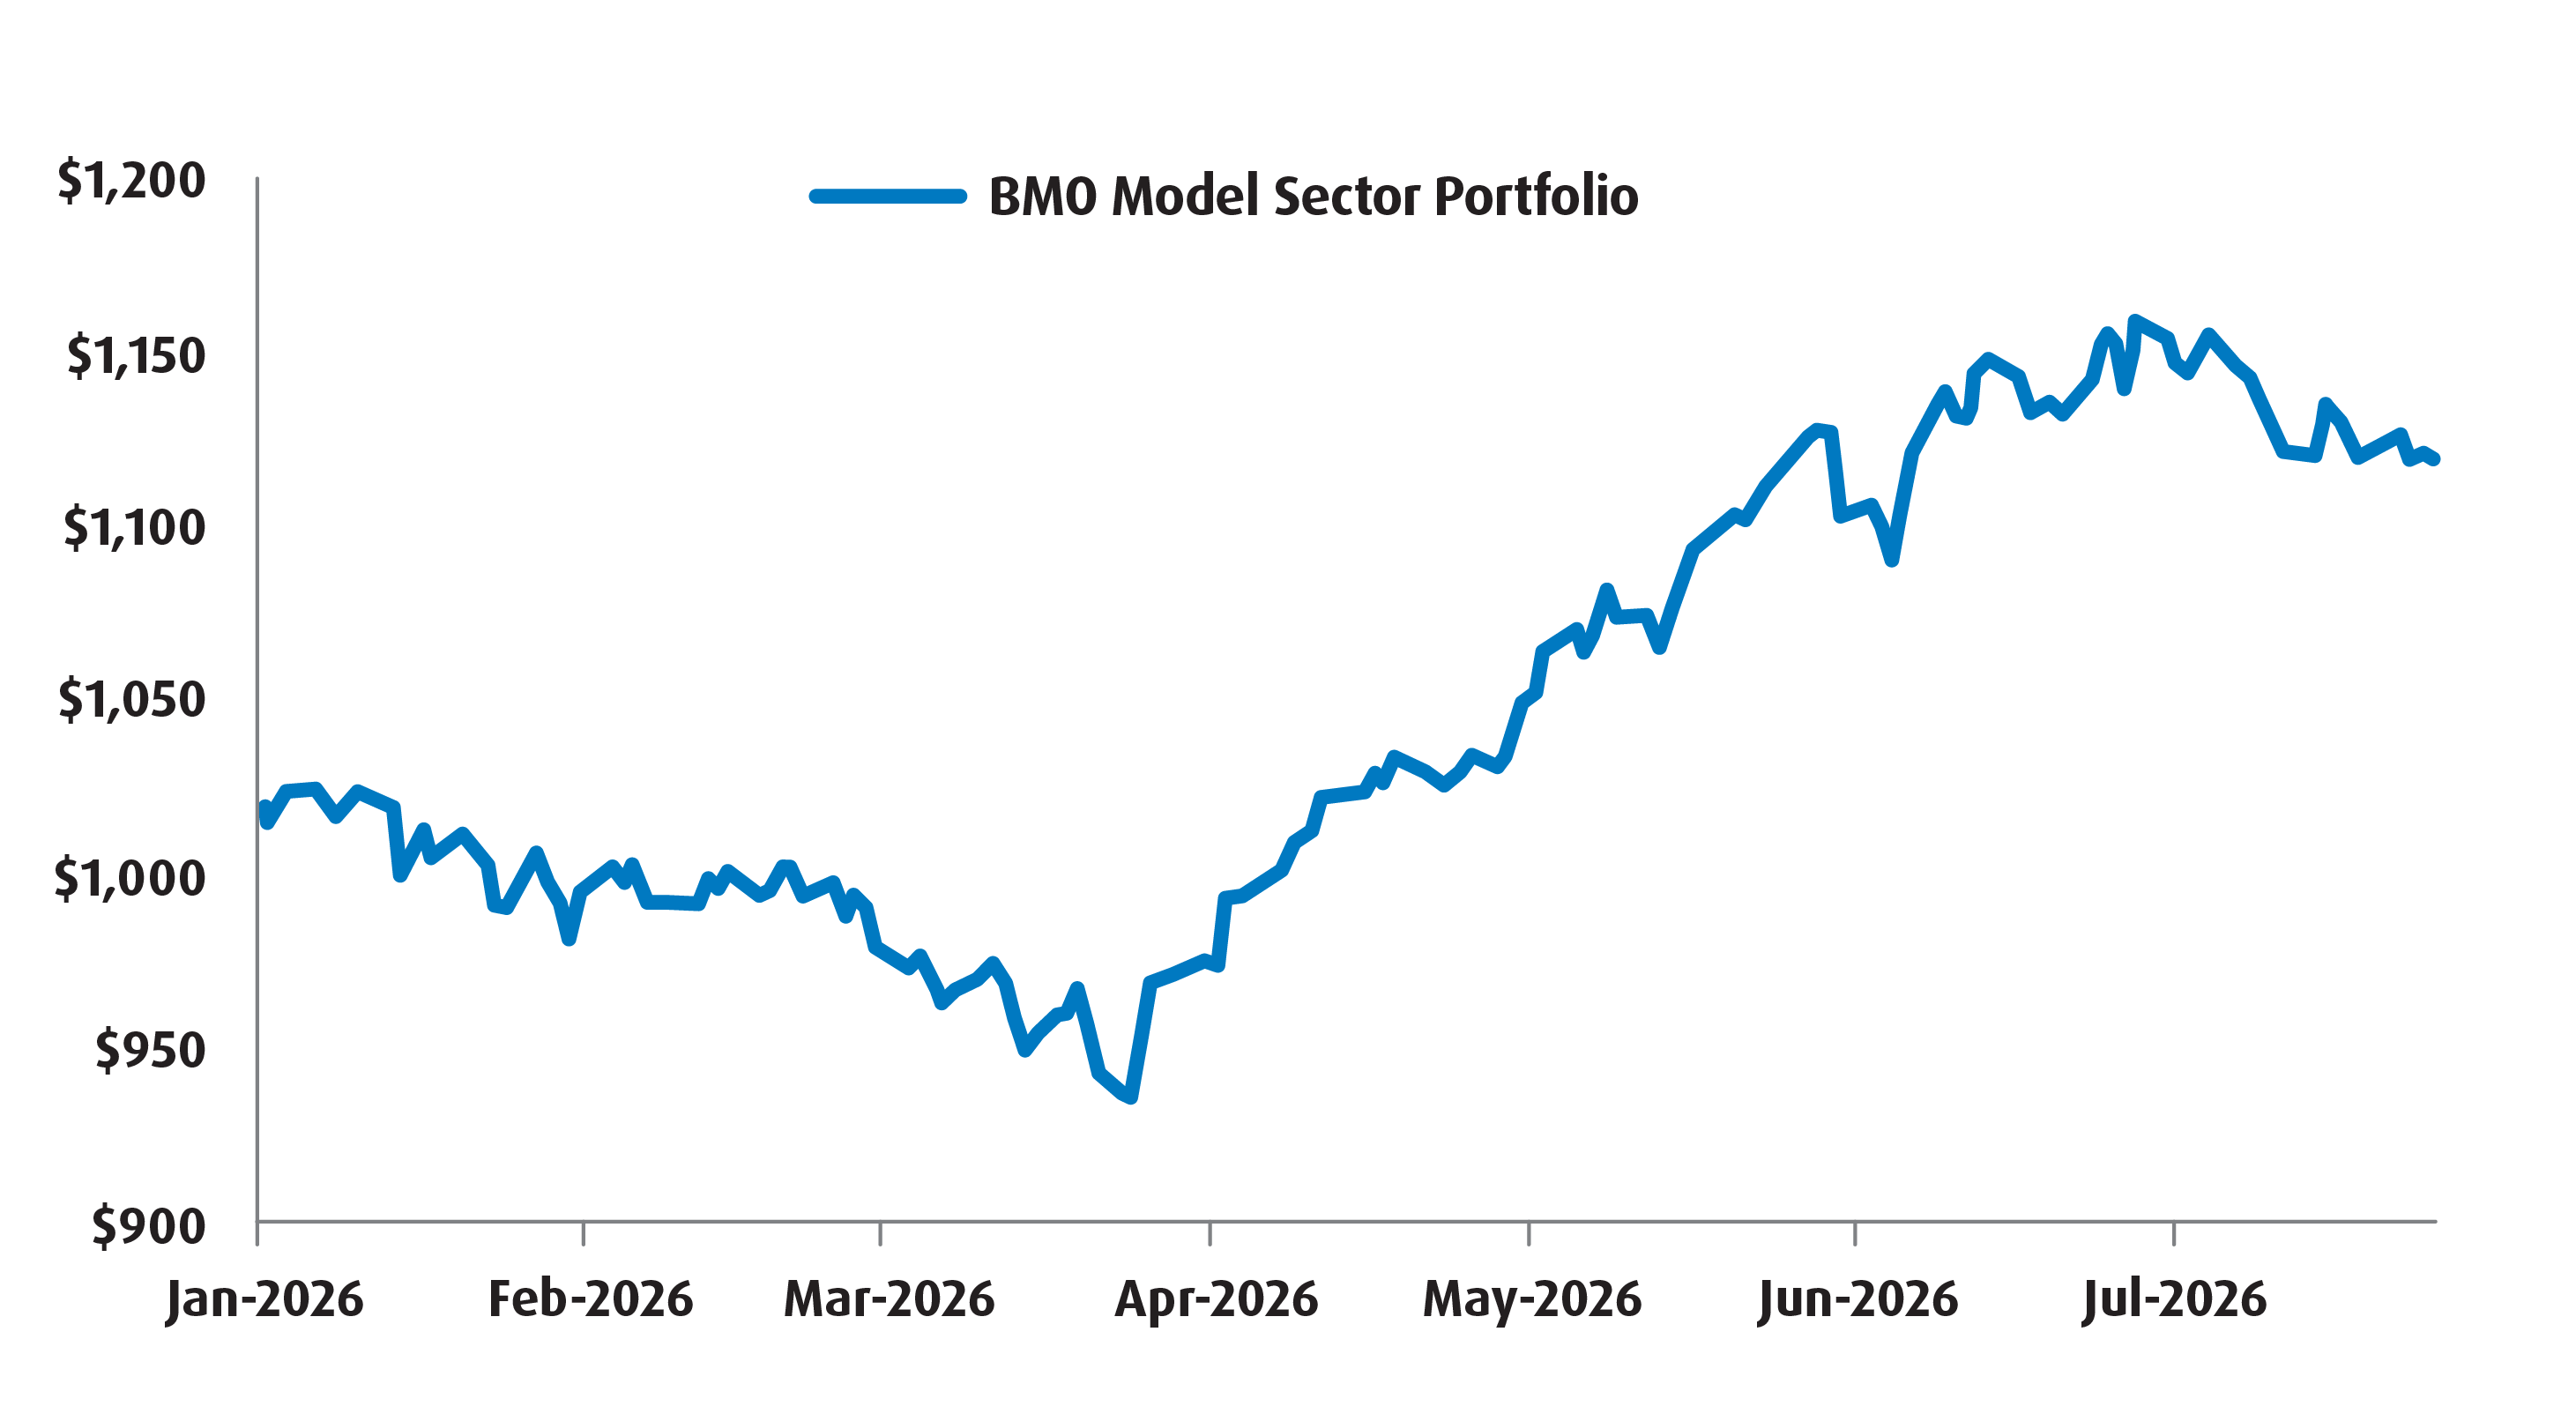
Please see Chart 4 below for the monthly performance and refer to Chart 5 for the monthly tactical changes in the model BMO Sector Model Portfolio.
Chart 1 – Sector Total Performance Chart
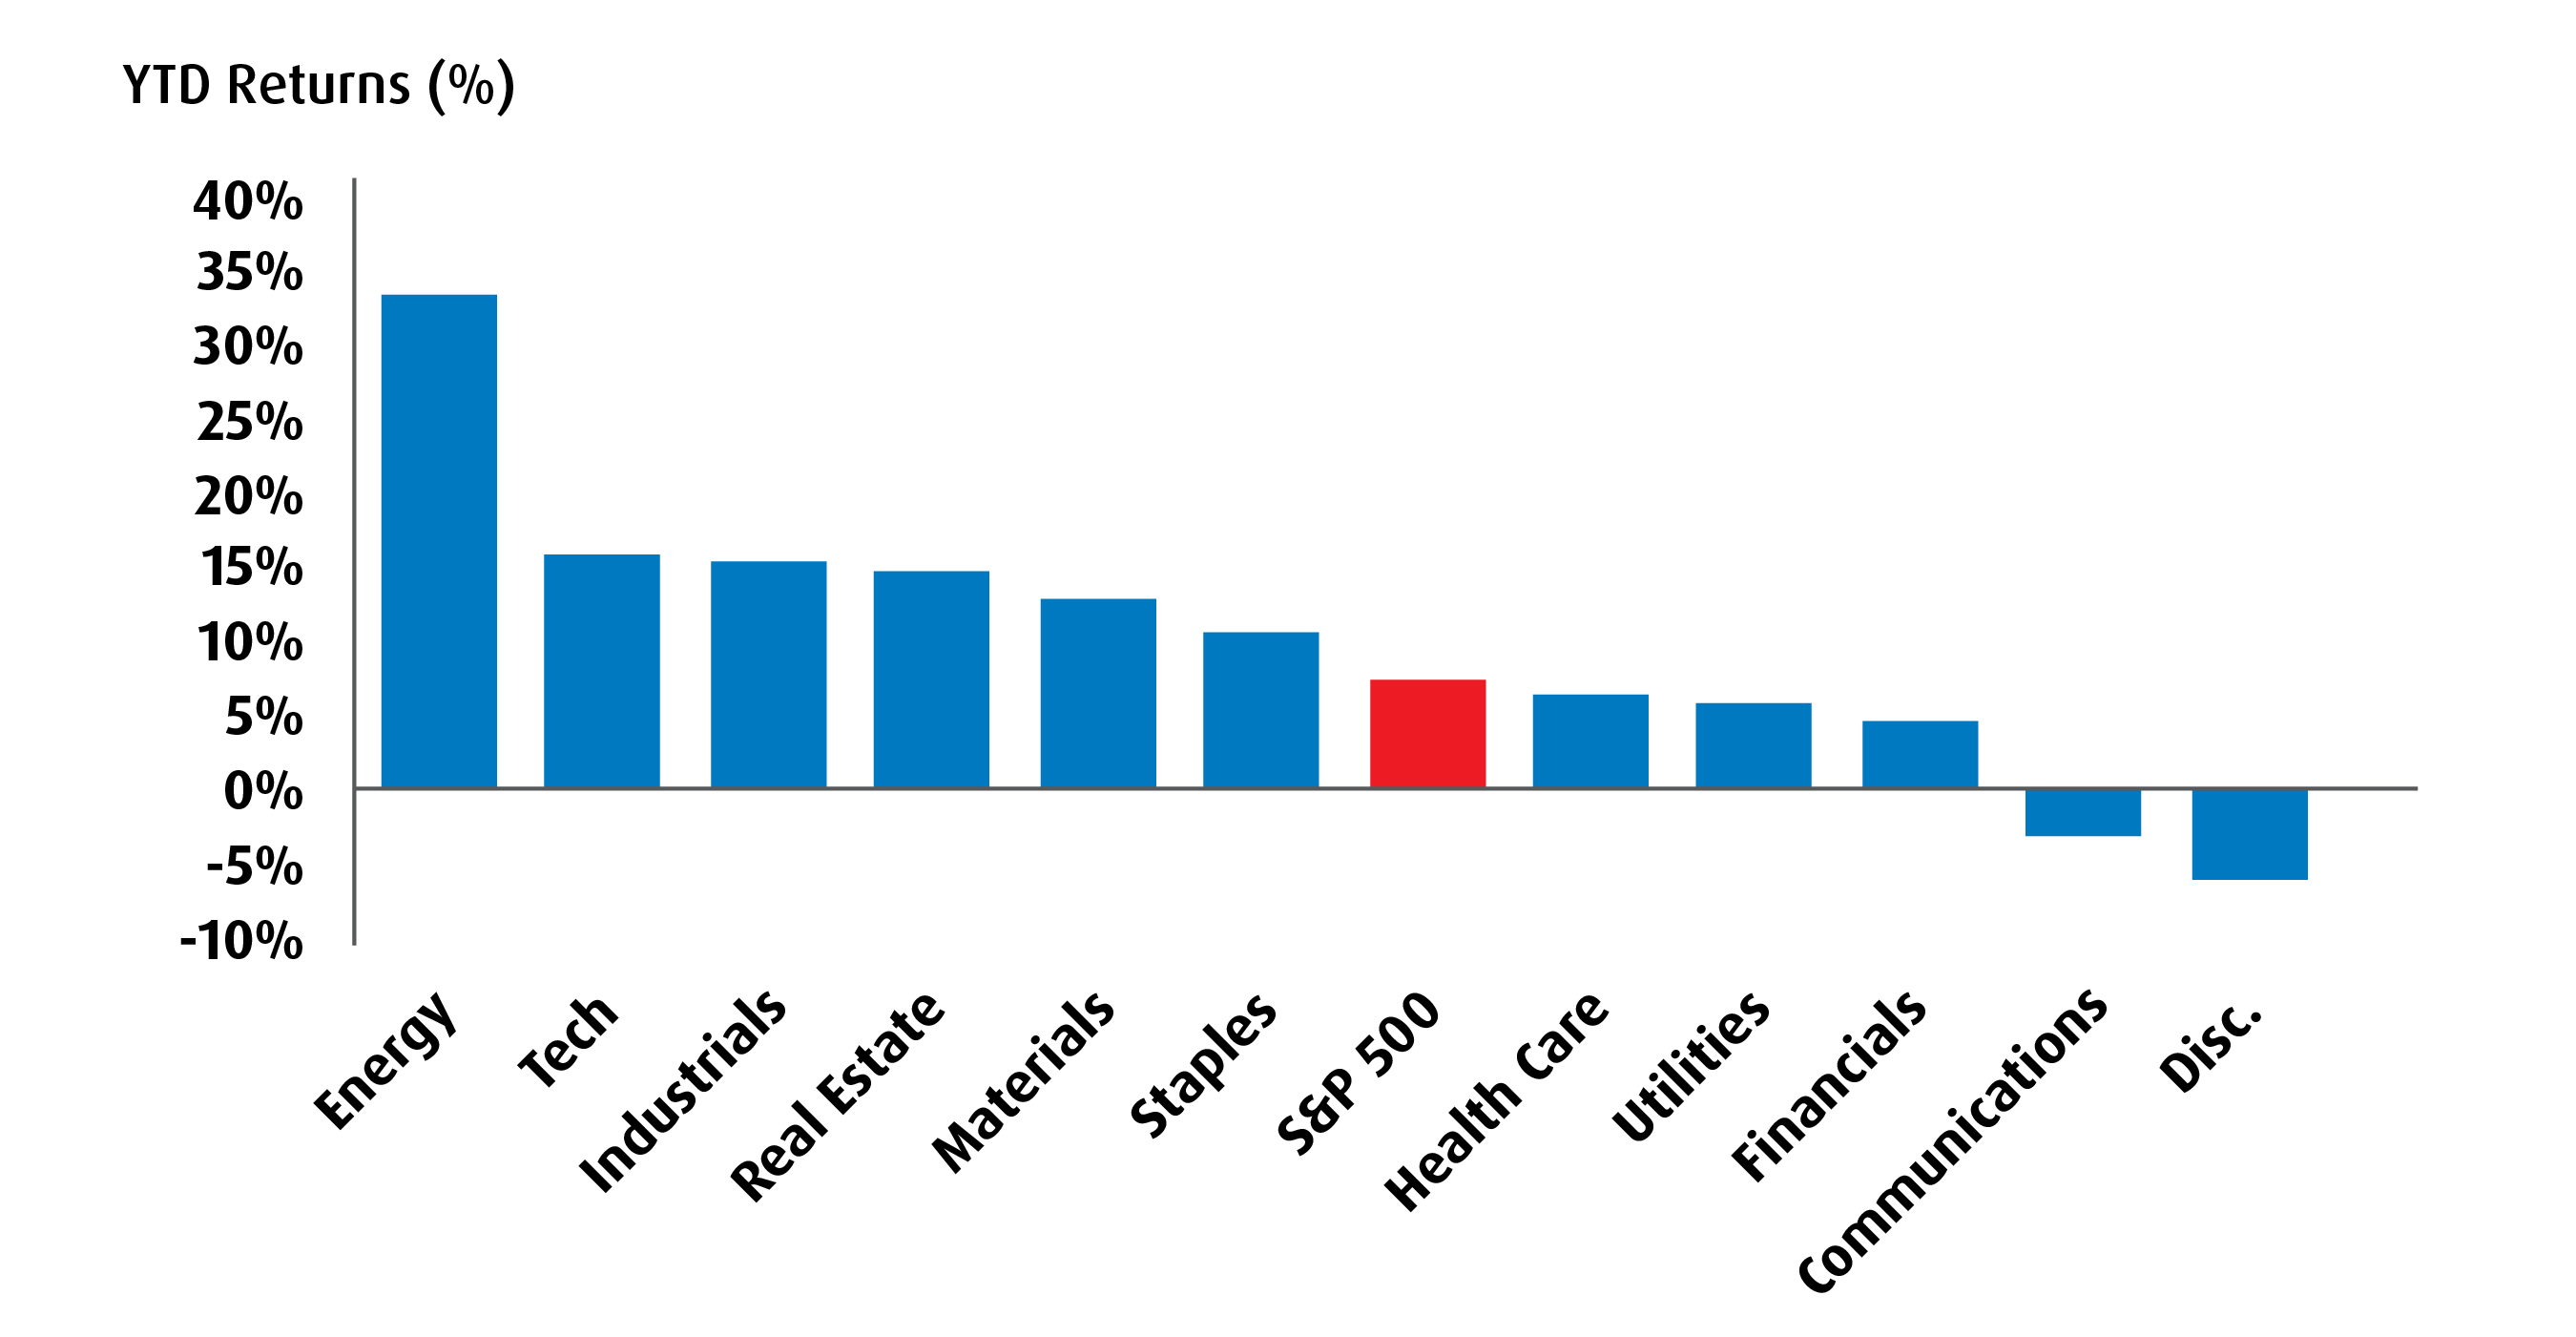
Chart 2 – Earnings Surprise by Sector
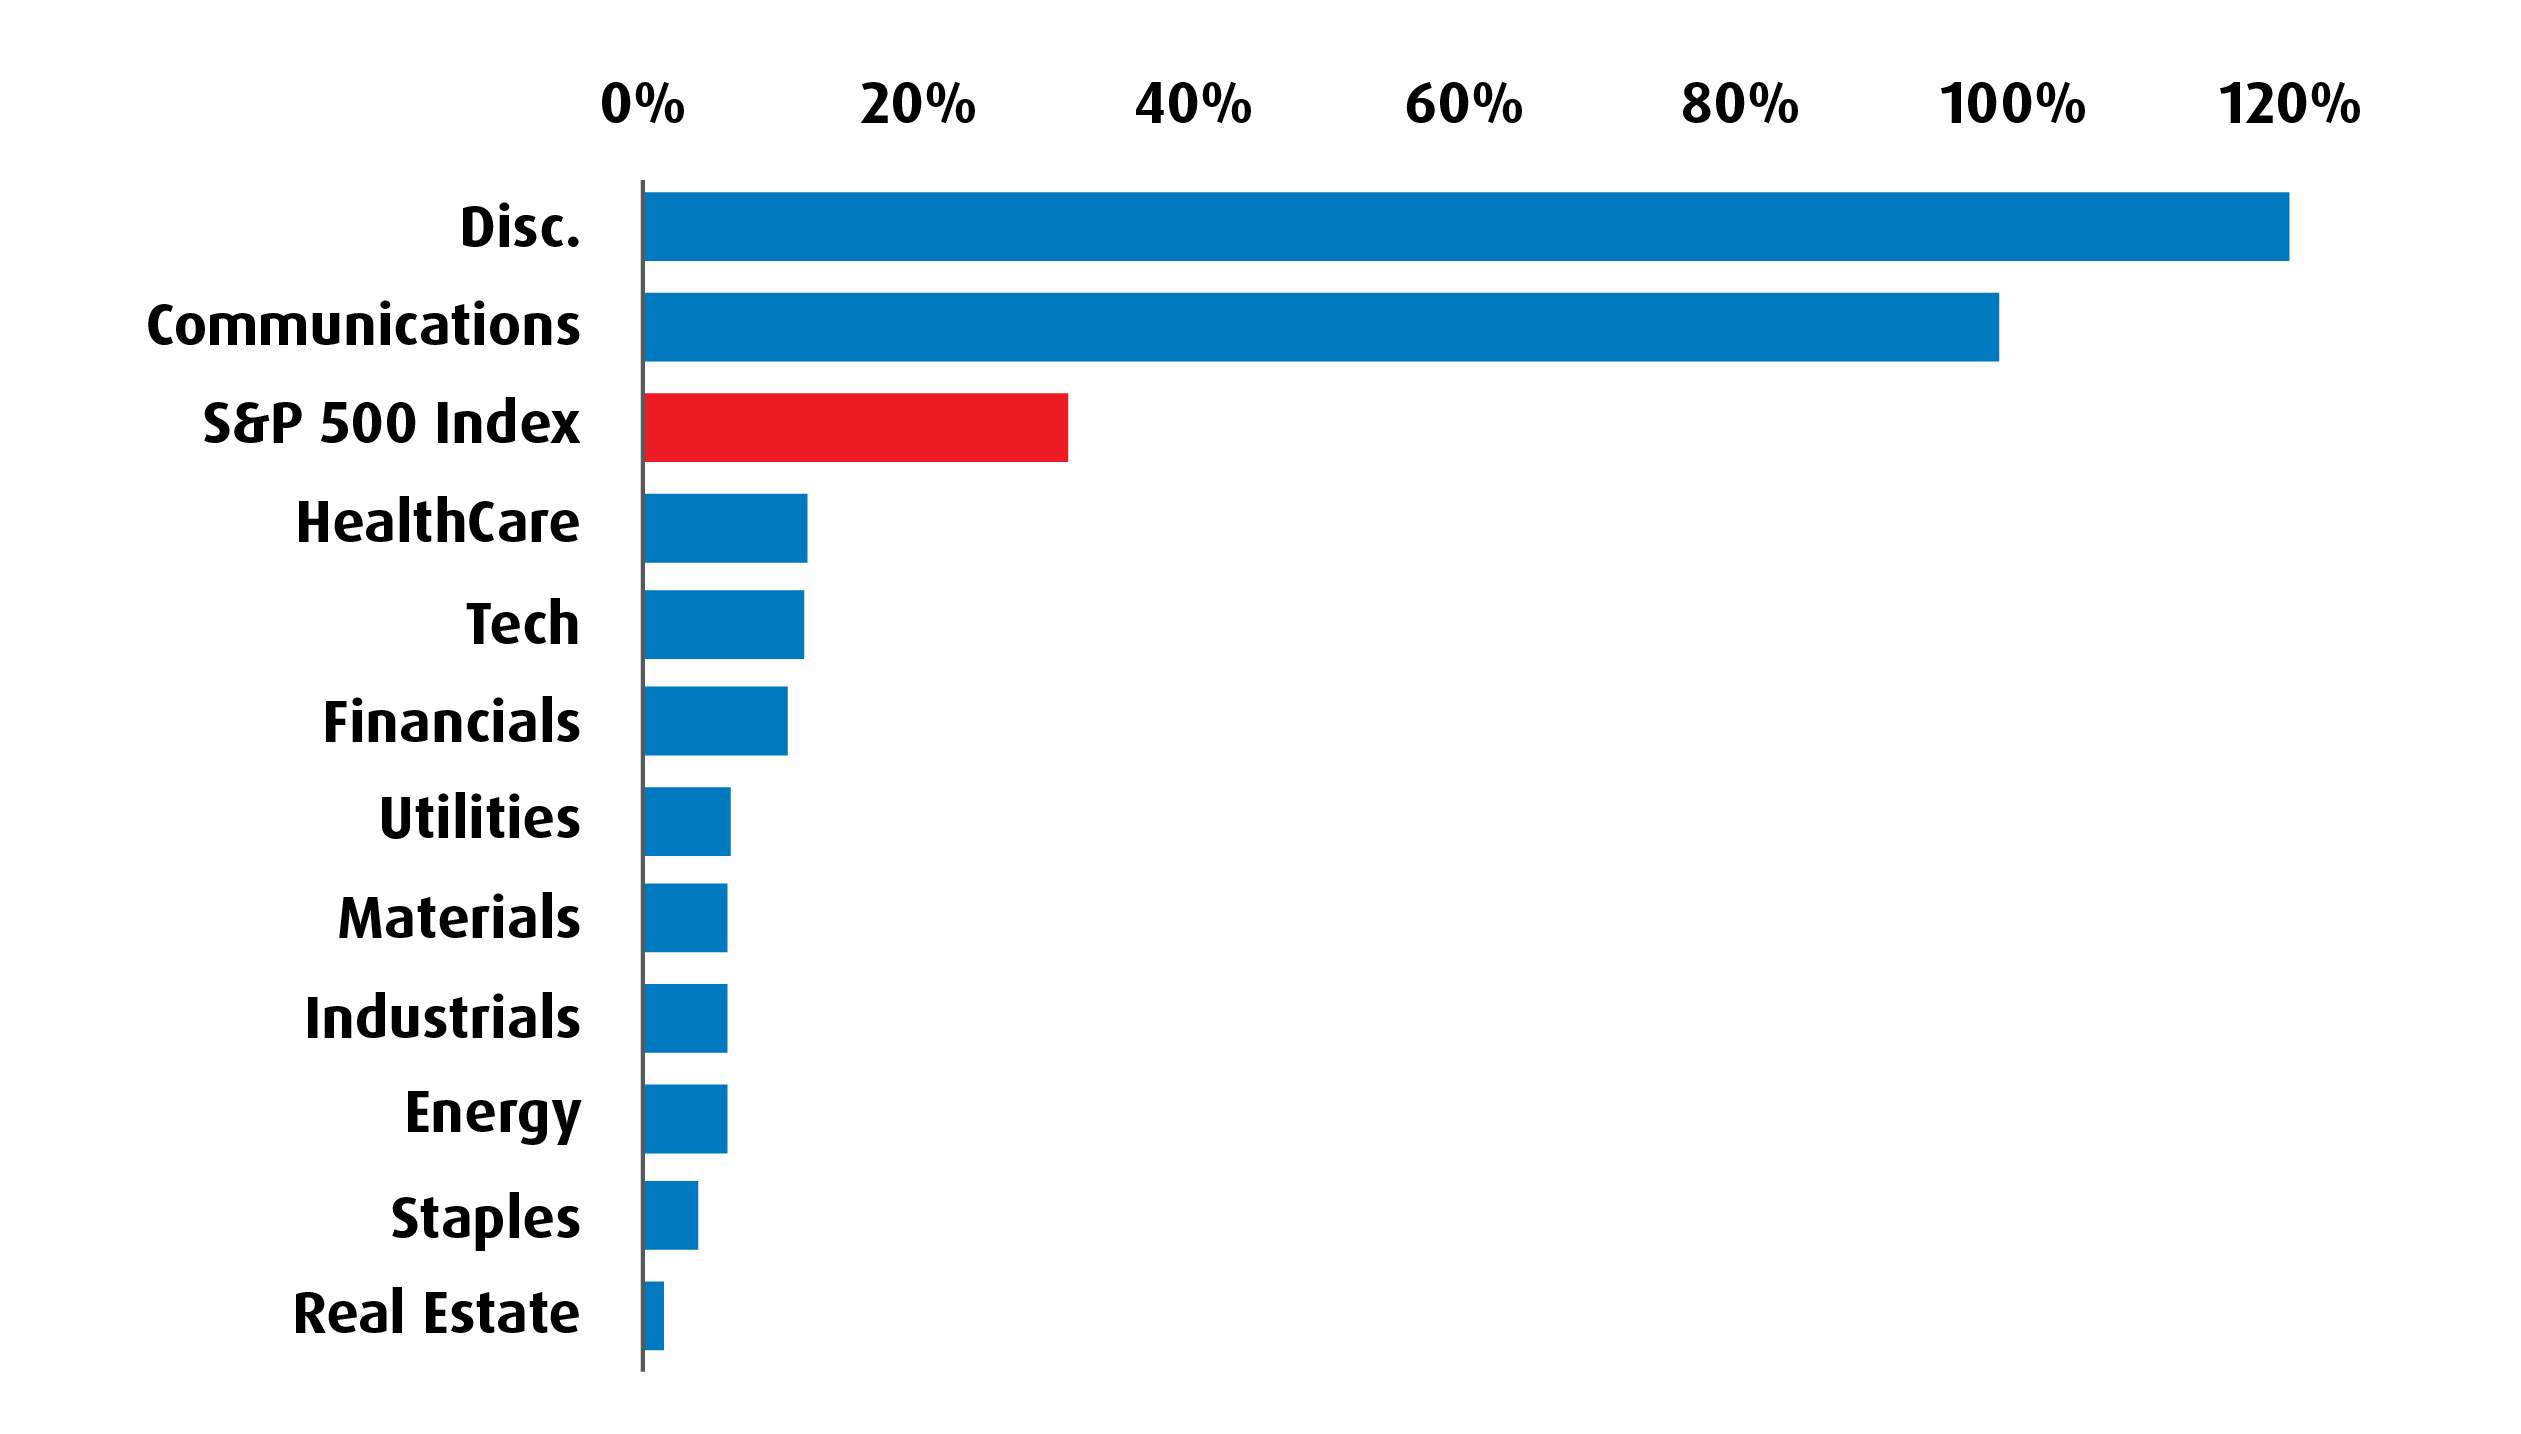
Chart 3 – Earnings and Valuation
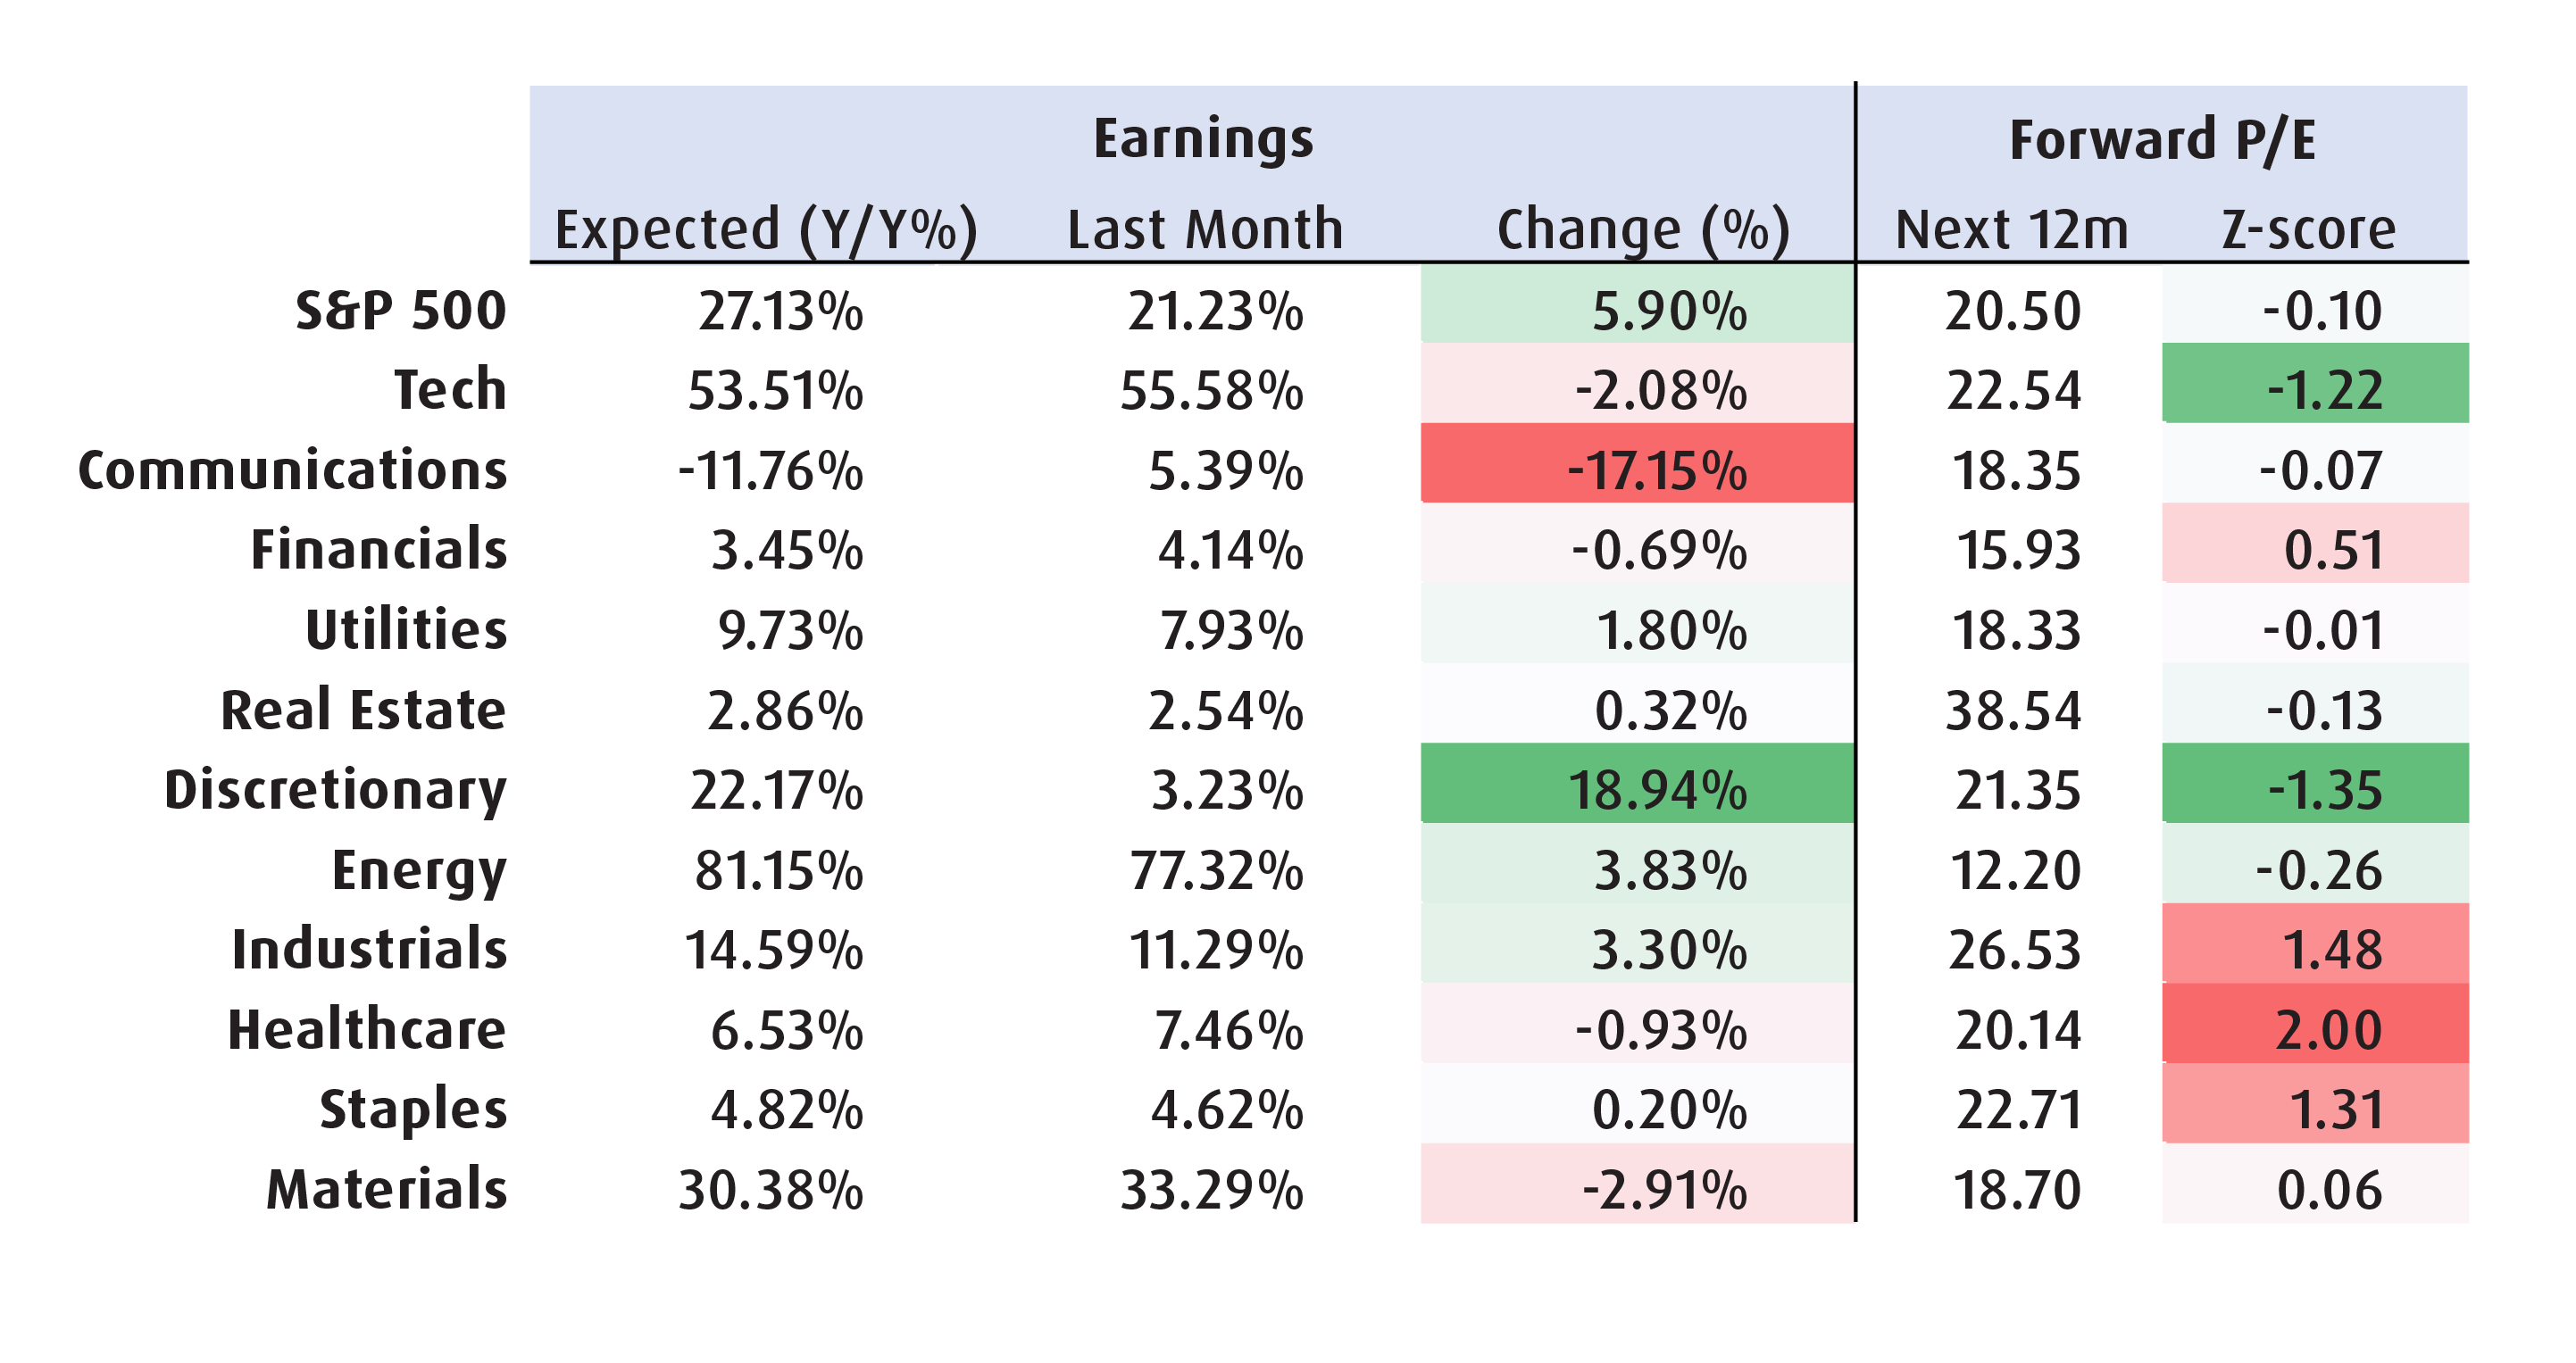
Chart 4 – BMO Sector Model Portfolio Performance in 2026
|
YTD |
1-Month |
3-Month |
6-Month |
Since Inception |
Inception Date |
|
|
BMO Model Sector Portfolio (%) |
11.97 |
-3.07 |
8.77 |
13.11 |
11.97 |
12/31/2025 |
Source: Bloomberg, BMO Global Asset Management. As of July 30th, 2026.
Chart 5 – BMO Sector ETF Portfolio for August 2026
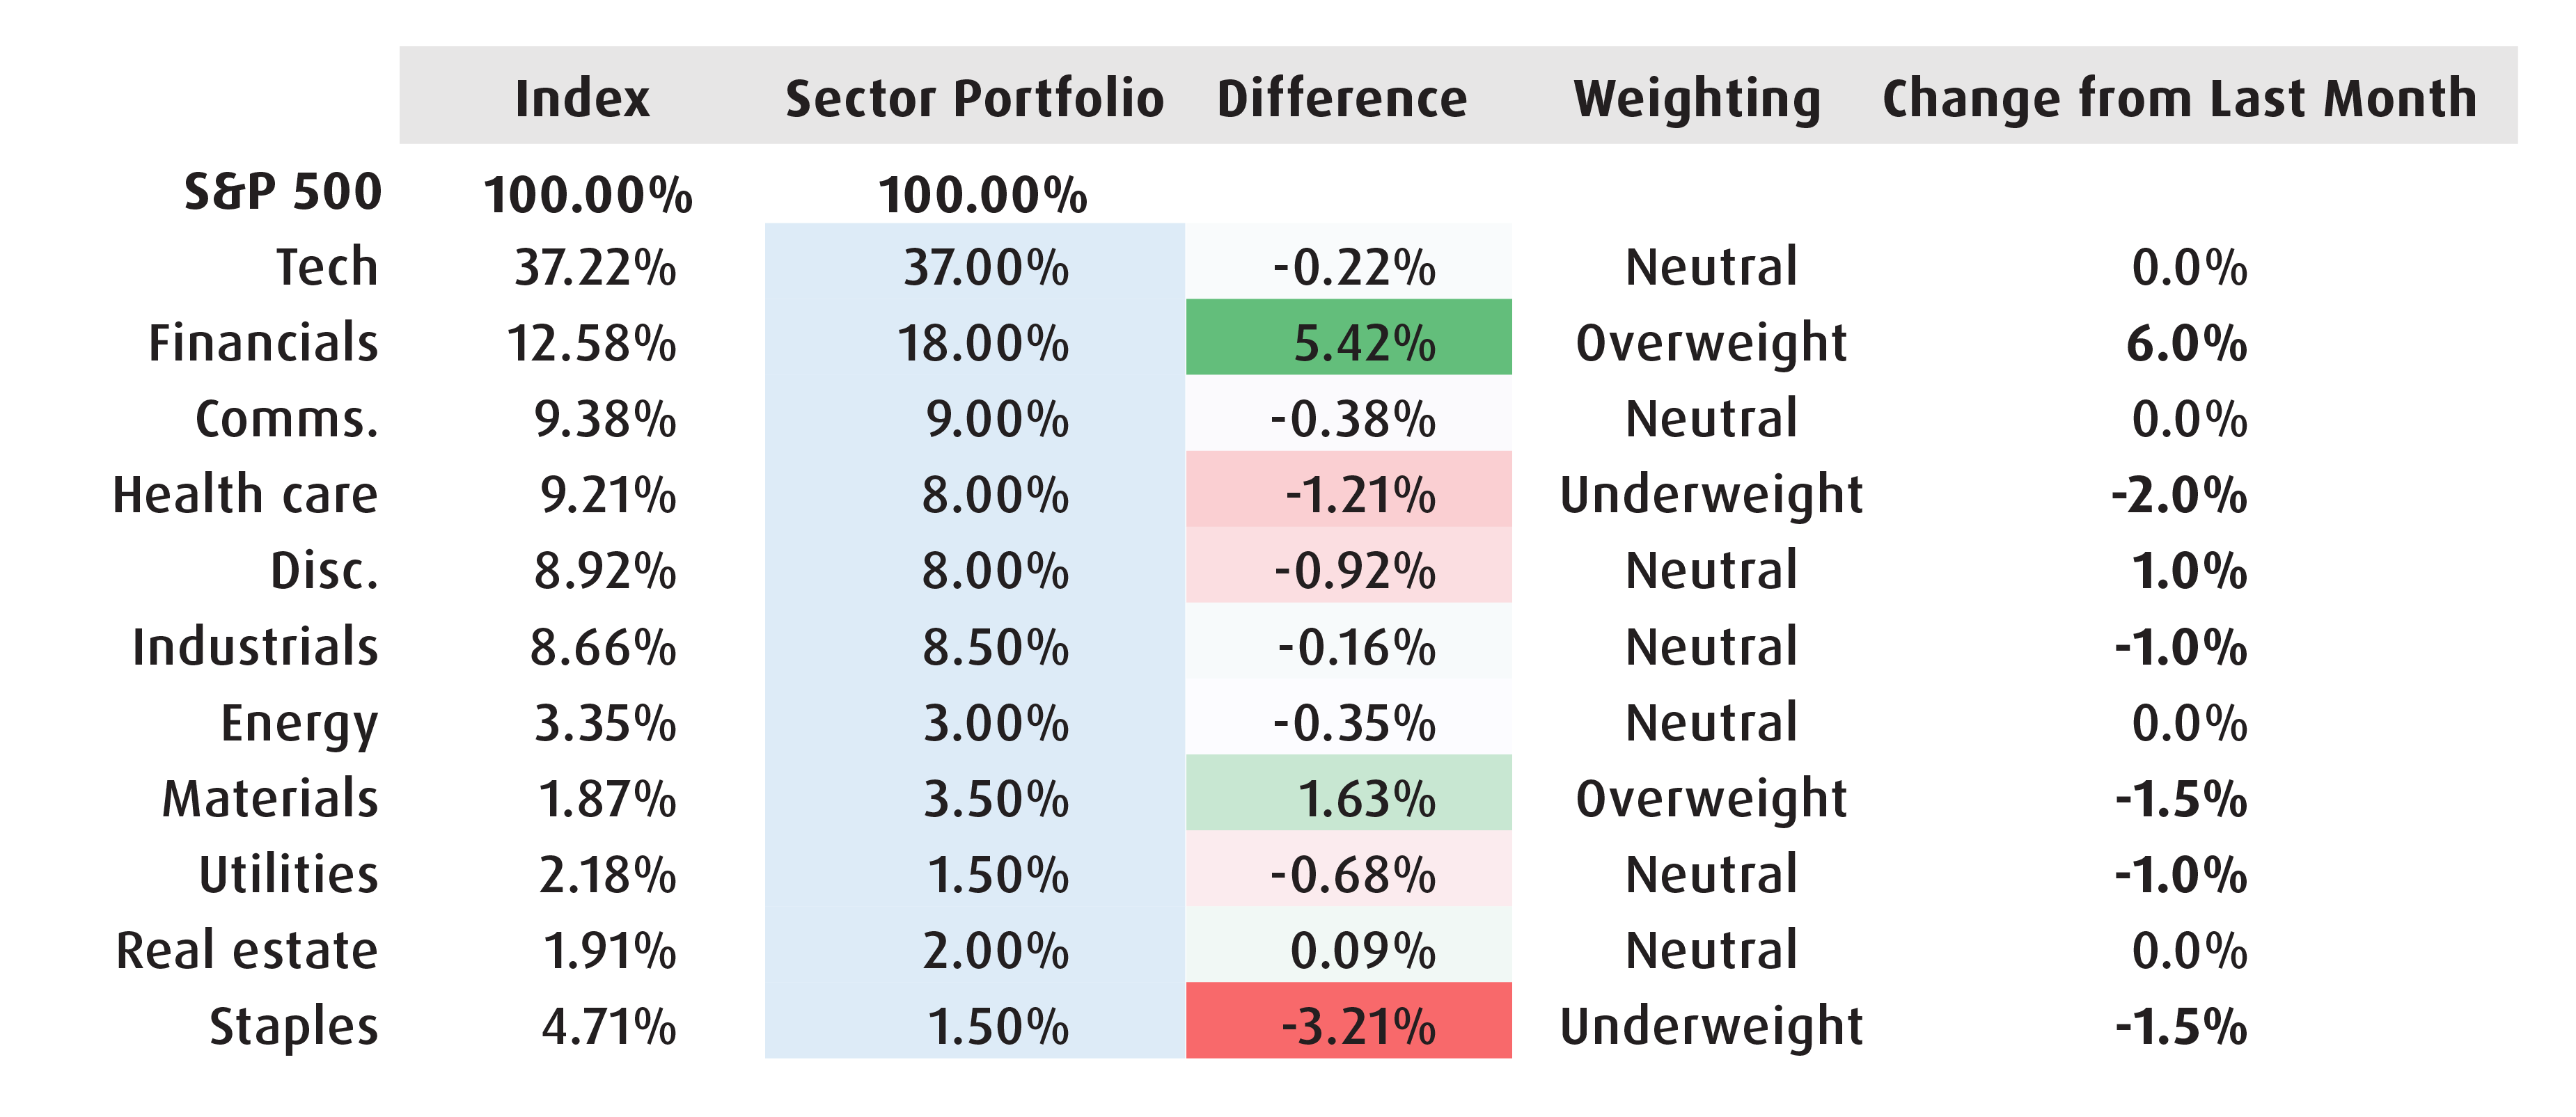
Chart 6 – BMO Sector ETF Portfolio Weights Relative to S&P 500
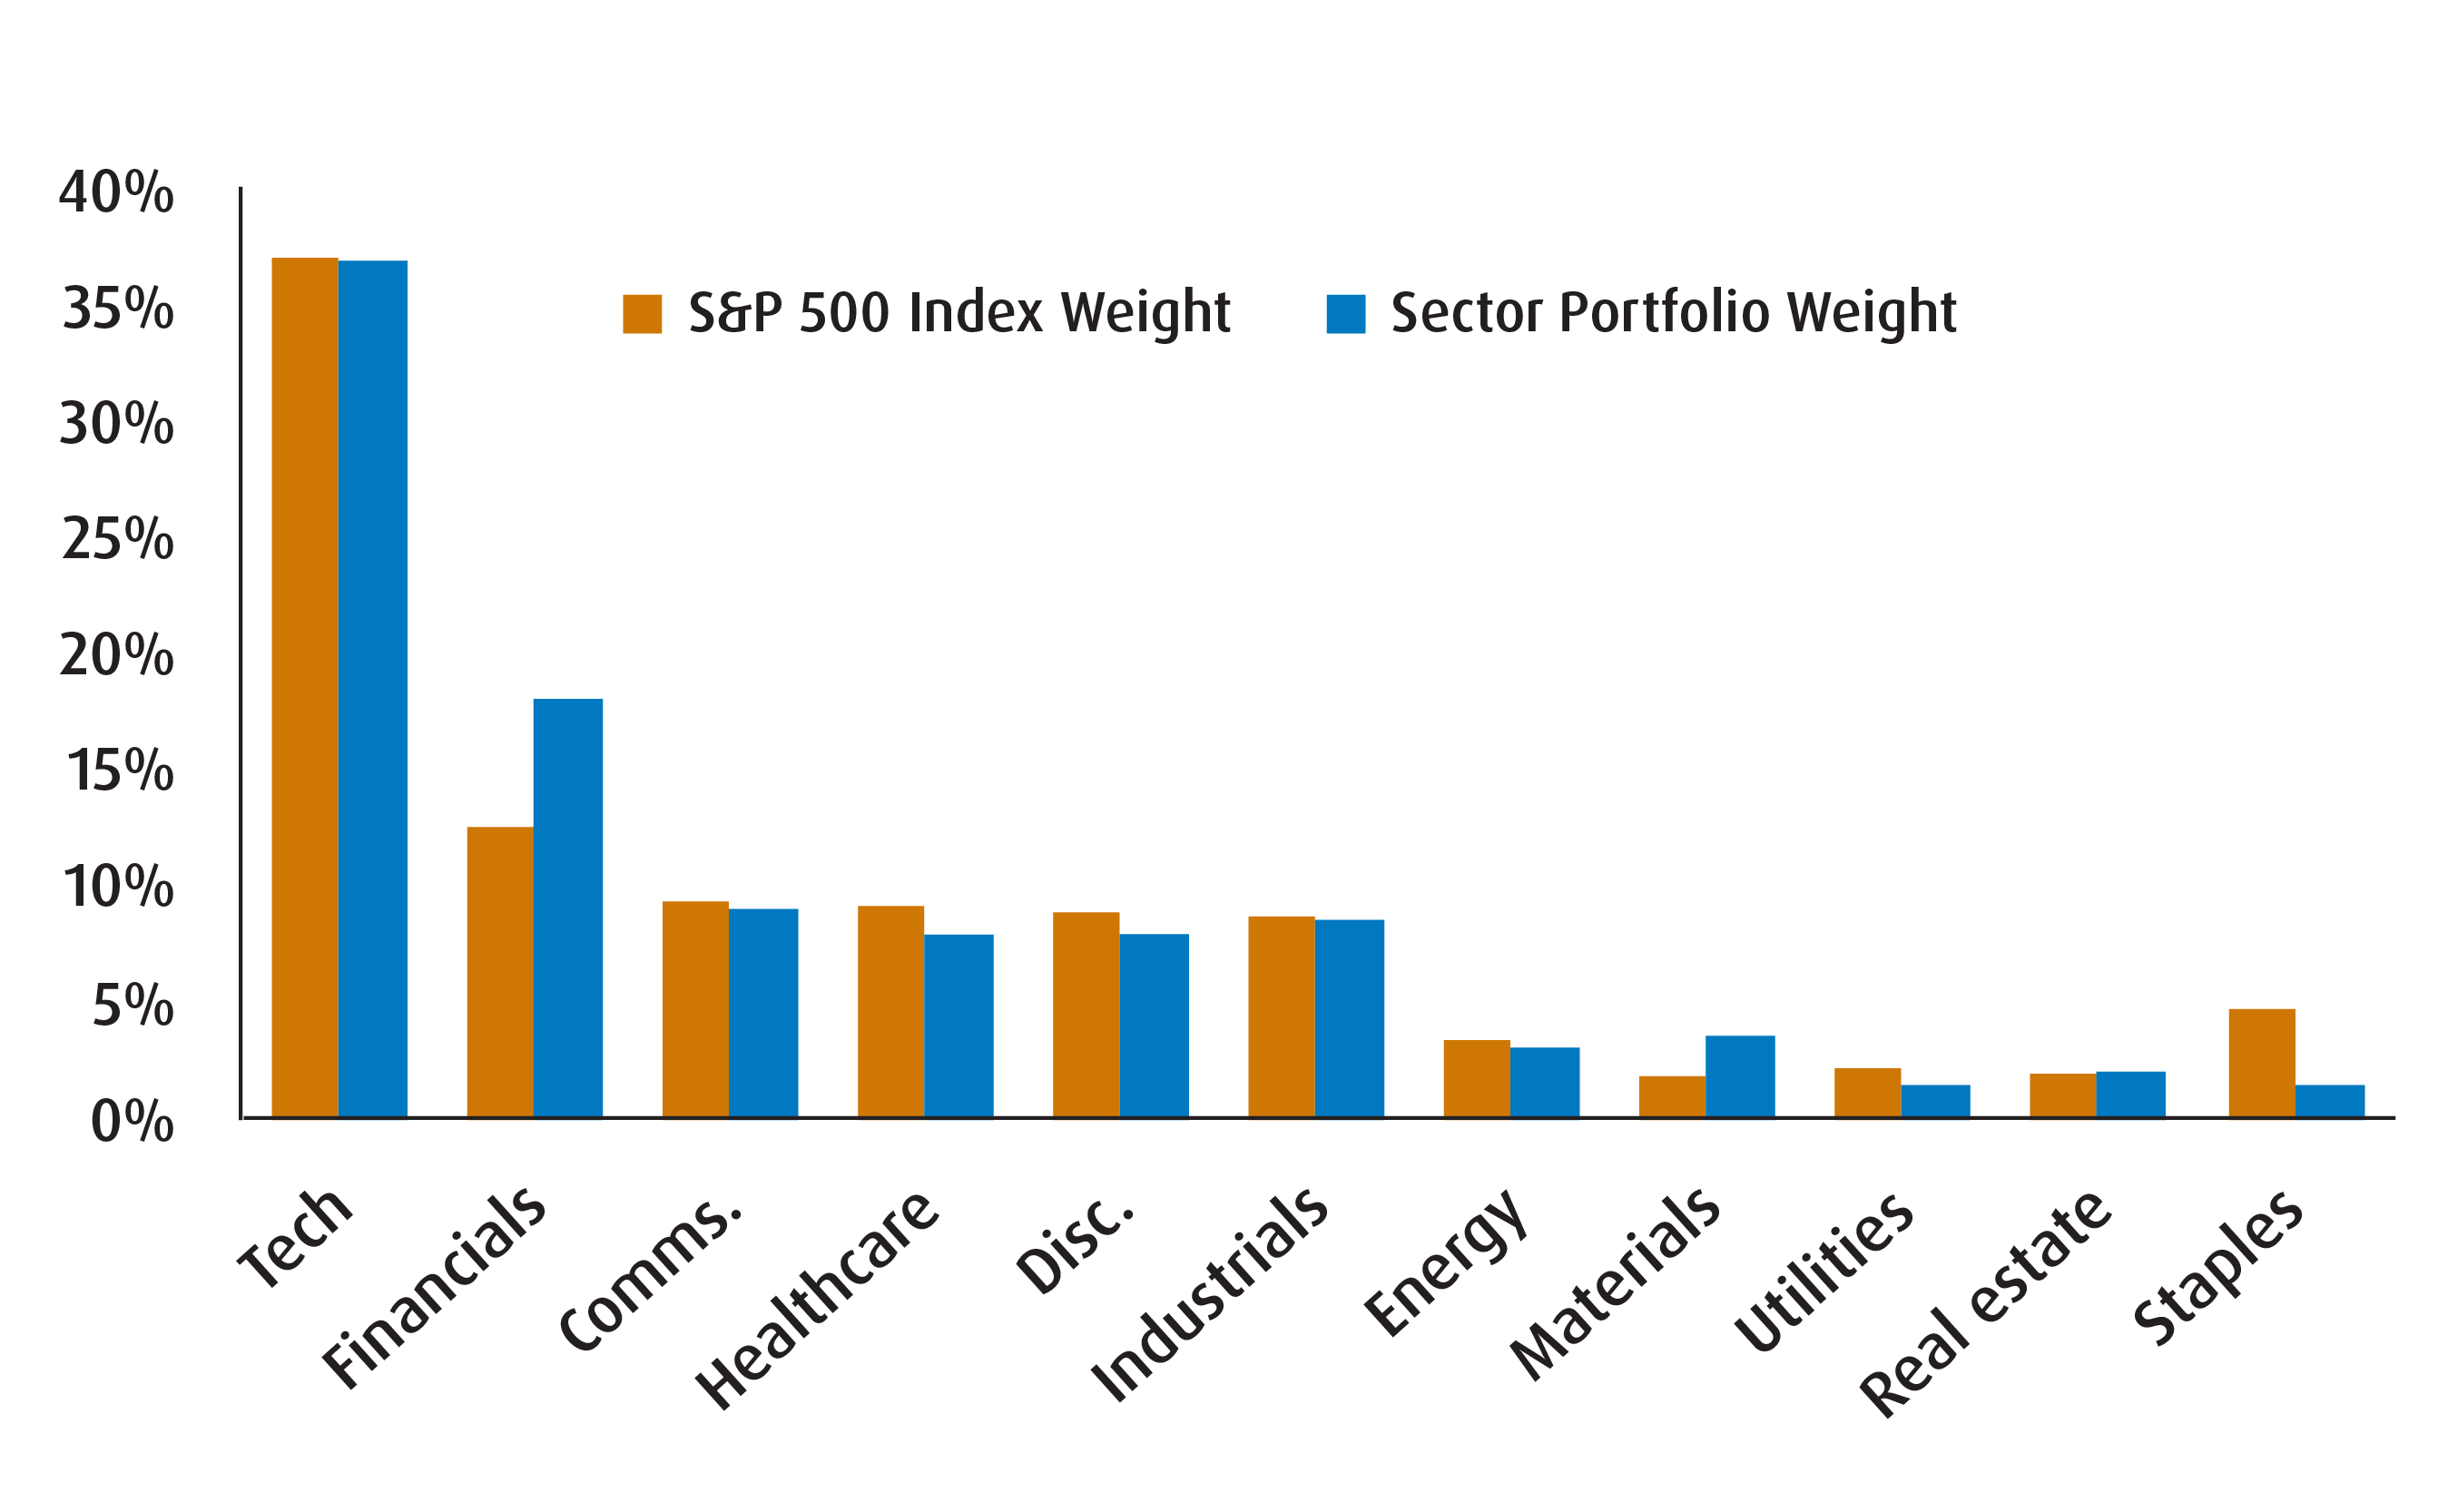
Chart 7 – Sector Returns
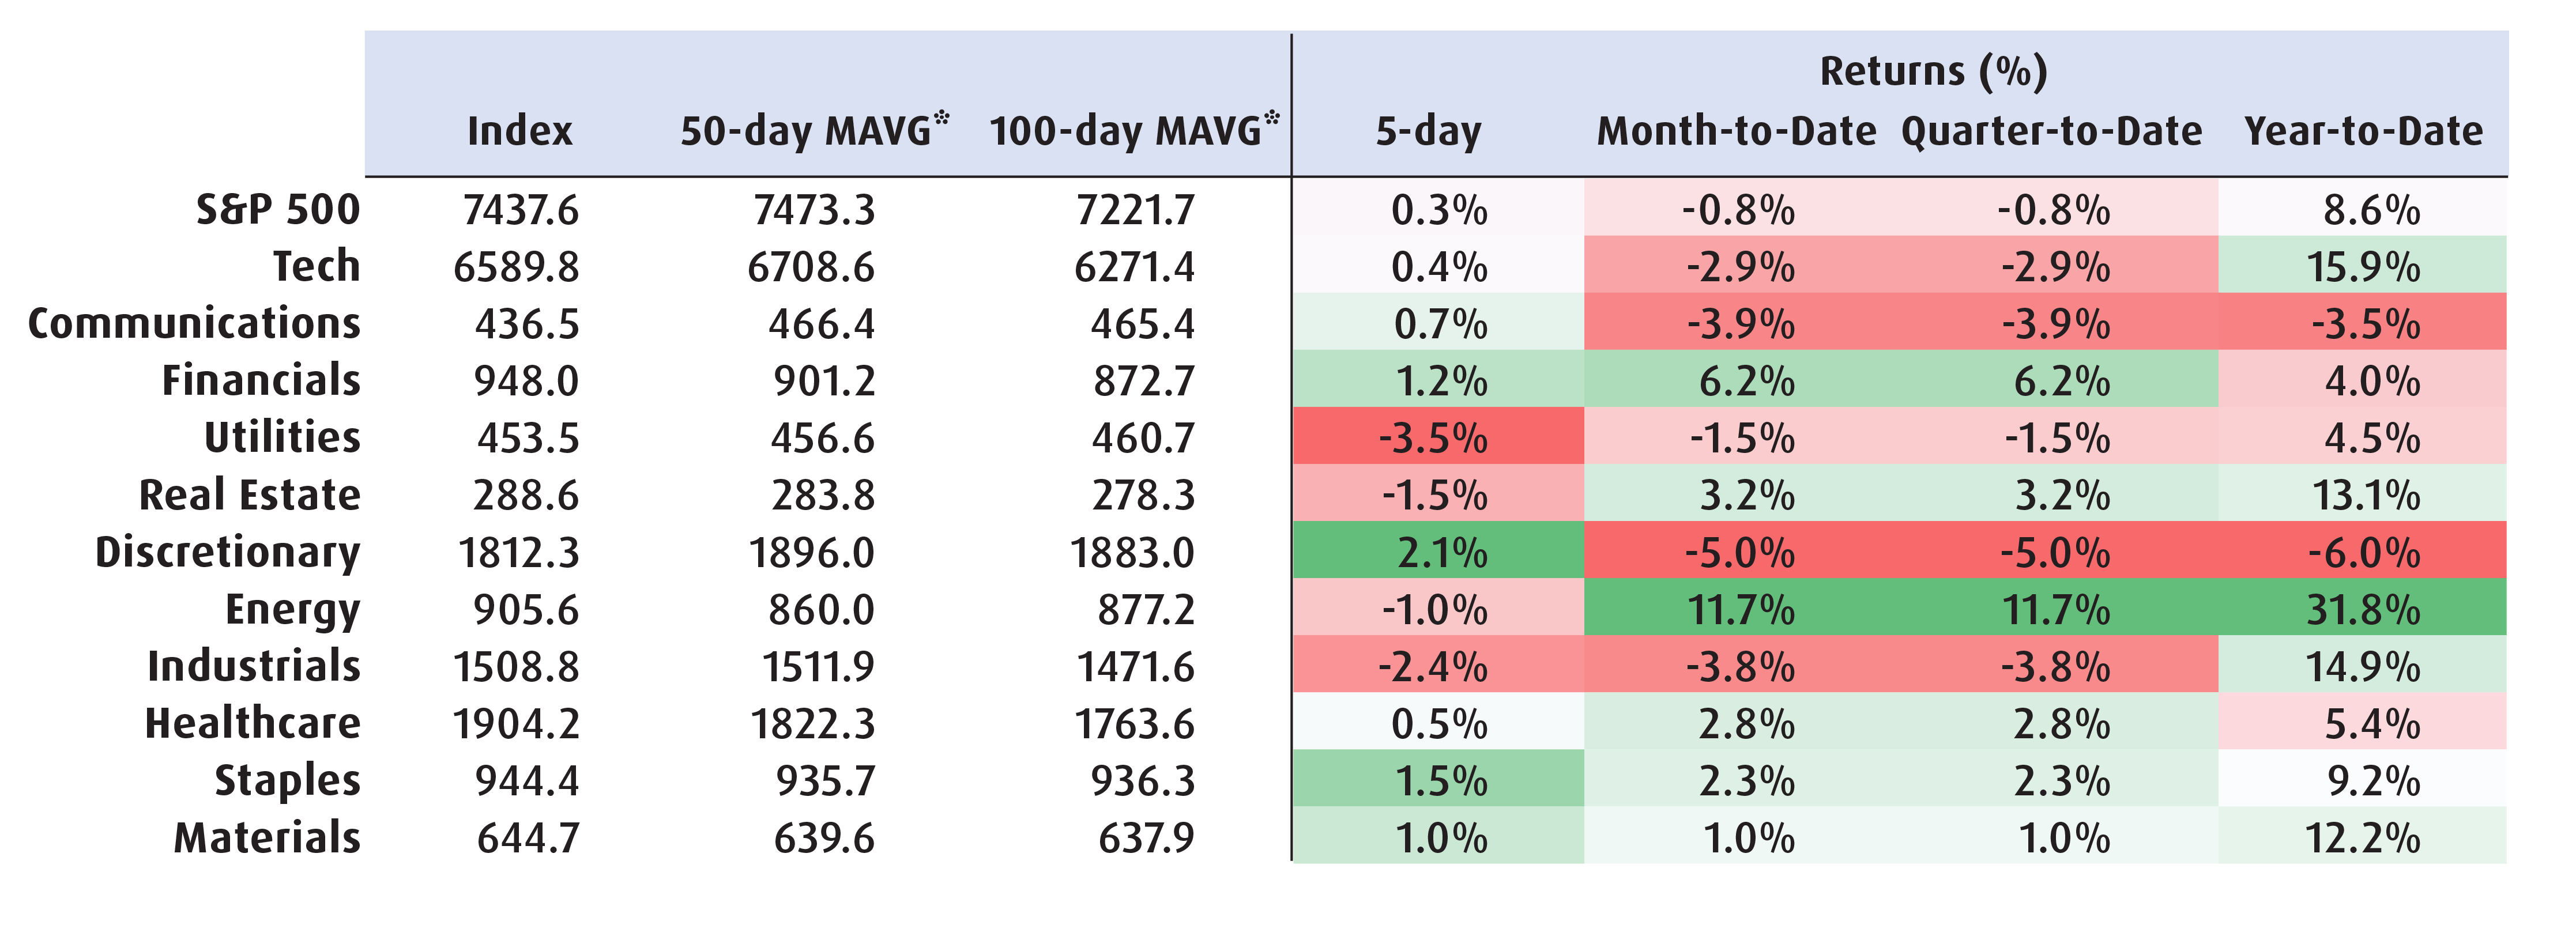
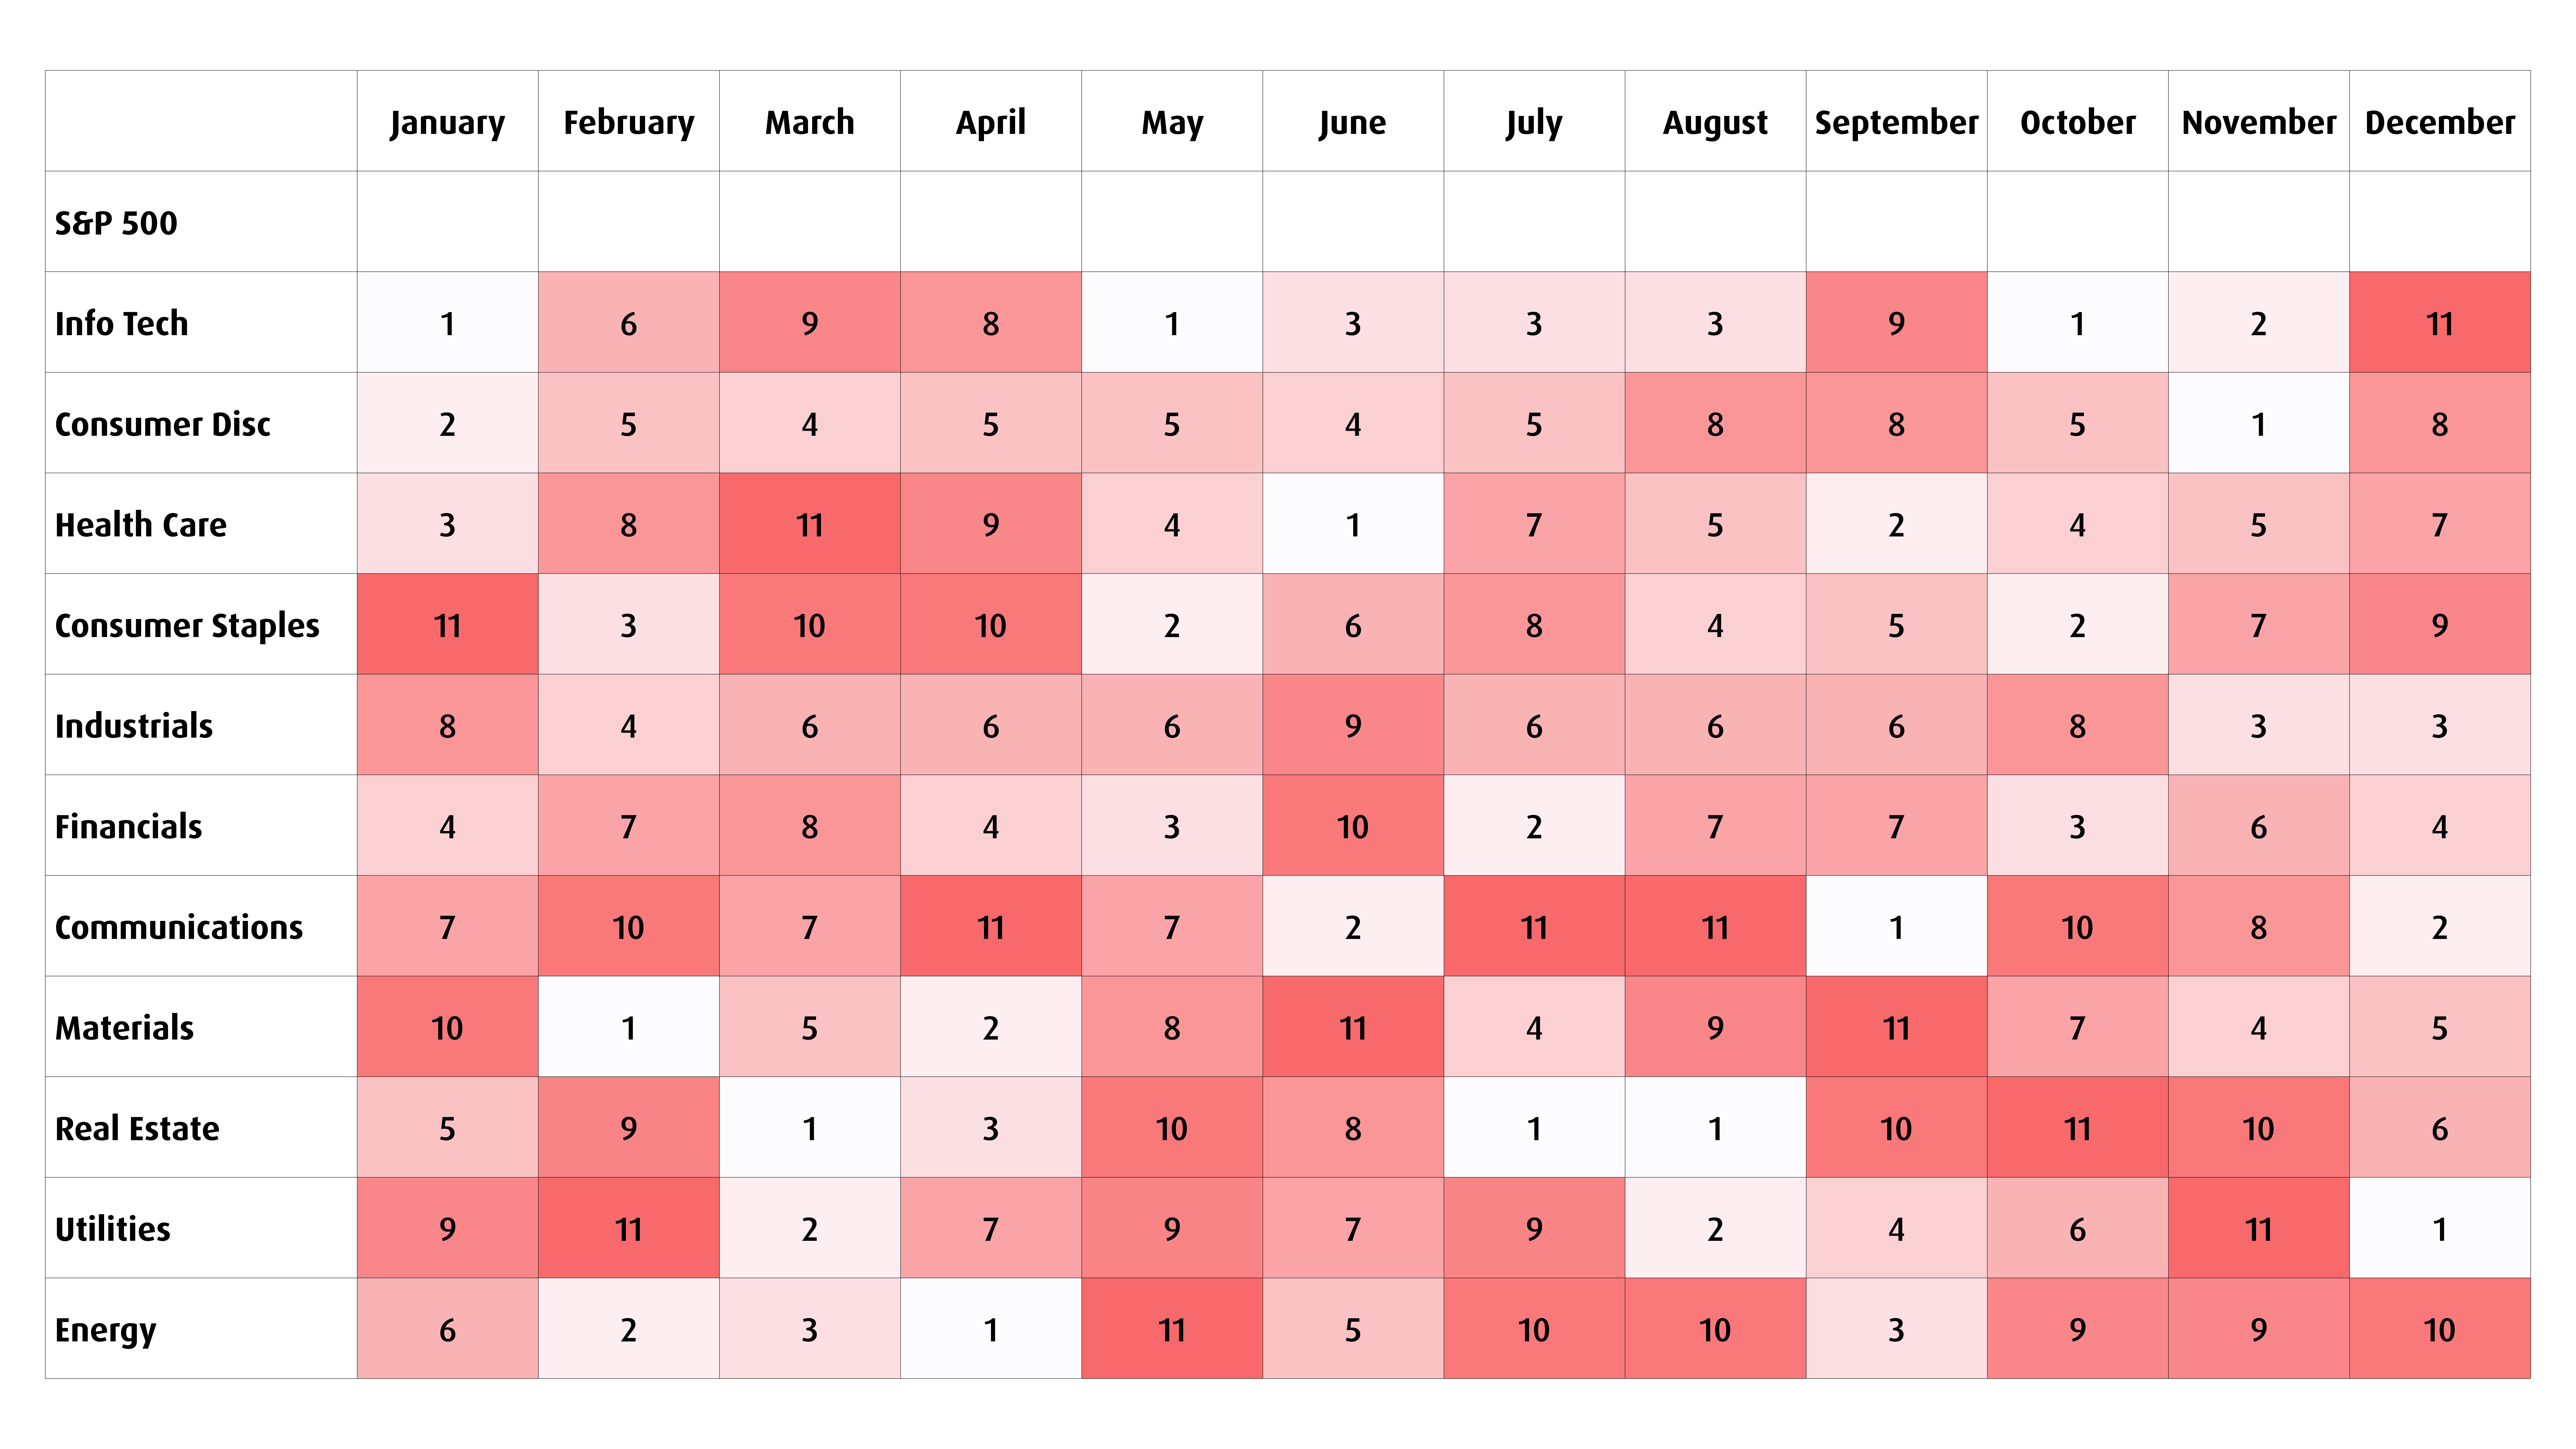
Chart 8 – Seasonality Chart (Avg Rank Over Past 35 Years)
Disclaimers:
For advisors only. No portion of this material may be reproduced or distributed to retail clients.
This material is for information purposes only. The information contained herein is not, and should not be construed as investment, tax or legal advice to any party. Particular investments and/or trading strategies should be evaluated and professional advice should be obtained with respect to any circumstance.
The viewpoints expressed represent the assessment of the markets at the time of publication. Those views are subject to change without notice at any time. The information provided herein does not constitute a solicitation of an offer to buy, or an offer to sell securities nor should the information be relied upon as investment advice. Past performance is no guarantee of future results. This communication is intended for informational purposes only.
Commissions, management fees and expenses all may be associated with investments in exchange-traded funds. Please read the ETF Facts or prospectus of the BMO ETFs before investing. Exchange-traded funds are not guaranteed, their values change frequently and past performance may not be repeated.
For a summary of the risks of an investment in the BMO ETFs, please see the specific risks set out in the prospectus. BMO ETFs trade like stocks, fluctuate in market value and may trade at a discount to their net asset value, which may increase the risk of loss. Distributions are not guaranteed and are subject to change and/or elimination.
The Select Sector SPDR® Trust consists of eleven separate investment portfolios (each a “Select Sector SPDR® ETF” or an “ETF” and collectively the “Select Sector SPDR® ETFs” or the “ETFs”). Each Select Sector SPDR® ETF is an “index fund” that invests in a particular sector or group of industries represented by a specified Select Sector Index. The companies included in each Select Sector Index are selected on the basis of general industry classification from a universe of companies defined by the S&P 500®. The investment objective of each ETF is to provide investment results that, before expenses, correspond generally to the price and yield performance of publicly traded equity securities of companies in a particular sector or group of industries, as represented by a specified market sector index.
The S&P 500®, SPDRs®, and Select Sector SPDRs® are trademarks of The McGraw-Hill Companies, Inc. and have been licensed for use. The stocks included in each Select Sector Index were selected by the compilation agent. Their composition and weighting can be expected to differ to that in any similar indexes that are published by S&P.
The S&P 500 Index is an unmanaged index of 500 common stocks that is generally considered representative of the U.S. stock market. The index is heavily weighted toward stocks with large market capitalizations and represents approximately two-thirds of the total market value of all domestic common stocks. The S&P 500 Index figures do not reflect any fees, expenses or taxes. An investor should consider investment objectives, risks, fees and expenses before investing.
You cannot invest directly in an index.
BMO ETFs are managed by BMO Asset Management Inc., an investment fund manager, a portfolio manager, and a separate legal entity from Bank of Montreal.
“BMO (M-bar roundel symbol)” is a registered trademark of Bank of Montreal, used under licence.