Sectors Portfolio: Higher Yields, Higher Hurdles


- The US remains firmly in reflation, but the investment backdrop is becoming more precarious. Resilient growth should continue to support earnings and broad risk appetite, but sticky inflation, renewed policy tightening and rising long-term yields leave less room for error. With Q3 earnings season beginning, we are favouring sectors with improving fundamentals while limiting exposure to long-duration and rate-sensitive areas of the market.
- The Health Care sector is now our largest overweight and the portfolio’s primary defensive allocation. Unlike most defensive sectors, earnings momentum (see Chart 4) has strengthened materially (+17%). However, sales growth remains modest at 3.4%, indicating that margin expansion rather than stronger demand is driving the improvement. Even so, the sector’s strengthening earnings profile provides a more compelling balance of resilience and growth than other defensive areas, despite its elevated valuation relative to history.
- Financials offer one of the most compelling risk-reward opportunities. The sector was September’s weakest performer despite improving earnings expectations and some of the strongest forward cash-flow growth over the next 12 months. The recent pullback has improved valuations without materially altering the fundamental outlook, creating a more attractive entry point heading into earnings season.
- Technology remains the market’s strongest earnings story, but elevated long-term Treasury yields are an increasingly important headwind. The sector continues to lead on both forward earnings and sales growth, with both measures more than three standard deviations above their long-term averages. However, Technology’s long-duration characteristics leave valuations particularly sensitive to higher discount rates. We remain constructive on the earnings outlook, but the pressure from elevated long-term yields supports a neutral position.
- Consumer Discretionary and Communication Services face a more demanding setup. Both sectors continue to trade at premium valuations despite relatively weak earnings-growth expectations over the next 12 months. Communication Services has delivered impressive recent performance, but much of that strength has been driven by Meta’s outsized gains (+30%), rather than a broad-based improvement in earnings. Until growth expectations stabilize or valuations become more compelling, we remain cautious.
- Utilities and Real Estate face the highest hurdle. While both sectors trade below their historical valuation ranges, fundamental headwinds remain significant. Utilities face weakening cash-flow expectations, while Real Estate continues to contend with elevated financing costs. With long-term yields still acting as a headwind, valuation support alone is unlikely to drive sustained outperformance.
- For the portfolio: We are making the following changes:
- Tech: Sector weight is unchanged from last month. Our position has changed from overweight to neutral following the increase in benchmark weight.
- Financials: Our position is still overweight, but weight is slightly higher than last month.
- Health Care: Our position has changed from neutral to overweight. We are adding weight relative to last month.
- Communication Services: Our position is still underweight, but weight is higher than last month to be in line with the index.
- Industrials: Our position is still neutral, but weight is lower than last month.
- Materials: Our position has changed from overweight to neutral.
- Discretionary: Our position is still underweight. We are trimming our weight relative to last month.
- Real Estate: Our position is still neutral, but weight is slightly lower than last month.
Benchmark is the S&P 500 Index.
Sectors in focus:
Health Care (BMO SPDR Health Care Select Sector Index ETF – ZXLV)
Financials (BMO SPDR Consumer Financials Select Sector Index ETF - ZXLF)
Technology (BMO SPDR Technology Select Sector Index ETF – ZXLK)
Please see Chart 5 below for the monthly performance and refer to Chart 6 for the monthly tactical changes in the model BMO Sector Model Portfolio.
Chart 1 – Sector Total Performance Chart
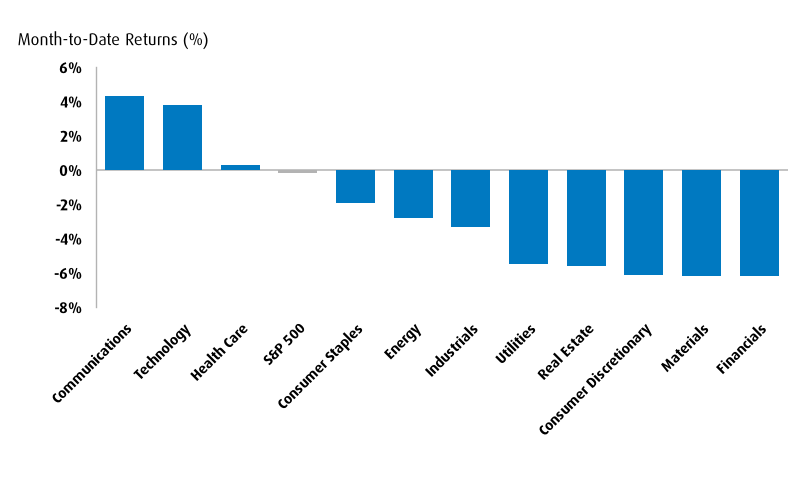
Chart 2 – Forward Cash Flow from Operations (CFO) Growth – Next 12m
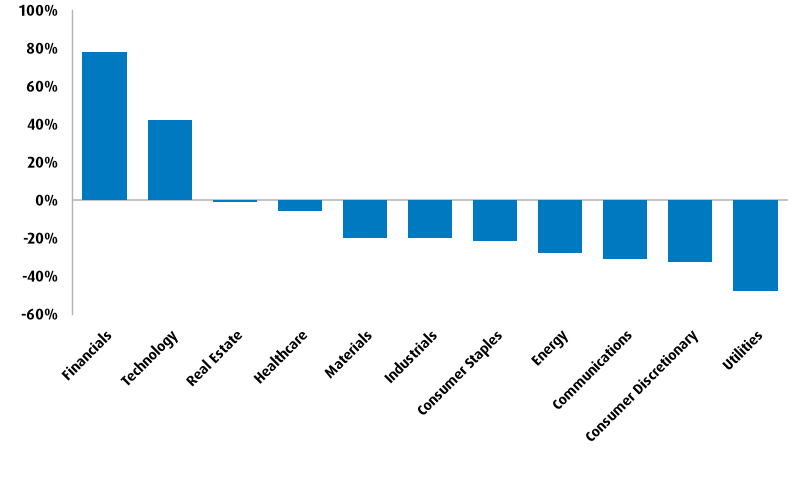
Chart 3 – Earnings and Valuation
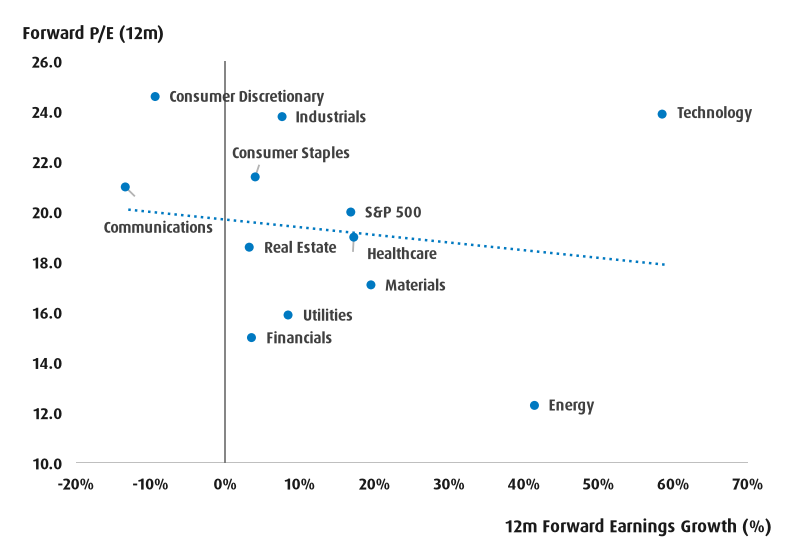
Table 4 – Earnings and Valuation Relative to History
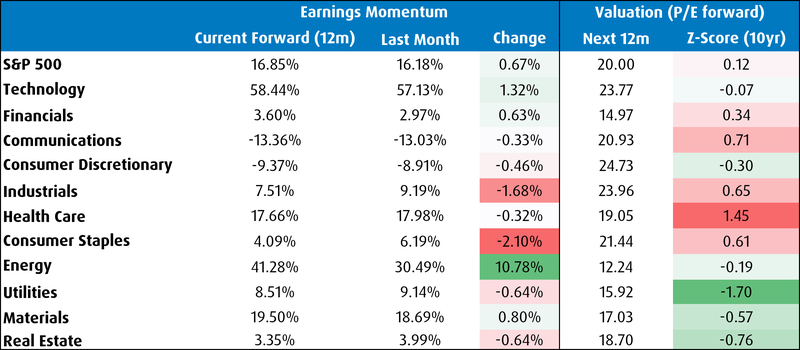
Chart 5 – BMO Sector Model Portfolio Performance in 2026
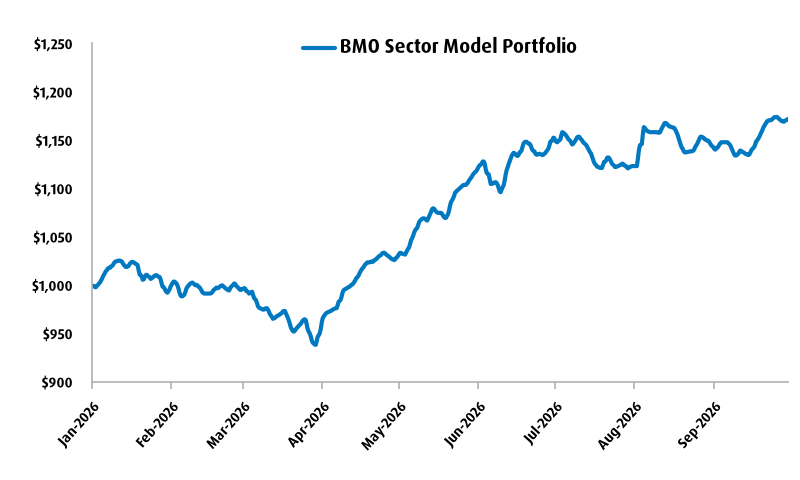
| Year-to-date | 1-Month | 3-Month | 6-Month | Since Inception | Inception Date | |
BMO Model Sector Portfolio (%) | 17.24% | 1.89% | 1.50% | 25.27% | 17.24% | 12/31/2025 |
Source: BMO Global Asset Management. Data as of September 29th, 2026. Past performance is not indicative of future results.
Chart 6 – BMO Sector ETF Portfolio for October 2026
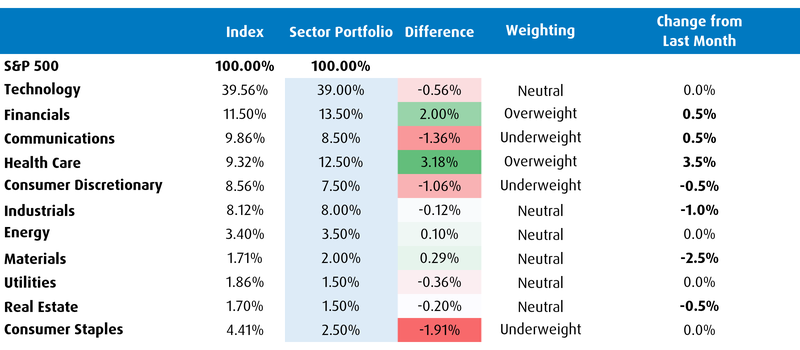
Chart 7 – BMO Sector ETF Portfolio Weights Relative to S&P 500
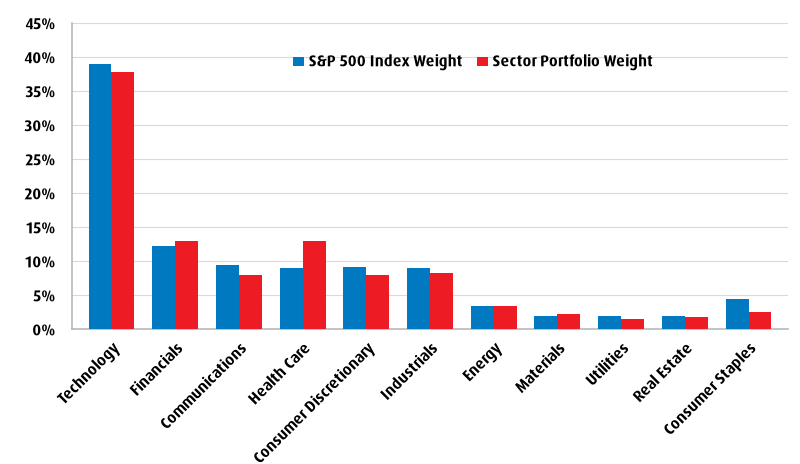
Chart 8 – Sector Returns
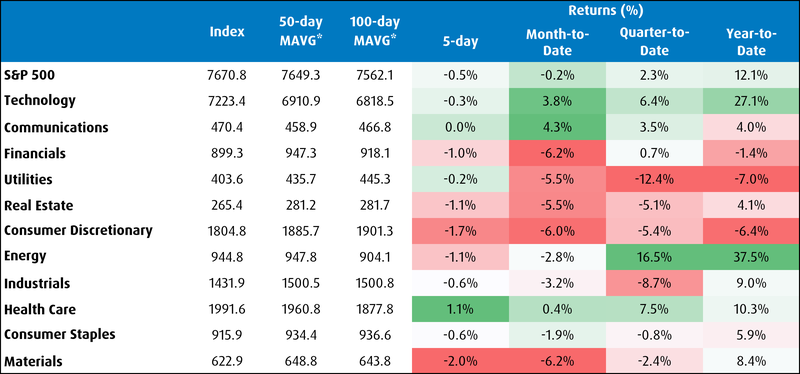
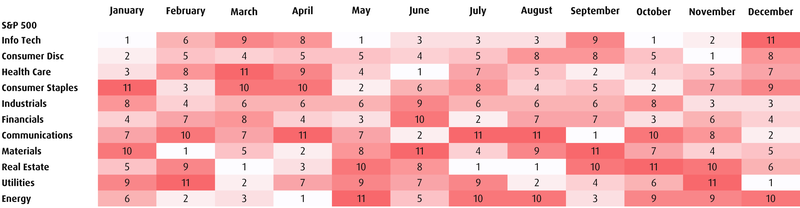
Chart 9 – Seasonality Chart (Avg Rank Over Past 35 Years)
Disclaimers:
For advisors only. No portion of this material may be reproduced or distributed to retail clients.
This material is for information purposes only. The information contained herein is not, and should not be construed as investment, tax or legal advice to any party. Particular investments and/or trading strategies should be evaluated and professional advice should be obtained with respect to any circumstance.
The viewpoints expressed represent the assessment of the markets at the time of publication. Those views are subject to change without notice at any time. The information provided herein does not constitute a solicitation of an offer to buy, or an offer to sell securities nor should the information be relied upon as investment advice. Past performance is no guarantee of future results.
Commissions, management fees and expenses all may be associated with investments in exchange-traded funds. Please read the ETF Facts or prospectus of the BMO ETFs before investing. The indicated rates of return are the historical annual compounded total returns including changes in unit value and reinvestment of all dividends or distributions and do not take into account sales, redemption, distribution or optional charges or income taxes payable by any unitholder that would have reduced returns. Exchange-traded funds are not guaranteed, their values change frequently and past performance may not be repeated.
For a summary of the risks of an investment in the BMO ETFs, please see the specific risks set out in the prospectus. BMO ETFs trade like stocks, fluctuate in market value and may trade at a discount to their net asset value, which may increase the risk of loss. Distributions are not guaranteed and are subject to change and/or elimination.
The Select Sector SPDR® Trust consists of eleven separate investment portfolios (each a “Select Sector SPDR® ETF” or an “ETF” and collectively the “Select Sector SPDR® ETFs” or the “ETFs”). Each Select Sector SPDR® ETF is an “index fund” that invests in a particular sector or group of industries represented by a specified Select Sector Index. The companies included in each Select Sector Index are selected on the basis of general industry classification from a universe of companies defined by the S&P 500®. The investment objective of each ETF is to provide investment results that, before expenses, correspond generally to the price and yield performance of publicly traded equity securities of companies in a particular sector or group of industries, as represented by a specified market sector index.
The Select Sector Index is a product of S&P Dow Jones Indices LLC or its affiliates (SPDJI), and has been licensed for use by BMO Asset Management Inc. S&P®, S&P 500®, Select Sector®, SPDR®, US 500, The 500 are trademarks of S&P Global, Inc. or its affiliates (S&P) and Dow Jones® is a registered trademark of Dow Jones Trademark Holdings LLC (Dow Jones), and these trademarks have been licensed for use by SPDJI and sublicensed for certain purposes by BMO Asset Management Inc. The relevant BMO ETF is not sponsored, endorsed, sold or promoted by SPDJI, Dow Jones, S&P, their respective affiliates, and none of such parties make any representation regarding the advisability of investing in such product(s) nor do they have any liability for any errors, omissions, or interruptions of the Index.
The S&P 500 Index is an unmanaged index of 500 common stocks that is generally considered representative of the U.S. stock market. The index is heavily weighted toward stocks with large market capitalizations and represents approximately two-thirds of the total market value of all domestic common stocks. The S&P 500 Index figures do not reflect any fees, expenses or taxes. An investor should consider investment objectives, risks, fees and expenses before investing.
You cannot invest directly in an index.
BMO ETFs are managed by BMO Asset Management Inc., an investment fund manager, a portfolio manager, and a separate legal entity from Bank of Montreal.
“BMO (M-bar roundel symbol)” is a registered trademark of Bank of Montreal, used under licence.