Time to Lock in Profits? BMO’s Buffer ETFs Offer Efficient Peace of Mind.

“Losses loom larger than gains.” – Daniel Kahneman & Amos Tversky1
Famed researchers in behavioural finance, Daniel Kahneman and Amos Tversky once hypothesized the psychological pain of loss is about twice as powerful as the pleasure of gaining. After strong performances from U.S. stocks over the past two quarters, we find ourselves dusting off the pair’s work and asking, is now the time to lock in gains and take some downside insurance?
We have seen a remarkable run from stocks such as Nvidia lift the S&P 500 Index to all time highs. This may cause some valuation concerns among investors. The S&P 500 is currently trading at a price-to-earnings ratio (P/E) of about 25 times, which from a historical perspective can be considered rich relative to the average of 17.2
Launching April 1, BMO ETFs’ new BMO US Equity Buffer Hedged to CAD ETF – April aims to protect returns while providing downside protection.
ETF in Focus
Trade Idea
Amid valuation and other risks, many strategists expect elevated volatility to persist over the near- to medium-term this year. Additionally, a recent note from JP Morgan quantitative strategists warns investors to be aware of persistently rising concentration in the U.S. stock market in 2024, drawing similarities between this period to the Dotcom Bubble.3
Year to date, the Magnificent 7 have delivered terrific returns as their weights have increased within the S&P500 (SPX): Microsoft, Apple, Nvidia, Amazon, Alphabet, Meta and Tesla combine to make up around 28%4 of the current market capitalization of the SPX. While many believe these companies may continue to ride the tailwind of the AI business cycle and potentially drive markets to new highs, it can be viewed that the breadth of the overall market is worrisomely narrow and shallow.
The larger weights of those individual seven stocks are accentuating single-stock idiosyncratic risks, as well, whereby particular events (earnings misses, regulatory changes, etc.) affecting one of those names can potentially move the market lower.
At the macro-economic level, the U.S. economy seems resilient and has been performing above market expectations with better-than-expected job numbers and higher wage growth, which might keep interest rates higher for much longer than the markets have been pricing in. In turn, this economic robustness leads investors to want to stay invested in the market, despite the various levels of risks and headwinds that exist.
Loss Aversion Solution
To help navigate these market conditions, BMO ETFs is launching ZAPR for clients who may be looking to extend the protection of their portfolio in anticipation of a potential market pullback. Similar to our previous series, the new ZAPR expands the lineup of BMO’s current suite of Buffer ETFs, and seeks to provide investors with peace of mind by eliminating the first 15% of losses on their portfolios over one year (if held from inception and purchased at starting NAV to the end of the Target Outcome Period, which is approximately the first week of April 2024 to last week of March 20255).
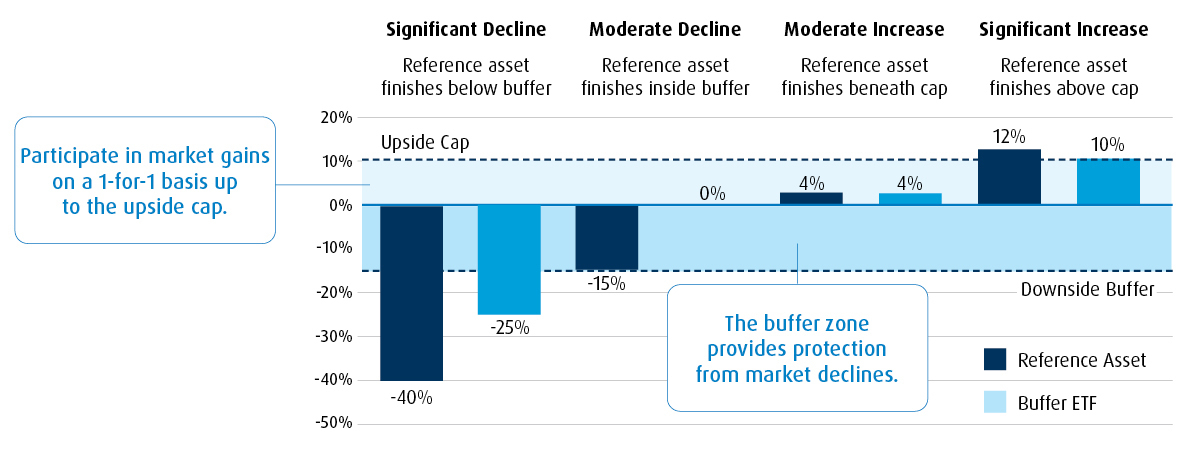
ZAPR increases the duration of portfolio hedging — or cushions what Kahneman and Tversky would call an investor’s loss aversion. The potential upside market participation for ZAPR is capped and the cap limit will be announced on the launch date of April 1, 2024, while a client’s portfolio will incur no losses if the market declines 15% from its current level.
Let’s compare two portfolios, one long-only and the other allocated to ZAPR. In the event of a market downturn, the long-only would experience full downside exposure. The allocation to ZAPR’s downside exposure is zero (or break-even, “BE”, see chart below) up to 15%.5 Even in the event of further declines, the buffer allocation is not as exposed to losses.
Buffer Your Downside Risk

With the addition of ZAPR, investors can now ladder their portfolio protections and add an additional maturity protection through March 2025.
Potential Outcomes Scenarios: Day 1 to Day 365
Similarly, investors can re-optimize their hedges by rolling any existing and performing buffer ETF into the new maturity offered by ZAPR. The roll over will allow for the monetization of any current hedges and implement a new hedge at current market levels.
Finally, since ZAPR owns the S&P 500 as the underlying stock position, investors who invest in the fund will collect index dividends on top of participating in the market’s upside (up to the cap).
Read More: Stay Invested with Buffer ETFs
A Buffer ETF can compliment or substitute your core equity positions, providing a built-in cushion on the downside to help keep you invested in broad U.S. equities. Since 2010, 90% of the time the market is down over a one-year period, it has been down less than 15%,7 illustrating the chances of being within the buffer zone.
This buffer structure will be an important tool going forward for cautious investors who are concerned about rich valuations and macro-economic risks.
1 Kahneman, D., & Tversky, A., “Prospect theory: An analysis of decision under risk,” Econometrica, 47, 1979, 263-291.
2 Morningstar, March 2024.
3 “JPMorgan quants warn of dot-com style concentration in U.S. stocks,” Bloomberg, January 30, 2024.
4 BMO Global Asset Management, February 29, 2024.
5 An investor that purchases Units of a Structured Outcome ETF other than at starting NAV on the first day of a Target Outcome Period and/or sells Units of a Structured Outcome ETF prior to the end of a Target Outcome Period may experience results that are very different from the target outcomes sought by the Structured Outcome ETF for that Target Outcome Period. BMO Buffer ETFs seeks to provide income and appreciation that match the return of a Reference Index up to a cap (before fees, expenses and taxes), while providing a buffer against the first 15% (before fees, expenses and taxes) of a decrease in the Reference Index over a period of approximately one year, starting from the first business day of the stated outcome period.
6 Table reflects percentage needed to get back to initial value. If the market is down -25%, with 15% buffer, you are actually down -10% on $100, (-$10) to $90. An investor would need $10 to get back to $100 breakeven. $10/$90 = 11.11% return to get back to $100 breakeven. The same math logic applies to every market drawdown scenario.
7 BMO Global Asset Management/Bloomberg, February 29, 2024.
Advisor Use Only.
Commissions, management fees and expenses all may be associated with investments in exchange traded funds. Please read the ETF Facts or prospectus of the BMO ETFs before investing. Exchange traded funds are not guaranteed, their values change frequently and past performance may not be repeated.
For a summary of the risks of an investment in the BMO ETFs, please see the specific risks set out in the BMO ETF’s prospectus. BMO ETFs trade like stocks, fluctuate in market value and may trade at a discount to their net asset value, which may increase the risk of loss. Distributions are not guaranteed and are subject to change and/or elimination.
BMO ETFs are managed by BMO Asset Management Inc., which is an investment fund manager and a portfolio manager, and a separate legal entity from Bank of Montreal.
The communication is for information purposes. The information contained herein is not, and should not be construed as, investment, tax or legal advice to any party. Particular investments and/or trading strategies should be evaluated relative to the individual’s investment objectives and professional advice should be obtained with respect to any circumstance.
The viewpoints expressed by the Portfolio Manager represents their assessment of the markets at the time of publication. Those views are subject to change without notice at any time. The information provided herein does not constitute a solicitation of an offer to buy, or an offer to sell securities nor should the information be relied upon as investment advice. Past performance is no guarantee of future results. This communication is intended for informational purposes only.
An investor that purchases Units of a Structured Outcome ETF other than at starting NAV on the first day of a Target Outcome Period and/or sells Units of a Structured Outcome ETF prior to the end of a Target Outcome Period may experience results that are very different from the target outcomes sought by the Structured Outcome ETF for that Target Outcome Period. Both the cap and, where applicable, the buffer are fixed levels that are calculated in relation to the market price of the applicable Reference ETF and a Structured Outcome ETF’s NAV (as Structured herein) at the start of each Target Outcome Period. As the market price of the applicable Reference ETF and the Structured Outcome ETF’s NAV will change over the Target Outcome Period, an investor acquiring Units of a Structured Outcome ETF after the start of a Target Outcome Period will likely have a different return potential than an investor who purchased Units of a Structured Outcome ETF at the start of the Target Outcome Period. This is because while the cap and, as applicable, the buffer for the Target Outcome Period are fixed levels that remain constant throughout the Target Outcome Period, an investor purchasing Units of a Structured Outcome ETF at market value during the Target Outcome Period likely purchase Units of a Structured Outcome ETF at a market price that is different from the Structured Outcome ETF’s NAV at the start of the Target Outcome Period (i.e., the NAV that the cap and, as applicable, the buffer reference). In addition, the market price of the applicable Reference ETF is likely to be different from the price of that Reference ETF at the start of the Target Outcome Period. To achieve the intended target outcomes sought by a Structured Outcome ETF for a Target Outcome Period, an investor must hold Units of the Structured Outcome ETF for that entire Target Outcome Period.
BMO Global Asset Management is a brand name under which BMO Asset Management Inc. and BMO Investments Inc. operate.
®/TM Registered trademarks/trademark of Bank of Montreal, used under licence.