Understanding Gold’s Advantageous Diversification Properties
Apr 18, 2024
Gold is an asset class with an equal share of critics and supporters providing conflicting views on its long-term returns. Mark Webster, Director, Institutional & Advisory, BMO ETFs provides insight into how the precious metal can improve portfolio diversification.
Gold has been coveted for centuries. Mercantilism was the pervasive economic theory before capitalism, and it presumed there was a fixed amount of wealth in the world. In order to control wealth, European monarchs funded global exploration, sending ships to the far reaches of the world to find gold and silver before their competing sovereigns could.
Though capitalism proved that wealth can be created, gold has retained its worth as a store value, a valued asset, representing stability, wealth and authority. Today, gold generates passionate discussions amongst supporters and critics, each side waging different arguments to support their points of view.
Unlike other commodities, gold has very limited industrial uses. Its basic appeal to investors is its diversification properties, due to its low correlation to traditional asset classes. This should be the essence of every investor’s analysis — understanding how much gold to include in a diversified portfolio to improve risk and return profiles.
As the table below shows, spot gold has a very low correlation to either equities or fixed income, so its performance will have a different profile to other investments.
Low Correlation to Other Asset Classes
| Security | S&P500 | USBOND | GOLDS | BCOM | NPNCRE | SPTSX | MXEA | MXEF |
| S&P500 | 1.000 | 0.381 | 0.099 | 0.455 | 0.073 | 0.812 | 0.875 | 0.736 |
| USBOND | 0.381 | 1.000 | 0.539 | 0.287 | -0.180 | 0.350 | 0.512 | 0.503 |
| GOLDS | 0.099 | 0.539 | 1.000 | 0.399 | -0.047 | 0.249 | 0.202 | 0.340 |
| BCOM | 0.455 | 0.287 | 0.399 | 1.000 | 0.232 | 0.626 | 0.547 | 0.579 |
| NPNCRE | 0.073 | -0.180 | -0.047 | 0.232 | 1.000 | 0.108 | 0.033 | 0.007 |
| SPTSX | 0.812 | 0.350 | 0.249 | 0.626 | 0.108 | 1.000 | 0.802 | 0.759 |
| MXEA | 0.875 | 0.512 | 0.202 | 0.547 | 0.033 | 0.802 | 1.000 | 0.858 |
| MXEF | 0.736 | 0.503 | 0.340 | 0.579 | 0.007 | 0.759 | 0.858 | 1.000 |
Source: Bloomberg. Monthly correlation March 2004 – March 2024. (S&P500 = U.S. S&P 500 Composite Index; USBOND = US Aggregate Bond Index; GOLDS = Gold Spot Price; BCOM = Bloomberg Commodity Index; NPNCRE = NCREIF Property Index; SPTSX = TSX Composite Index; MXEA = MSCI EAFE Index; MXEF = MSCI Emerging Markets Index).
Critics of the precious metal often point to higher long-term returns in equities. In practice, annualized returns for gold have been higher over certain periods over the long run.
Gold: Historical Performance
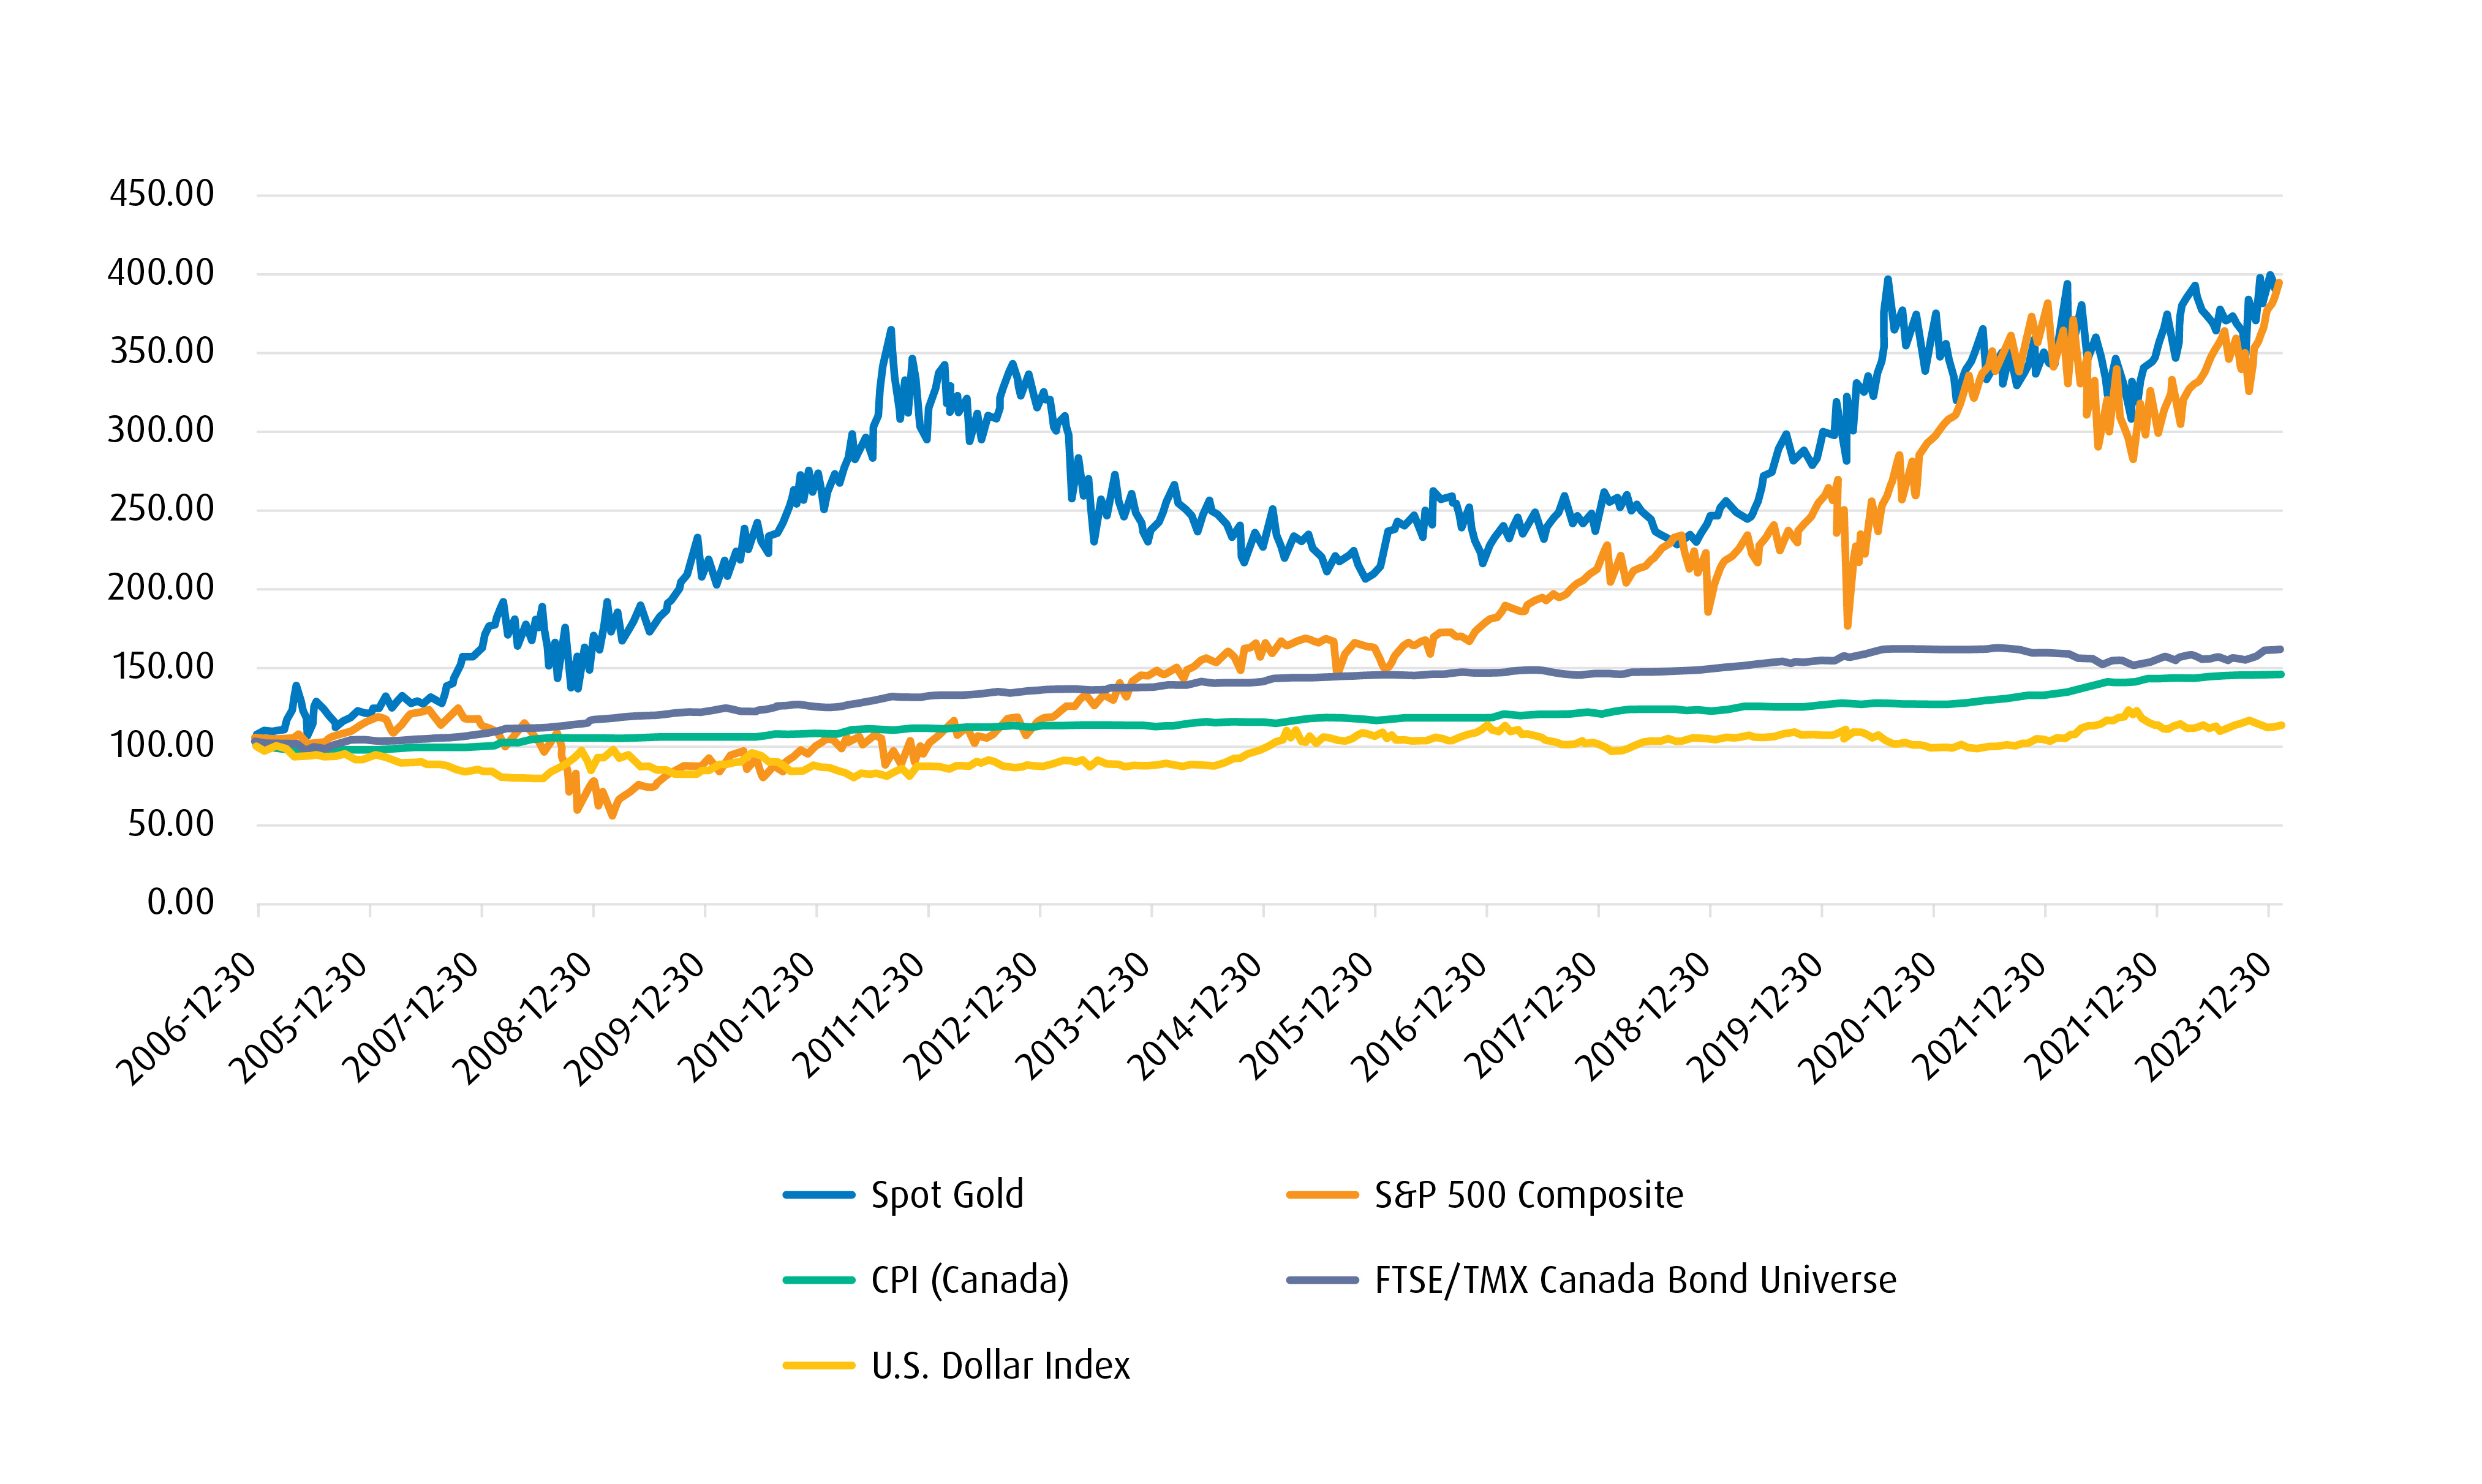
Implemented in a portfolio, gold should be evaluated on the basis of its ability to improve its risk and return efficiency.
To demonstrate gold’s diversification benefits, we took a portfolio that is invested in a conventional “60⁄40” model of equities (60%) and bonds (40%), and compared it to a similar one that owned a 5% allocation in gold. As shown in the table below, even a small exposure to gold improves returns and reduces risk across a number of periods. This illustrates gold’s ability to potentially serve as a long-term strategic holding.
Annualized Returns | 60⁄40 Portfolio | 57.5⁄37.5⁄5 Portfolio | Difference |
3-Year | 4.83% | 4.96% | 0.13% |
5-Year | 6.42% | 6.70% | 0.28% |
10-Year | 5.66% | 5.82% | 0.17% |
Standard Deviation | Portefeuille 60⁄40 | Portefeuille 57.5⁄37.5⁄5 | Difference |
3-Year | 8.47% | 8.16% | -0.31% |
5-Year | 11.00% | 10.57% | -0.42% |
10-Year | 8.72% | 8.41% | -0.31% |
Sharpe Ratio | Portefeuille 60⁄40 | Portefeuille 57.5⁄37.5⁄5 | Difference |
3-Year | 0.57 | 0.61 | 0.04 |
5-Year | 0.58 | 0.63 | 0.05 |
10-Year | 0.65 | 0.69 | 0.04 |
Source : BMO Global Asset Management. Historically a 5% allocation to gold has provided better risk adjusted returns than a traditional 60⁄40 portfolio. A 57.50% Equity, 37.50% Fixed Income 5% Gold portfolio has produced greater returns, lower levels of volatility and higher Sharpe ratios over 3, 5 and 10-year periods. Past performance is not indicative of future returns.1
Currency Hedge
Since the end of the Bretton Woods system in the early 1970s, U.S. dollars have not been convertible into gold. The full removal of the U.S. dollar’s peg to gold meant that the currency would replace gold as the centerpiece to the global monetary system. Even with the dissolution of a gold-backed monetary system, the precious metal continued to retain its value. Central banks hold reserves in storage, particularly in times when fiat currencies have gone through inflationary periods. In the last several years, as inflation has run up in many regions, many prominent central banks have ramped up their purchases of gold.2
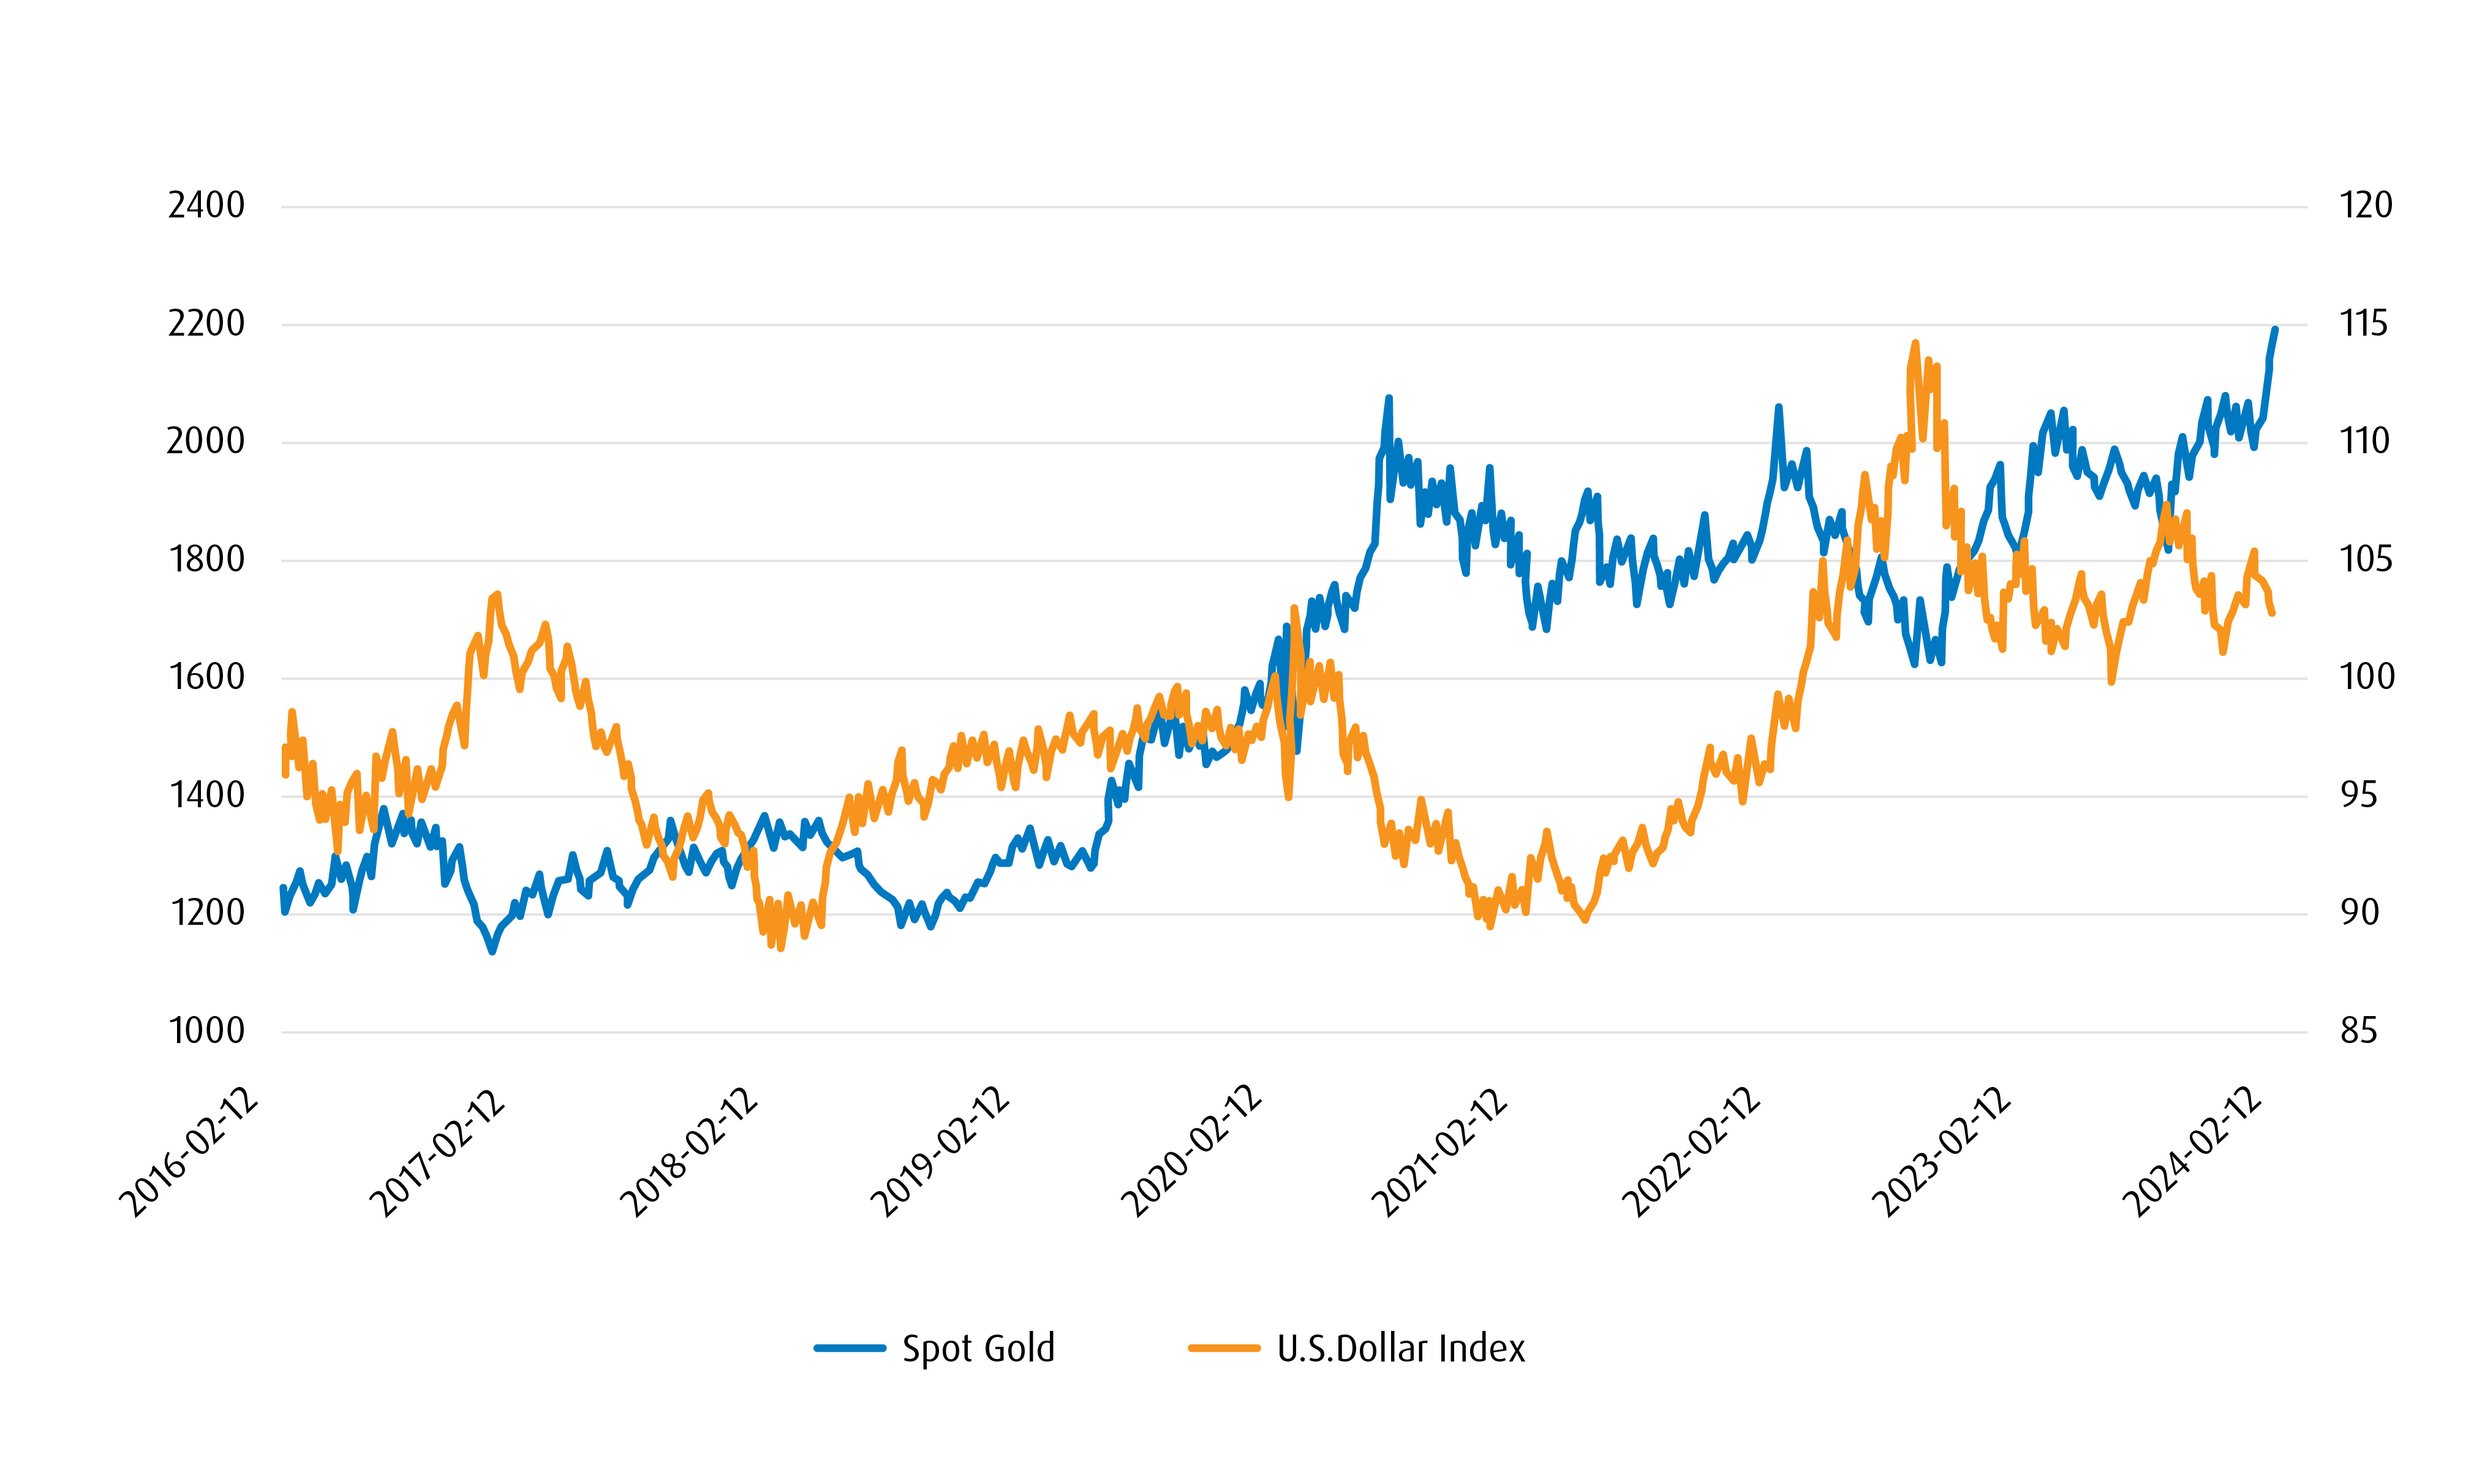
In addition to inflation, many countries have been looking to move away from the U.S. dollar. Talks of “de-dollarization” will likely take many years to transpire, but the BRICS nations (Brazil, Russia, India, China, South Africa, Egypt, et al.) — which are seeking to add additional nations in the near future, are in the early stages of attempting to create a new unified currency backed by gold. As a result, spot gold prices have tended to be inversely correlated to the U.S. dollar index, which further adds to its diversification benefits from a currency perspective.
Gold Spot Price vs. U.S. Dollar Index
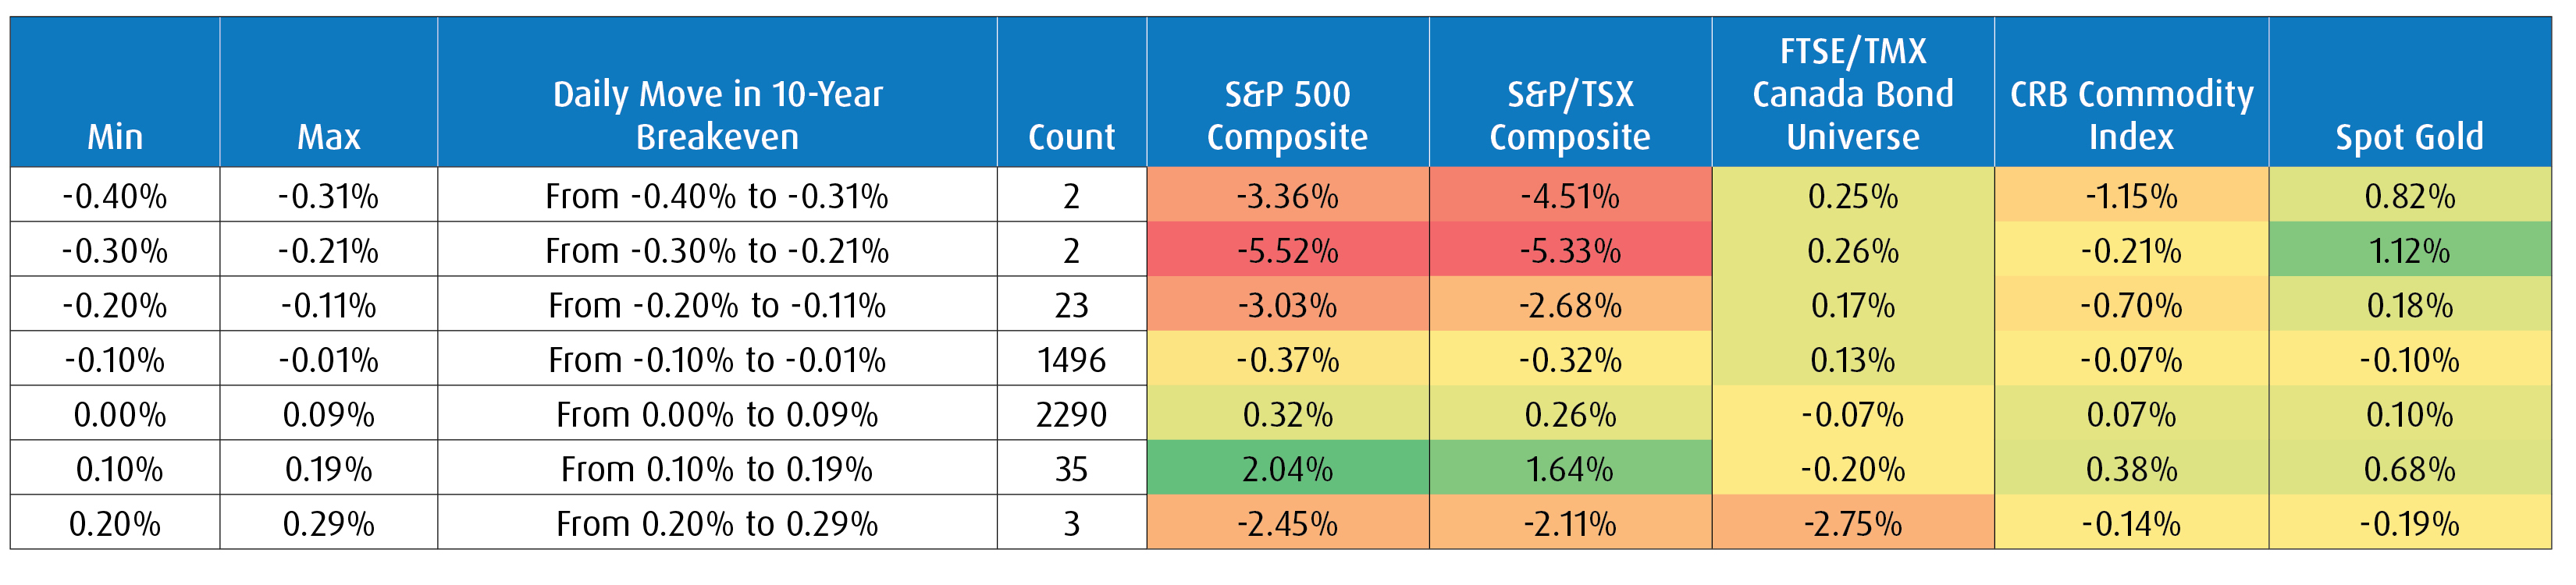
Inflation/Deflation Hedge
In recent years, interest rates have been a focal point for investors given inflationary concerns. The 10-year breakeven point is widely regarded as the market’s expectations for inflation or “implied inflation.” Outside of the last several years, inflation has been relatively muted, which leaves us very little historical data for inflationary periods. However, we can utilize the daily moves in the 10-year break-even rate in order to provide insight in how various asset classes behave in various environments. At times of large moves in the daily move of the break-even rate or periods of high expected inflation, gold has performed well, given it is considered a real asset. On the opposite end, in times of extreme negative changes in the daily break-even, or periods of deflation, gold has also performed well.
This illustrates the benefits of holding gold in a portfolio and its diversification properties in various inflationary regimes.
Access to Gold
BMO’s BMO Gold Bullion ETF (ticker: ZGLD) is backed by 400 oz. bars of physical gold bullion. This ETF allows investors to easily access gold for both strategic as well as tactical portfolio asset allocations uses. ZGLD3 is competitively priced at 20 basis points (0.20%) and also offered in U.S. dollar units (ZGLD.U) and a hedged to Canadian dollar version (ZGLH). The gold in this ETF is stored and secured in a local vault, which means investors can feel assured that it is allocated.
This low-cost and highly liquid exposure should help investors expand their portfolio diversification. In addition, it should be preferred to any U.S.-listing because ZGLD will be listed in Canada, and is thus exempt from U.S. Estate tax concerns.
To learn more about ZGLD or receive other trading insights, reach out to your BMO ETF Specialist at their email address.
1 (60⁄40 portfolio – is composed of 60% S&P/TSX Composite Index and 40% FTSE/TMX Canada Bond Universe Index, 57.5⁄37.5⁄5 portfolio is composed of 57.50% S&P/TSX Composite Index, 37.50% FTSE/TMX Canada Bond Universe index and 5% Spot Gold Index), All components are in Canadian dollar terms. Time period used for calculations are daily from January 2, 2006 – January 31, 2024.
2 Gold Demand Trends Full Year, 2023. January 31, 2024, World Gold Council.
3 Changes in rates of exchange may also reduce the value of your investment.
Disclaimers
Any statement that necessarily depends on future events may be a forward-looking statement. Forward-looking statements are not guarantees of performance. They involve risks, uncertainties and assumptions. Although such statements are based on assumptions that are believed to be reasonable, there can be no assurance that actual results will not differ materially from expectations. Investors are cautioned not to rely unduly on any forward-looking statements. In connection with any forward-looking statements, investors should carefully consider the areas of risk described in the most recent prospectus.
The viewpoints expressed by the authors represents their assessment of the markets at the time of publication. Those views are subject to change without notice at any time without any kind of notice. The information provided herein does not constitute a solicitation of an offer to buy, or an offer to sell securities nor should the information be relied upon as investment advice. Past performance is no guarantee of future results. The statistics in this update are based on information believed to be reliable but not guaranteed.
This article is for information purposes. The information contained herein is not, and should not be construed as, investment, tax or legal advice to any party. Investments should be evaluated relative to the individual’s investment objectives and professional advice should be obtained with respect to any circumstance.
Commissions, management fees and expenses all may be associated with investments in exchange traded funds. Please read the ETF Facts or prospectus of the BMO ETFs before investing. Exchange traded funds are not guaranteed, their values change frequently and past performance may not be repeated.
For a summary of the risks of an investment in the BMO ETFs, please see the specific risks set out in the prospectus. BMO ETFs trade like stocks, fluctuate in market value and may trade at a discount to their net asset value, which may increase the risk of loss. Distributions are not guaranteed and are subject to change and/or elimination.
BMO ETFs are managed by BMO Asset Management Inc., which is an investment fund manager and a portfolio manager, and a separate legal entity from Bank of Montreal.
BMO Global Asset Management is a brand name under which BMO Asset Management Inc. and BMO Investments Inc. operate.
®/™Registered trademarks/trademark of Bank of Montreal, used under licence.